Option G- Urban Environments (from notes) (copy)
1/35
Earn XP
Description and Tags
Name | Mastery | Learn | Test | Matching | Spaced | Call with Kai |
|---|
No study sessions yet.
36 Terms
informal/formal activities
activities that are either:
untaxed and unregulated, or
formally taxed and regulated
Gentrification
improvement of residential areas by residents and immigrants, often changes the economic profile of an area and makes it inaccessible for its initial residents
counter-urbanisation
the movement of population away from larger to smaller urban areas (eg new towns, satellite suburbs)
re-urbanisation/urban renewal
development of activities to increase residential population densities within a preexisting city
urban circular system
a sustainable city in which there is the recycling, reuse and reduction of resources, renewable energy and reduced ecological footprint
suburbanisation
the outward growth of towns to engulf surrounding settlements; may cause a conurbation
urban area
built up area that forms part of a city or town
urban ecological footprint
the amount of land required to sustain a population with appropriate resources and assimilate their waste
characteristics of an urban settlement
an area of habituation that provides services for payment for the surrounding countryside
physical factors influencing site
access to water
hospitable climate
agriculture → arable/fertile land
topography
space (defence, expansion)
functions and land use
accomodation
mining town
transport hub
manufacturing centre
fishing village
administrative centre
Urban layout case study
New York
commercial land in manhattan, centre of queens and staten island
brooklyn, manhattan and the bronx have mixed residential and commercial
staten island, bronx, outside queens is industry and manufacturing
Hierarchy of Settlements
measured by settlement size, generated wealth and number of jobs
hinterland is the hexagonal area around a city that is supported by it
distance decay- people will travel less far for lower quality goods
sphere of influence- where people come from to buy things
threshold population- amount of people to support a shop
low order goods- bought frequently eg food
high order goods- bought less often eg appliances
Megacities
> 10 million people
economic growth, rural-urban migration
dominated by young adults due to birth rates
contain 7% of world’s population
all but four megacities in developing regions, 12 in china, 34 megacities in 2020
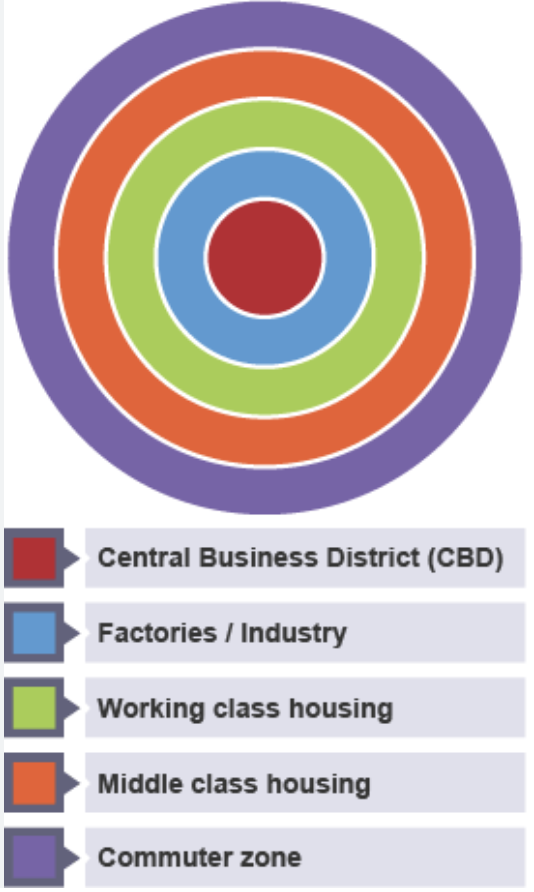
The Burgess Model
1925
assumptions
city is flat
easy transport
high land value in city centre
oldest buildings in city centre
poorer classes must live near work
criticisms
zones undefined, not mixed
oldest housing not always in centre
cities rarely boundless or flat
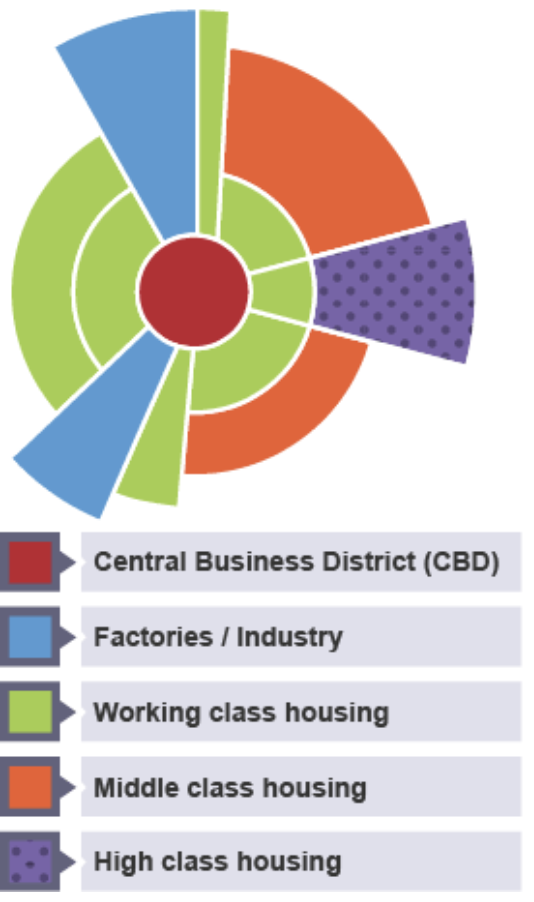
The Hoyt Model
1939
assumptions
wealthy live near transport
cars affordable
similar land = similar land use
certain functions repel each other
criticisms
low cost housing doesn’t guarantee transport
no planning controls
discounts suburbs
discounts topography
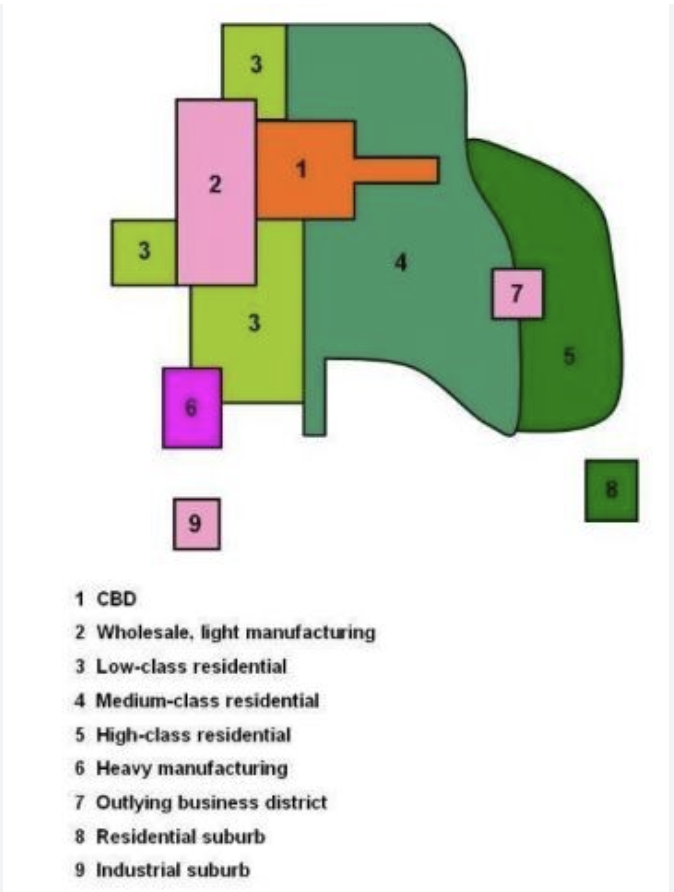
Harn and Ullman’s Multiple Nuclei Model
1945
assumptions
cbd is near original retail
warehousing/light industry adjacent to cbd
heavy industry on outskirts
residential in remaining space
criticisms
may not apply to asia
non existence of abrupt divisions
negligence of building height
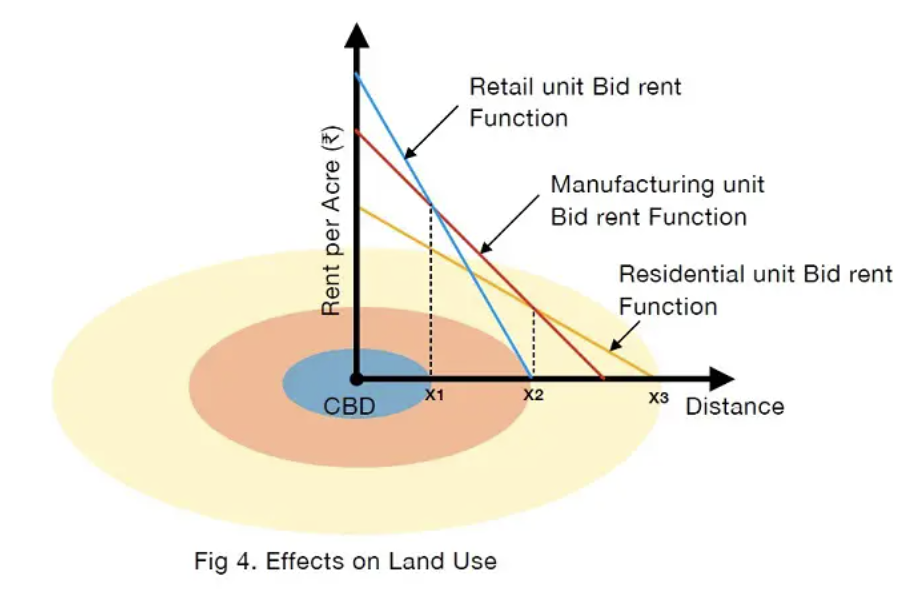
Bid rent theory
peak land value intersection- point closest to cbd (0,0 on graph)
model shows pattern of economic activity
land closer to the cbd is owned by more competitive industries such as retail, while less competitive industries operate on the outskirts
land closest to cbd = highest profit = most valuable
factors affecting location of residential areas
physical factors
location of land features eg mountains
aesthetic beauty and closeness to nature
proximity to services
closeness to cbd
land values
high density in medium closeness: too close = expensive, too far = not valuable
high quality housing is newly built on the outskirts - lower class needs to be close to cbd to find work
suburban density decreased since 1980s
ethnicity
ethnic groups live together to seek cultural support and community
waves of migration happening at the same time, move to new developments - becomes a hub for that culture
urban deprivation
physical indicators - housing quality, pollution, crime
social indicators- health crime, education, unemployment, lone parent families
economic indices- available jobs, income
political indices- voting, community action
slums and squatter settlements
980 million slum dwellers globally in 2015
78.2% of urban population is in LICs
informal economic activity
dual economy- formal economy and informal economy
informal economy
bazaar economy- small scale trade establishments, 45% of city employment, low price competition
street economy- hawkers, shoe shiners, beggars, thieves, prostitutes, 20% of labour force, low earnings
Urban social deprivation case study
Dharavi
45% of Mumbai lives in slums
1 million people live in Dharavi- 175 hectares
tin shacks, tarp/tin roofs, upgrading to brick
many have successful businesses or careers
markets, tourism, personal small businesses eg laundry
formal and informal economy
average $3 per day- cheap to outsource here
recycling in Mumbai
only slum with a billion dollar economy
water flows for 2h a day, but most homes have electricity, public toilets
authorities turn a blind eye to environmental waste
free state education till 14
high sense of community
Centrifugal population movements
away from city centre
suburbanisation
counter-urbanisation
Rural Urban migration
urbanisation- more people moving to urban areas
natural increase- birth rate is higher than death rate
push factors- lack of services, jobs
pull factors- more services, jobs
Rural Urban Migration Case Study
China
male family members move to cities and send money home to family
labour jobs with low education
close to 1 billion Chinese live in urban areas in 2030s
Hukou arrangement- people must stay in certain provinces to access rights and services, registered by household
many villages demolishes to urbanise, removes jobs for farmers
70% of China will live in cities if the govt hits its goal
urban consumers feed city conglomerates
deindustrialisation
caused by:
resources exhausted, materials expensive
automation/new technology
competition from rivals/reduction in demand
lack of capital, subsidy withdrawal
rationalisation- making things more efficient drains company of self sufficiency
Urban Social Deprivation/Deindustrialisation Case Study
Detroit’s Vehicle Industry
Packard Auto Plant - 3.5 million square feet, 36000 employed
closed in 1958 due to reduced demand, increased cost (globalisation; competition)
2 million population in 1958 has steadily declined since
riots in 1967 due to joblessness and suburbanisation
cleanup crews salvage from abandoned lots
yet, people don’t always report the good
Cycle of Urban Deprivation in Detroit
social + emotional deprivation → lack of education → poor work opportunities → poor relationships → inadequate parenting → inadequate support measures → social + emotional deprivation
Urban microclimates
distinctive climate of a small scale area
affected by:
radiation and sunshine- scattered by dust
clouds and fogs
temperatures- regulation, sun/shade
pressure and winds- gusting around tall buildings
humidity
precipitation
urban air pollution- impacts 50% of world’s urban population
cars and industry
LICs cannot cope as well
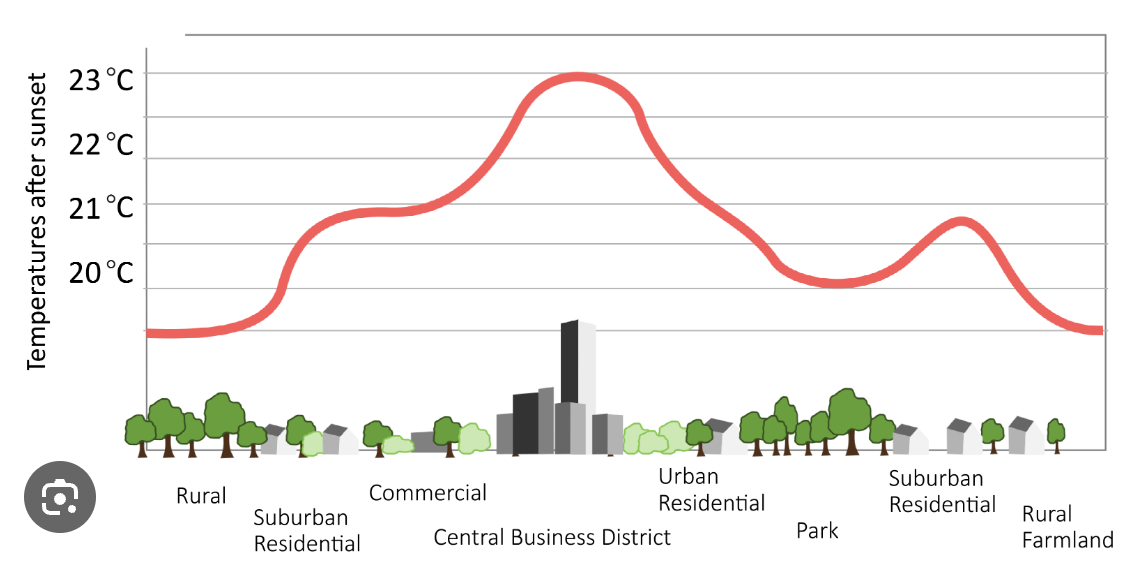
Urban heat island effect
heat increases due to dark roads and roofs absorbing heat, lack of tree cover, emissions of dust and gas
Case Study: Contested Land
Slum Clearance in Rio
2016 olympics caused the clearance of central favelas to make space for the grounds
drug gangs removed
average house price rose by 165% between 2012-2016
170,000 people displaced- Favela de Metro 1000 residents displaced for parking
Urban Growth Projections
countries in Africa predicted to grow most, along with Southeast Asia
many large countries reaching maximum population and growth is starting to slow
Global population expected to max out at 11 billion in 2100
Resilient cities
economically productive- employment
socially inclusive- mobility, living space
environmentally friendly- climate change adaptation/mitigation, footprint
copes with acute and chronic threats
if not: social unrest, environmental damage, high emissions, low gdp, high unemployment, congestion, homelessness
Threats to cities
Chronic
overtaxation
inefficient politicians
unemployment, violence,
resource shortages and waste disposal
Acute
natural disasters
disease
terrorism
war
Eco Cities
compact cities = less congestion, overpricing, pollution
achieved by
reducing fossil fuels
locally treating waste
sufficient green spaces
reclaiming brownfield spaces
encouraging community involvement
conserving non-renewables, using renewables
Case Study: Eco Cities
Masdar, UAE
capital of United Arab Emirates
no cars- parked outside, trains used
150 live there, ideally 90,000
Masdar Institute = graduate research facility
light management, air compression to cope with dry climate
oriented 45 degrees off sun = 15 degrees cooler than Abu Dhabi
concentrated solar panels using mirrors to capture more sun
motion sensors, water recycling