Week 8 - Population Genetics and Evolution at the Population, Species, and Molecular Levels
1/44
Earn XP
Description and Tags
Chapter 20
Name | Mastery | Learn | Test | Matching | Spaced |
|---|
No study sessions yet.
45 Terms
What is population genetics?
Study of allele frequencies and genotype frequencies within and between populations, examining how they change over time due to evolutionary forces.
Mendelian Genetics vs. Population Genetics
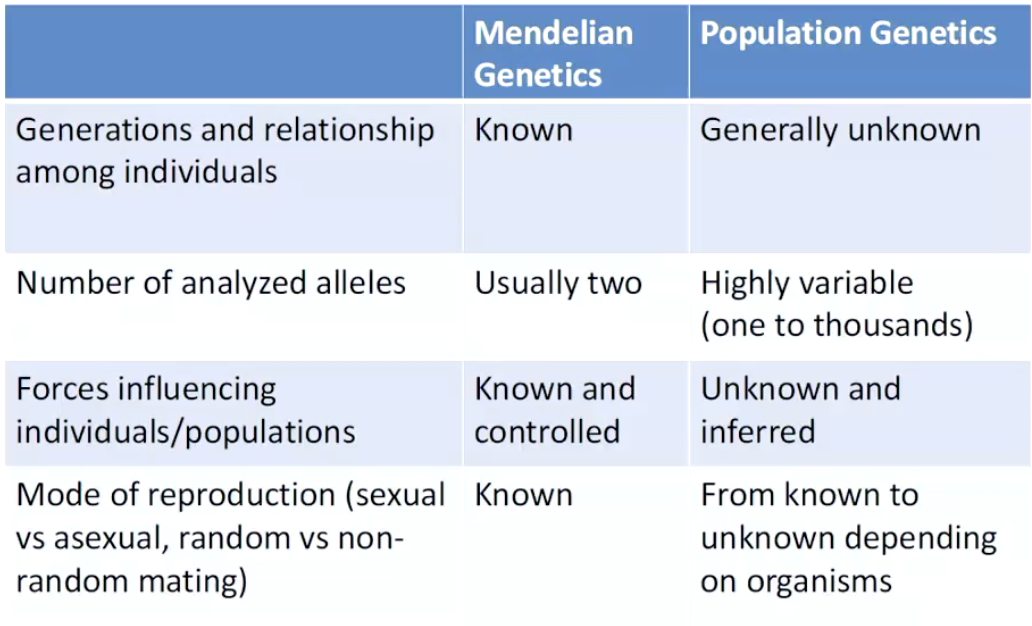
What is a population in genetics?
A group of interbreeding organisms that share a common gene pool.
What is a gene pool?
The collection of genes and alleles present among members of a population.
How does evolution relate to population genetics?
The change in allele frequencies and genotype frequencies within and between populations over time, influenced by factors like mating patterns (sexual selection), genetic drift, natural selection, mutation etc.
Who developed the Hardy-Weinberg Equilibrium principle?
Godfrey Hardy and Wilhelm Weinberg independently formulated the principle and concluded that random mating and absence of evolutionary change leads to stable allele frequencies in populations.
What does Hardy-Weinberg Equilibrium describe?
A population in genetic equilibrium - used to calculate expected frequencies of alleles and genotypes of interest in large populations.
What are the key assumptions of HWE?
Population size is infinite.
Random mating (no sexual selection).
No natural selection.
No migration or gene flow (no introduction of new alleles from other populations).
No mutations introducing new alleles.
No genetic drift.
What predictions does HWE make?
Allele frequencies remain stable over time.
The distribution of alleles into genotypes follows a predictable pattern.
Stable equilibrium frequencies of alleles and genotypes are maintained.
Evolutionary effects and non-random mating are predictable.
HWE calculates expected genotype and allele frequencies when evolution does not occur.
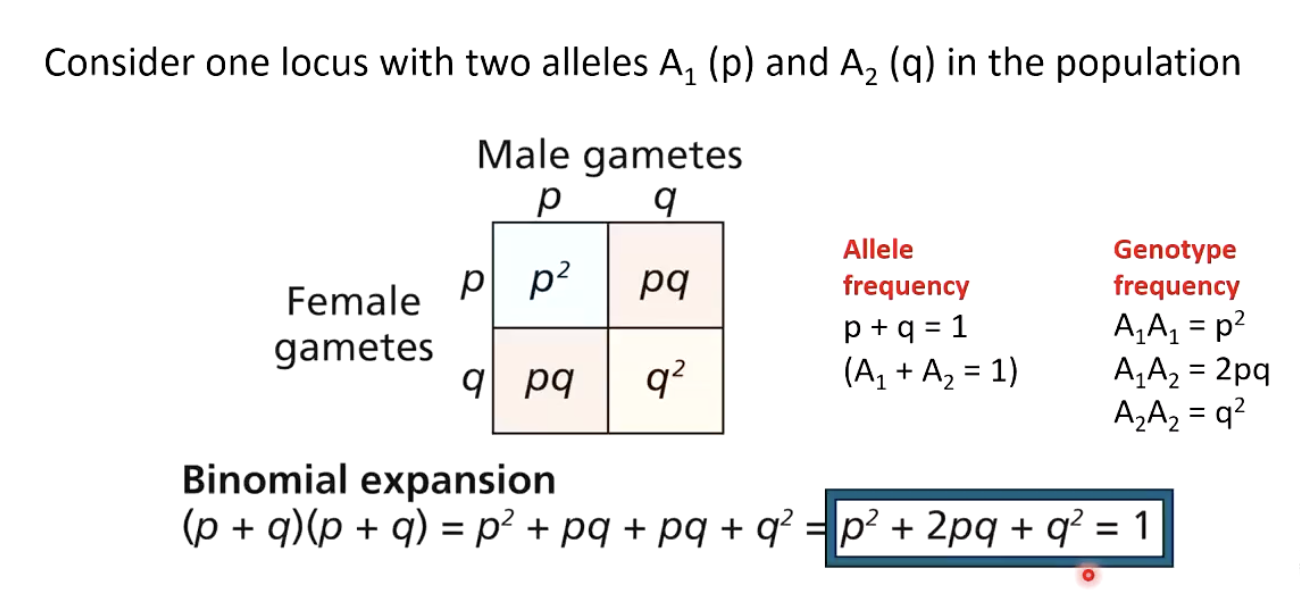
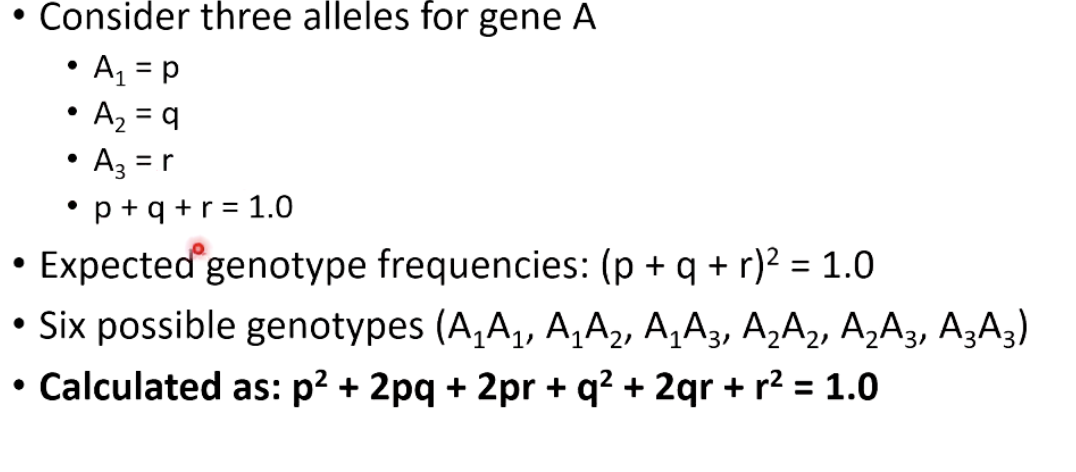
What is the fundamental equation of Hardy-Weinberg Equilibrium for two alleles?
p+q=1, where:
p = frequency of allele A1
q = frequency of allele A2
How do you calculate genotype frequencies under HWE?
Homozygous dominant (A1A1): p²
Heterozygous (A1A2): 2pq
Homozygous recessive (A2A2): q²
Binomial Expansion: p²+2pq+q²=1
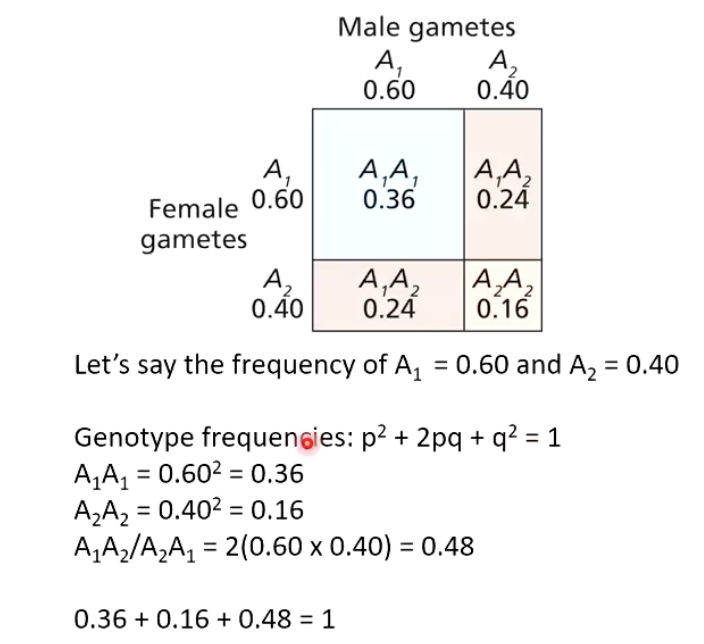
If the allele frequencies are A1 = 0.6 and A2 = 0.4, what are the expected genotype frequencies if no evolution is occuring?
A1A1: (0.6)²=0.36
A2A2: (0.4)²=0.16
A1A2: 2(0.6×0.4)=0.48
0.36+0.16+0.48 = 1
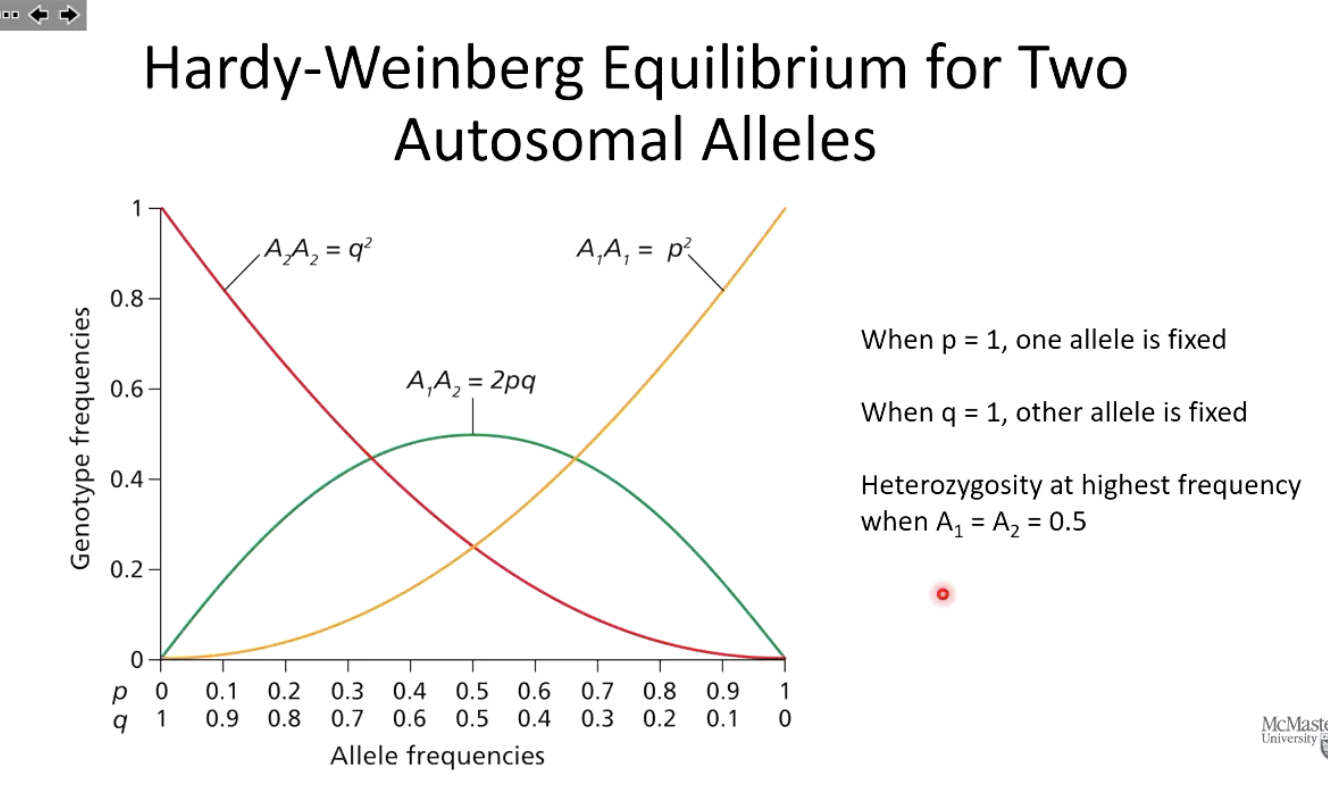
What does the Hardy-Weinberg Equilibrium graph for two autosomal alleles illustrate?
The graph shows the relationship between allele frequencies (p and q) and genotype frequencies (p², 2pq, q²) in a population under Hardy-Weinberg Equilibrium. It highlights that:
When p=1 or q=1, one allele is fixed, and the other is lost (no variation exists).
Heterozygosity (2pq) is at its highest when p=q=0.5 (most genetic diversity possible).
Homozygous genotypes (A1A1=p² and A2A2 = q²) increase as one allele becomes more dominant.
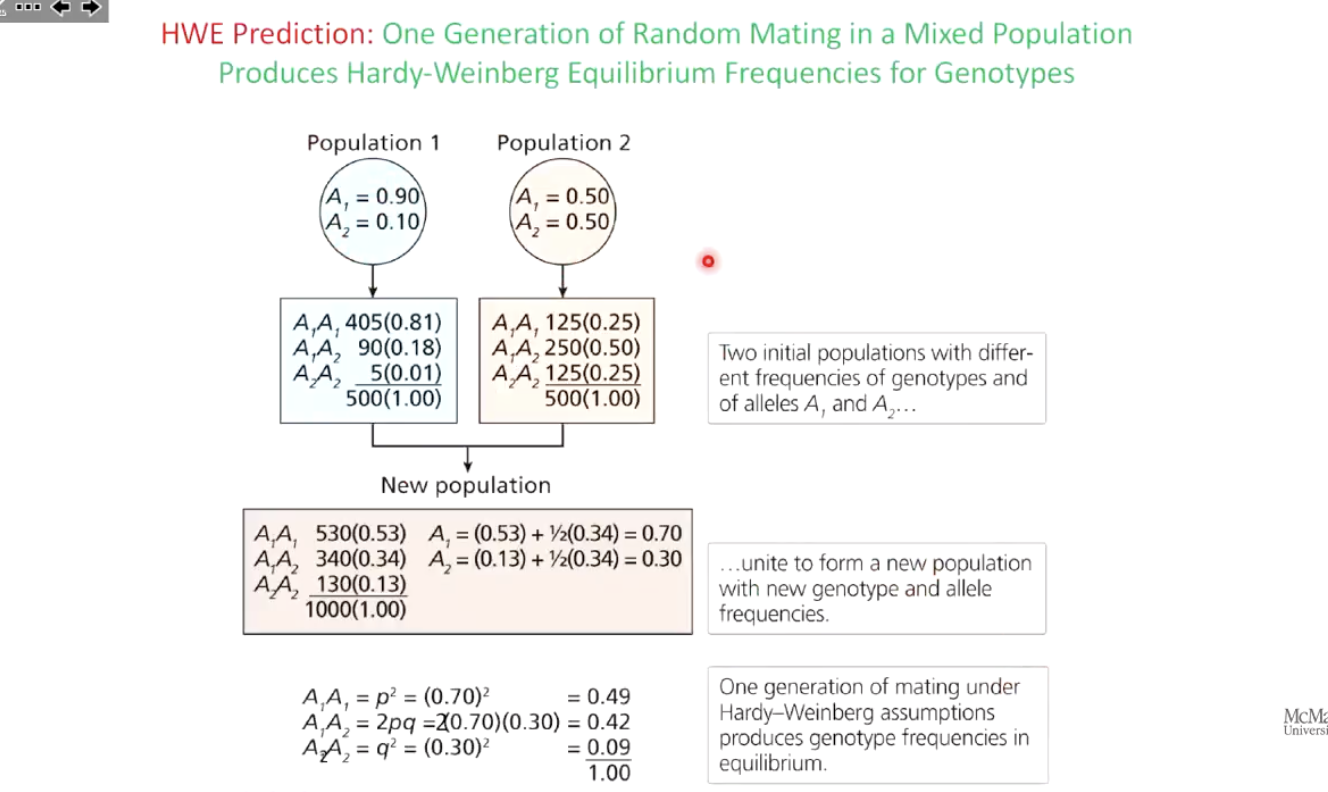
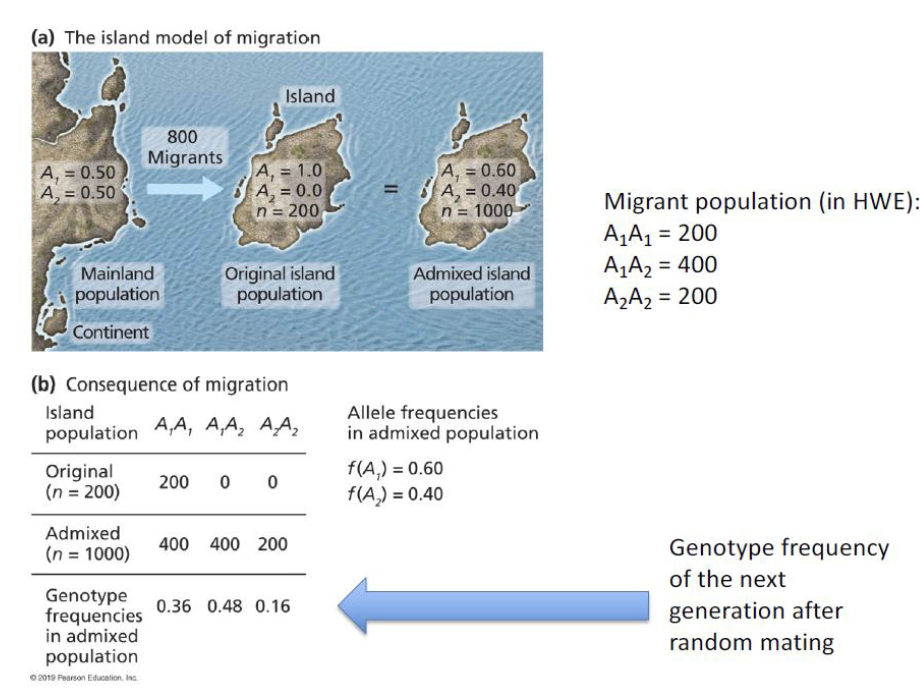
What does the Hardy-Weinberg Equilibrium (HWE) prediction state about one generation of random mating in a mixed population?
The HWE prediction states that when two populations with different allele frequencies merge and undergo one generation of random mating, the resulting genotype frequencies will reach Hardy-Weinberg equilibrium. This is demonstrated by the new population having allele frequencies A1=0.70 and A2=0.30, which lead to genotype frequencies predicted by HWE:
A1A1=p²=(0.70)²=0.49
A1A2=2pq=2(0.70)(0.30)=0.42
A2A2=q²=(0.30)²=0.09
This confirms that random mating in a mixed population results in equilibrium genotype frequencies.
2 methods to determine autosomal allele frequencies from genotype frequencies in populations
Gene counting method
Requires genotypes of all members to be identifiable (heterozygotes can be distinguished from homozygotes)
Useful for codominant alleles
Square root method
Used when gene has 2 alleles with a dominant-recessive relationship
Simply take square root of q², then p is calculated as 1-q
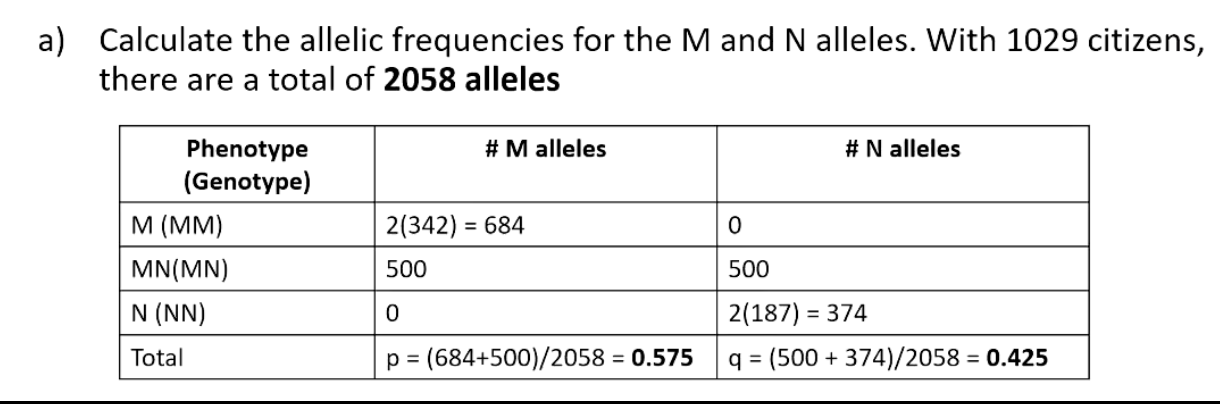
Like the ABO blood system, the MN blood system examines additional antigens on red blood cells for purposes of transfusion. The M and N alleles are codominant and encode different antigens. In a survey done in Hong Kong among 1029 citizens, 342 people had the blood type M (MM genotype), 500 people had blood type MN, and 187 people had blood type N (NN genotype).
a) Calculate the allelic frequencies for the M and N alleles
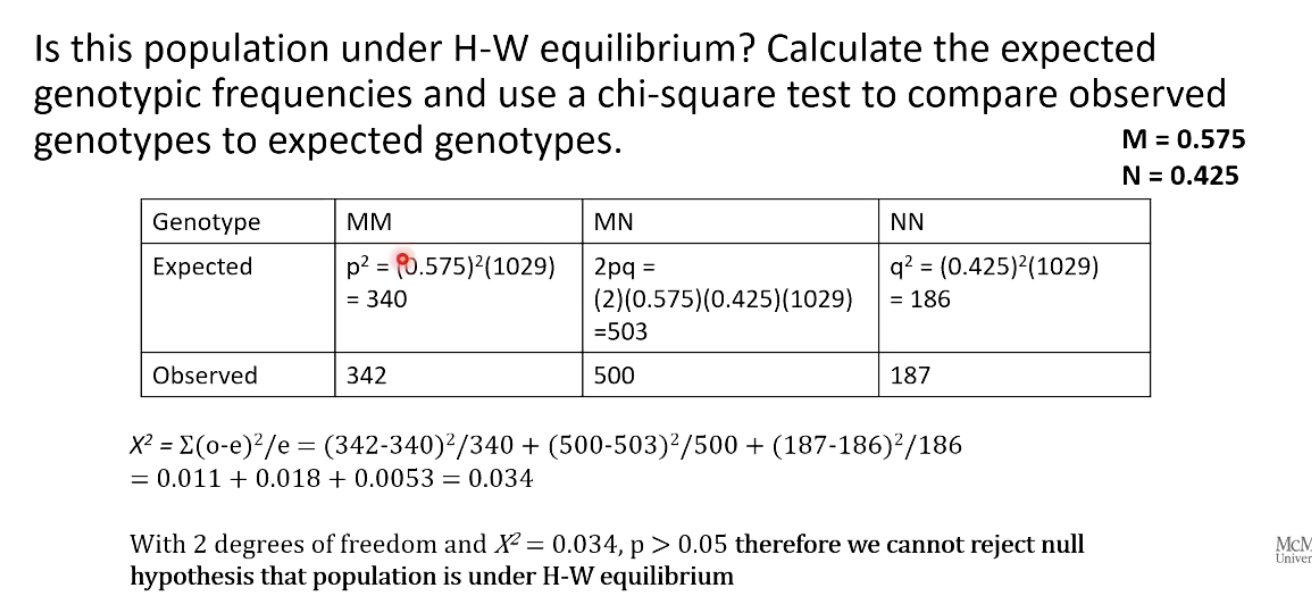
b) Is this population under H-W equilibrium? Calculate the expected genotypic frequencies and use a chi-square test to compare observed genotypes to expected genotypes.
pg 732
What is the square root method, and when is it used?
Used to estimate allele frequencies when a recessive phenotype frequency is given. If q² is known, q is found by taking the square root, and p=1−q.
Assumes HW equilibrium
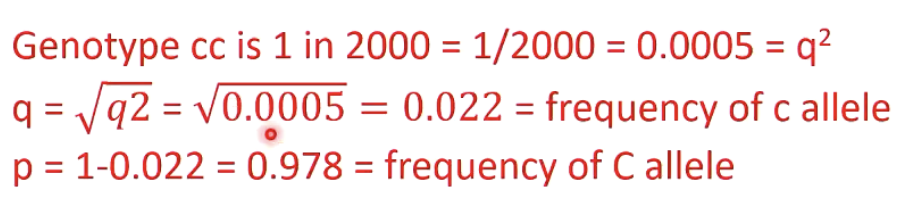
In the US population, the frequency of cystic fibrosis among infants
is 1 in 2000. Cystic fibrosis is an autosomal recessive condition
where the allele, c, causes the disease in homozygous individuals
whereas the dominant allele, C, does not cause disease. Given this
information, and assuming Hardy-Weinberg conditions, calculate
the allele frequency of C and c.
How many possible genotypes exist when three alleles are present?
Six
What is relative fitness (w)?
Can quantify natural selection intensity.
Measures an individual's reproductive success compared to others in the population.
The highest reproductive success is represented by w=1.0.
What is the selection coefficient (s)?
Represents the reduction in fitness of an individual relative to the most fit individual.
Calculated as s=1−w.
Example: If individual A has w=1.0 and individual B has w=0.8, what is the selection coefficient?
s=1−0.8=0.2
This means that Individual B has a 20% reduction in fitness compared to Individual A and reproduces 80% as effectively as Individual A.
An additional selection coefficient (t) is used when there are relative fitness scores associated with more than 2 genotypes (similar to p and q).
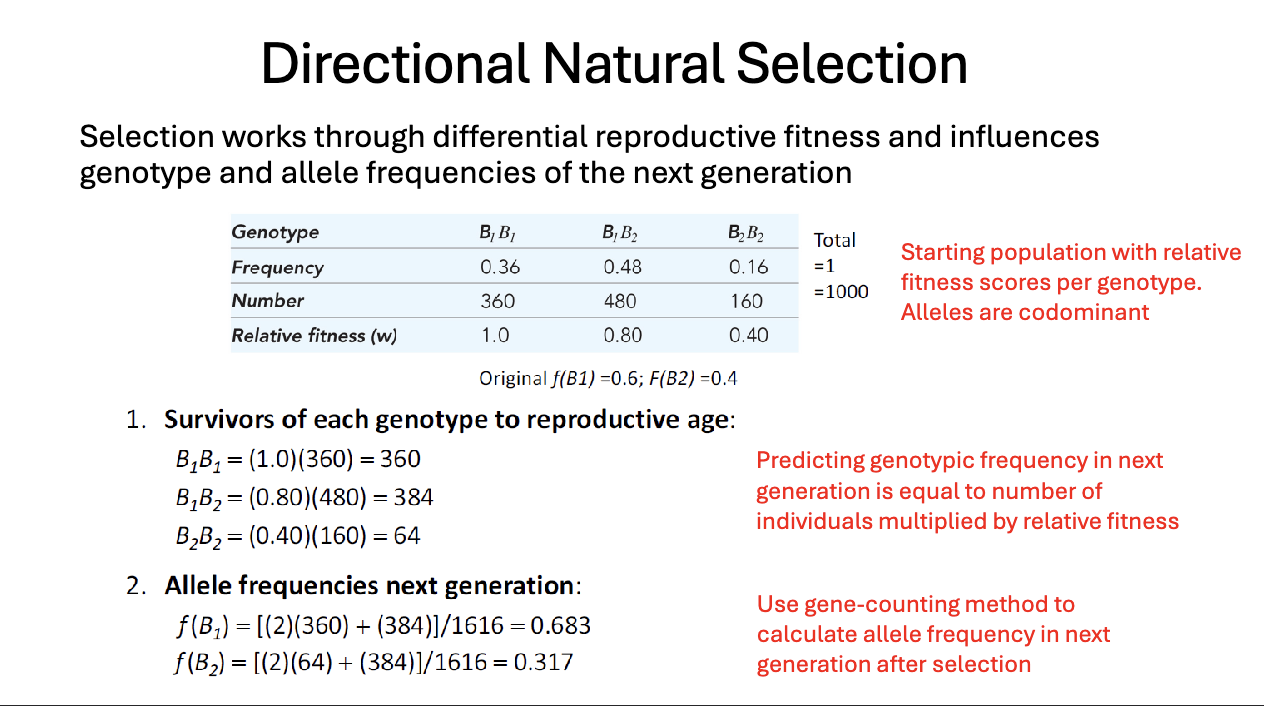
How does directional natural selection affect allele frequencies?
Favors certain genotypes with higher relative fitness (w), leading to changes in genotype and allele frequencies in the next generation. Over time, the favoured allele increases in frequency, driving evolutionary change.
2 selection coefficient values
s = 1-0.8=0.2
t=1-0.4=0.6
To predict the genotypic frequency in the next generation under selection:
Multiply the number of individuals in each genotype by their relative fitness (w).
Calculate the total surviving individuals after selection.
Determine the new genotype frequencies by dividing the number of survivors of each genotype by the total survivors.
Use the gene-counting method to calculate the allele frequencies in the next generation.
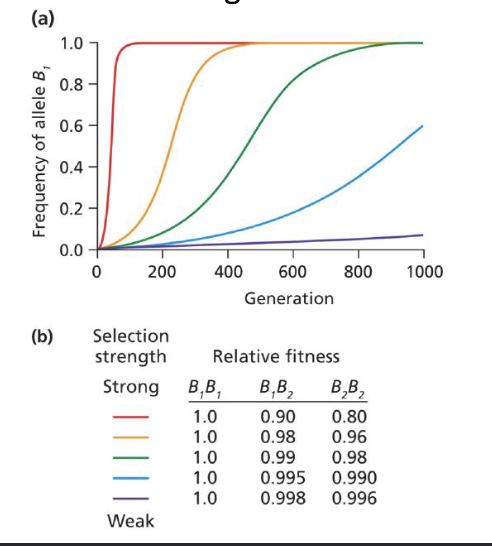
What happens to allele frequencies when selection intensity remains unchanged?
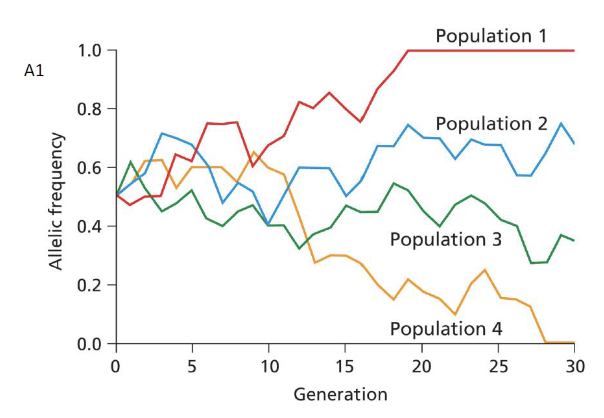
If a beneficial allele has a higher relative fitness and selection remains constant over time, the favored allele can become fixed in the population (frequency = 1.0), while the disadvantageous allele is lost.
Strong selection leads to allele being fixed FAST (red line)
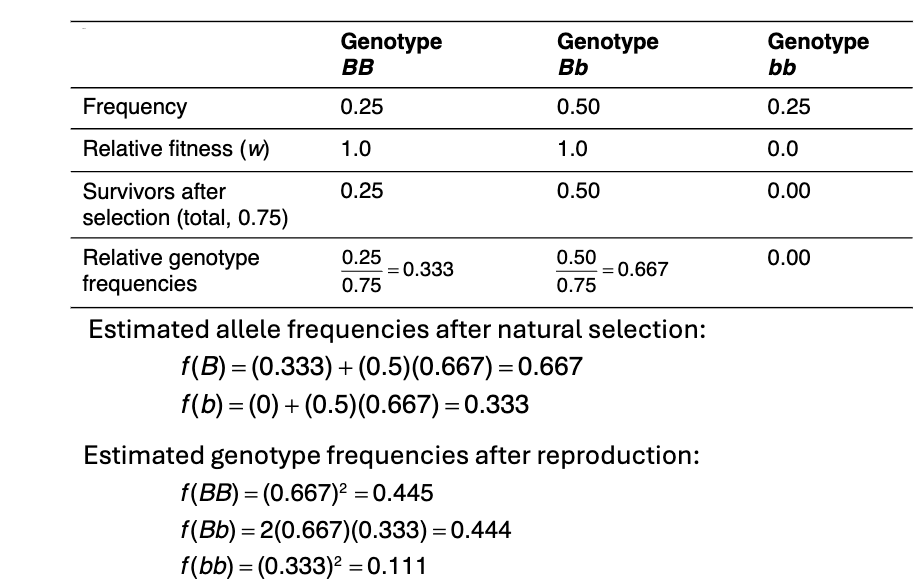
What happens in a population when a recessive lethal allele is present?
The homozygous recessive genotype (bb) does not survive (w = 0), so it is eliminated from the population after selection.
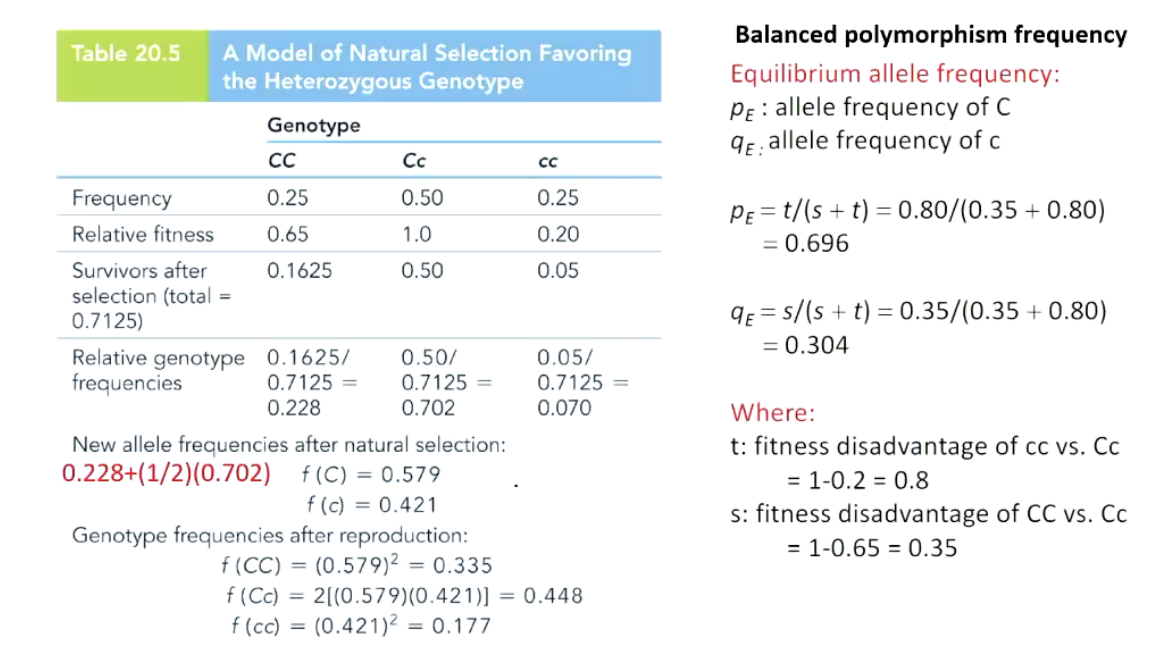
Note can also be written as:
((2)0.333 + (0.667))/2 = 0.667
What happens when natural selection favours heterozygotes?
Balancing Selection (Balanced Polymorphism)
Heterozygotes have a fitness advantage, maintaining both alleles in a population.
Stable equilibrium of allele frequencies is reached.
Selective pressures keep the mutant allele in heterozygotes but act against it in homozygotes.
Prevents allele fixation, preserving genetic diversity.
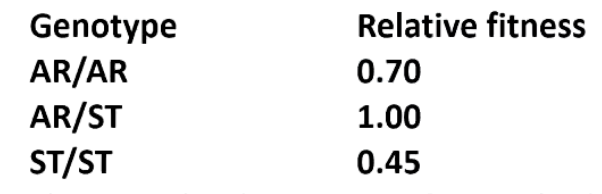
In a Drosophila species, a naturally occurring autosomal inversion is found in two forms, Arrowhead (AR) and Standard (ST). Flies can be homozygous for either chromosome form (AR/AR or ST/ST) or they can be heterozygous (AR/ST). Relative fitness values were assessed for each genotype:
a) Describe the pattern of natural selection operating on these chromosomes. What is the expected outcome of the two chromosome forms?
b) Calculate the balanced polymorphism equilibrium frequencies of AR and ST.
p736
a) Natural selection with heterozygote advantage is clearly operating on these genotypes since heterozygotes have the highest fitness. Both chromosome forms will remain at equilibrium values determined by the relative strength of natural selection against each form.
b) Let s = selection coefficient of AR and t = selection coefficient of ST
s = 1 - 0.7 = 0.30
t = 1 - 0.45 = 0.55
pE = t/(s+t) = 0.55/(0.30 + 0.55) = 0.65
qE = s/(s+t) = 0.30/(0.30 + 0.55) = 0.35
What factors influence genotype and allele frequencies in populations?
Selection, mutation, gene flow, genetic drift, and inbreeding.
What is mutation and how does it impact genetic variation in populations?
The ultimate source of all new genetic variation. It creates new alleles in populations, diversifying the gene pool.
What is the forward mutation rate (μ)?
The rate at which new alleles are created through mutations.
What is the reverse mutation rate (v)?
The rate at which mutations revert to the original allele.
When do allele frequencies remain stable over time?
Remain stable if:
Forward mutation rate = Reverse mutation rate
No other evolutionary forces (e.g., selection, genetic drift, migration) act on the population
What is gene flow in a population?
Occurs through the movement of organisms and genes between populations, which can introduce new alleles, increase or reduce allele frequencies, and create admixed populations.
What is the Island Model of Migration in the context of gene flow?
Describes gene flow as the movement of organisms between isolated populations, affecting allele frequencies and gene diversity.
Island 1 has equal frequency of A1 and A2
Island 2 has A1 fixed
If 800 migrants from Island 1 move to Island 2, it creates an admixed population
What is genetic drift?
Refers to random fluctuations in allele frequencies due to "sampling bias," particularly in small populations. It occurs through chance events that can alter gene frequencies over time.
Figure: 4 populations have allele frequencies randomly drifting over time through a Brownian motion model.
Brownian motion model predicts tiny incremental changes with random leaps
With small populations, these changes seem prominent but with large population, changes can be buffered out (less random skew)
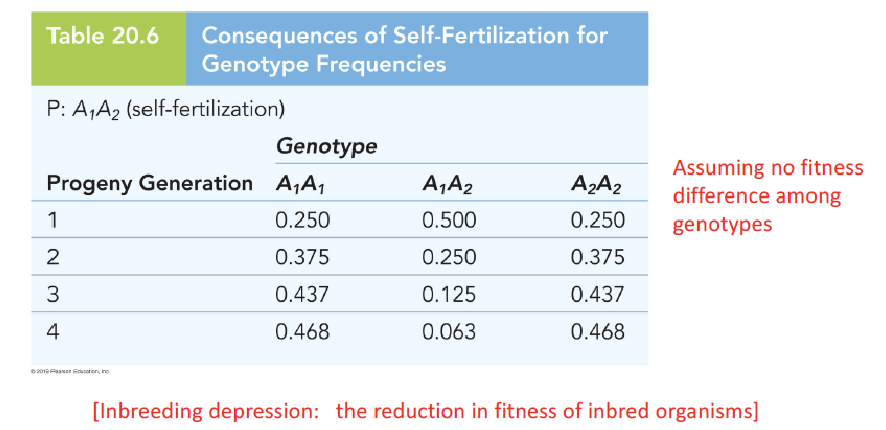
How does inbreeding affect heterozygosity in a population?
Increases homozygous genotypes and reduces heterozygosity, as it involves mating between related individuals.
Assume no fitness difference among genotypes
Inbreeding depression: the reduction in fitness of inbred organisms
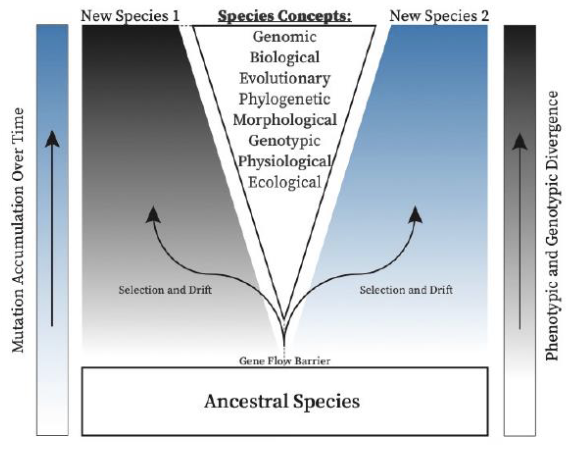
What is reproductive isolation in speciation?
Occurs when populations of organisms can no longer interbreed with each other, leading to speciation.
What is the Biological Species Concept (BSC)?
Defines a species as a group of organisms that can interbreed with each other but are reproductively isolated from other species.
What is allopatric speciation?
Occurs when populations diverge due to a physical barrier, leading to the development of new species in separate geographic locations.
Over time, mutations can accumulate in each environment which can make them into different species
What is sympatric speciation?
Happens when populations share the same territory but are isolated by genetic, behavioral, temporal, or other barriers that prevent gene flow, leading to the formation of new species within the same area.
Can sympatric speciation coincide with allopatric speciation?
Yes, populations may first diverge when geographically separated, and when they come back into contact, they may continue to diverge in a sympatric manner.
What is hybrid speciation?
Occurs when new species form due to hybridization between two existing species, leading to a distinct genetic makeup in the hybrid offspring.
How do Hawaiian Drosophila species provide evidence for allopatric speciation?
The phylogenetic relationships of Hawaiian Drosophila species align with geological evidence of island formation, suggesting that colonization of new islands leads to allopatric speciation - founder effect.
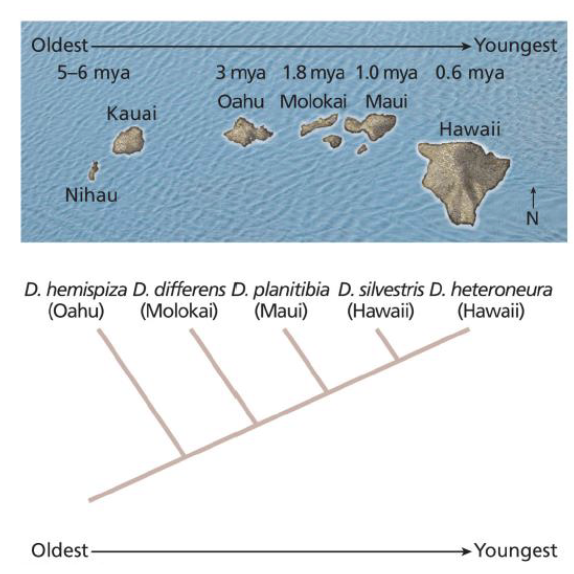
What is the founder effect?
Occurs when a small population enters a new, isolated territory, leading to genetic drift and inbreeding, which can alter allele frequencies and lead to speciation.
Mechanisms of Reproductive Isolation
Pre-zygotic: Prevent 2 individuals from mating in the first place, such as difference in behaviours or incompatibility with anatomical features. If these barriers are strong, these can lead to divergence over time - sympatric speciation.
Post-zygotic: Separate members of populations can successfully mate, but something happens after fertilization that leads to inviable offspring.
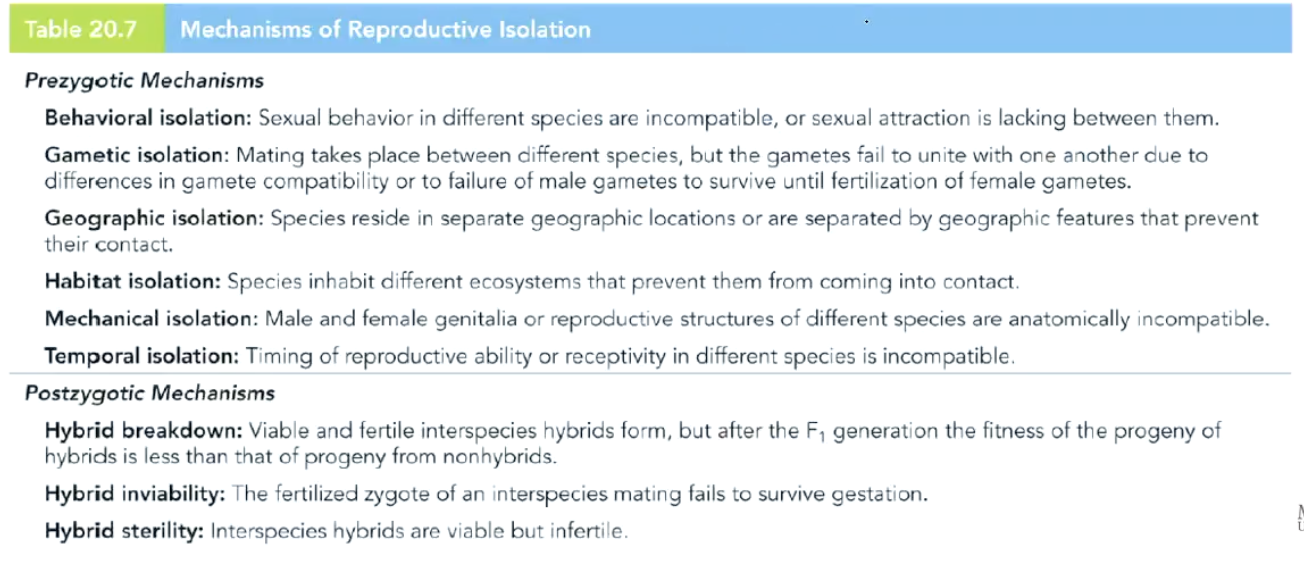
What is behavioral isolation in reproductive isolation mechanisms?
Occurs when sexual behaviors in different species are incompatible or there is a lack of sexual attraction between them, preventing interbreeding.