BCIT - Test 1 M1-6 - Ambulatory ECG's - CARD 4201
1/184
There's no tags or description
Looks like no tags are added yet.
Name | Mastery | Learn | Test | Matching | Spaced |
|---|
No study sessions yet.
185 Terms
The inherent rate of the sinus node impulse without any nervous influence is approximately
100bpm
Phase shift
shows the displacement of a waveform over time, showing the number of beats occurring in a given period of time
Frequency modulation
display the various tall and short wave forms
The greatest benefit of digital recording
accurate, high fidelity and noise free recordings that allow for powerful, online analyzing capacity. it is a linear time-invariant=no phase distortion
Basis of analong analysis
complex criteria comparison- P-QRS- T complexs are compared to a select normal example (polarity, morphology, time signature)
baseline artefact
caused by body position, lead wire movement, loose electrodes or perspiration. Most time consuming and arduous part is reading through it
The areas which have implications in digital recorder research are
heart rate variability (HRV), T wave alternans and spectral analysis
area of continued development
specalized algorithms for dynamic analysis
solid state systems
detect and analyze charateristics of arrhythmias, ischemia, and HRV by learning the morphology, patterns and areas of normal beats and compares them to that criteria to ID abnormal patterns
Signal Averaged ECG
amplifying the recorded QRS signal in order to detect abnormal electrical potentials in the form of late potentials which occur during the repolarization
basis of signal averaged ECG
elimination of signals recorded from background potentials (muscle artifact 8-10uv)
temporal or spatial techniques
reduces background potentials to less than 1uv
Time-Domain QRS Averaging
used to amplify, detect and then analyze late potentials of microvolt amplitudes in the QRS complex. Unwanted noise (such as myopotential) is suppressed.
which filter is the most successful in these systems
40 Hz high pass bidirectional filter
Bipolar XYZ leads can be averaged, filtered and combined in a vector recording called filtered QRS complex. The analysis will include:
filtered QRS complex
root mean square voltage in the terminal 40 ms of filtered QRS complex < 20 µv 9
duration of signal < 40 µV in terminal QRS complex >38 ms
Frequency-Domain QRS Averaging
information about the rate and synchronization of depolarization of the ventricles.
Three algorithms are used to obtain QRS frequency data:
- continuous transform of a continuous signal
-continuous transform of samples of the signal
-discrete transform of the samples -samples the scaled continuous transform
The most common application of signal averaging
risk stratification for sustained ventricular arrhythmias, in patients in sinus rhythm post MI, risk of inducible sustained VT in the setting of ischemia and unexplained syncope
-more accurate when combined with LVEF and HRV
-not accurate with a bundle branch block.
Heart Rage Variability (HRV)
measures variations in the HR as it is liable and varies over time
-detects life-threatening vent arrhythmias and their ectopic triggers
-useful to evaluate the effects of sympathetic-parasympathetic imbalances, the autonomic nervous generation of arrhythmias.
heart rate
is the result of the balence between the SNS and PNS
- a change can indicate stress, fever, or underlying problems( cardiomyopathies, SCD, monitoring after a MI)
Sympathetic nervous system (SNS) activation
Controlled by norepinephrine production. - increases the heart rate
sinus arrhythmia
normal finding in children and young adults due to respritory influence and is an indication of PNS effect (vagal tone)
parasympathetic nervous system (PNS) stimulation
Controlled by acetylcholine production—slows the heart rate
Heart rate variability analysis
reliable if 85% of the complexs have normal RR values
-iregular rhythms (afib) SVE and VE rhythms are excluded
2 methods of HRV analysis signal processing
time (non-spectral) and frequency (spectral) domain processing
HRV time domain analysis
non-spectral, estimates how much variability is present in the HR, determine the mean and SD of the RR interval , value are taken every 1 hr
-RR on the X axis
-# of beats falling within each interval on the Y axis
curves for time domain
-histograms are bell shaped- the narrower the curve the less HRV occured
-poincare graph- RR intervals are plotted against eachother, RR interval- X
Previous RR- Y
HRV frequency domain analysis
based of the fourier transformation analysis, calculates the R-r by spectral analysis
measurements taken are the power spectral, low freq, and high freq ranges of the HRV
what is reflected in the HRV power spectra?
variations of the automatic nervous activity
parasympathetic tone is are indicated by
high freq aspect
both para and symp nervous system are influenced by
low freq components
Sympathetic stimulation can increase HR from any value to over 100 bpm, accelerating to
200-300 bpm. Therefore, tachycardic heart rates are only influenced by the sympathetic effect.
increase in low-freq ratio
reflects dominance in the SNS
increase in high freq power
indicates PNS dominance
Many other factors can affect HRV, including
BB, age, stress, exercise, respiration, blood pressure regulation, and the circadian rhythm.
The most commonly used intermittent recorders are called
event recorders
record events which may occur over weeks to months
Loop recorders
monitor and record ECG continuously. Brief periods are stored when activated: either by the patient pushing an event marker button or arrhythmia detection algorithms within the recorder.
The most recent and effective weapon in the arsenal of arrhythmia detection is the
implanted loop recorder (ILR)
An implanted recorder is usually reserved for cases of arrhythmia which have a significant impact on the everyday life of the patient.
syncope
paroxysmal atrial fibrillation
supraventricular tachycardia
intermittent heart block
sick sinus syndrome
tachycardia
post MI arrhythmia such as ventricular tachycardia
eliminating arrhythmia as cause of recurrent symptoms
Implanted cardiac defibrillators have the capability of internally recording arrhythmia episodes. The limitation is that the device must be programmed to record specific findings:
heart rate range
intervals measured in msec
onset of arrhythmia
findings specific to either ventricle or atrium
rhythm irregularity
Acquisition Module
the device used to download the digital data card or tape into the ambulatory analysis system.
Automated ECG analysis systems were designed mainly to detect arrhythmias of
ventricular origin by defining the characteristics of QRS timing and QRS morphology, or slope
The method in which a manufacturer designs an analyzer can be categorized into two main approaches;
discriminators and categorizers.
Feature extraction
used for examination of ST segment change and pacemaker stimulus recognition. When the slope of Q onset or J point increases beyond threshold the algorithm begins.
Each Canadian province publishes guidelines for allowable conditions which will be reimbursed by public health care.
BC- symptoms of arrhythmia occurring 2 or more times in a 7 day period
syncope
BCMA protocol also includes patients whose cardiologist/specialist is evaluating:
pacemaker function
bradycardia
atrial fibrillation
frequent, reproducible cardiac arrhythmias in patients who are using anti-arrhythmic drugs and who need to undergo serial monitoring to assess response or adverse reactions
BC will only cover 24hour holtor monitoring.
One of the most commonly seen arrhythmias is the:
premature ventricular complex—PVC—also called VPB (ventricular premature beat) or VE (ventricular ectopic)
commonly seen in patients with coronary disease
The other most commonly seen rhythm disturbance is the:
SVE—supraventricular ectopic. These include isolated premature normal beats, atrial runs, and ectopic atrial beats.
increase with age, pregnancy, fever, dehydration, and underlying illness.
Symptoms AECG
Patients often describe skipped or missed beats, fluttering, pounding, jumping or vibrating sensations in their chest. Some may also describe these sensations radiating to the neck, head or stomach. Any of these sensations may be due to pauses in normal sinus rhythm, compensatory pauses caused by premature beats, or conduction disturbances such as AV block.
Palpitations AECG diary
The term "palpitations" is subjective, as the patient may actually be describing any number of conditions. The most common is actually a change in their rhythm, whether meaning an ectopic beat or slower/faster rate. Remember the subjective nature of descriptors, when evaluating diary entries and the associated rhythms found in the recording.
Dizziness and Light-headedness AECG diary
being light-headed are frequently seen diary entries. Evaluation by ambulatory monitoring is intended to prove or disprove that an arrhythmia is responsible.
Syncope (loss of consciousness) is always caused by cerebral ischemia. The causes of this ischemia are many. These include:
hypotension
low cardiac output seen in heart failure
orthostasis
sustained tachycardia
bradycardia
sinus pause or sinus arrest (as in sick sinus syndrome)
Paroxysmal tachycardias are caused by many conditions. These include:
autonomic imbalance (over active sympathetic tone, underactive parasympathetic)
mitral valve disease
postoperative valvular disease
pre-excitation conditions such as Wolff-Parkinson-White (WPW) syndrome
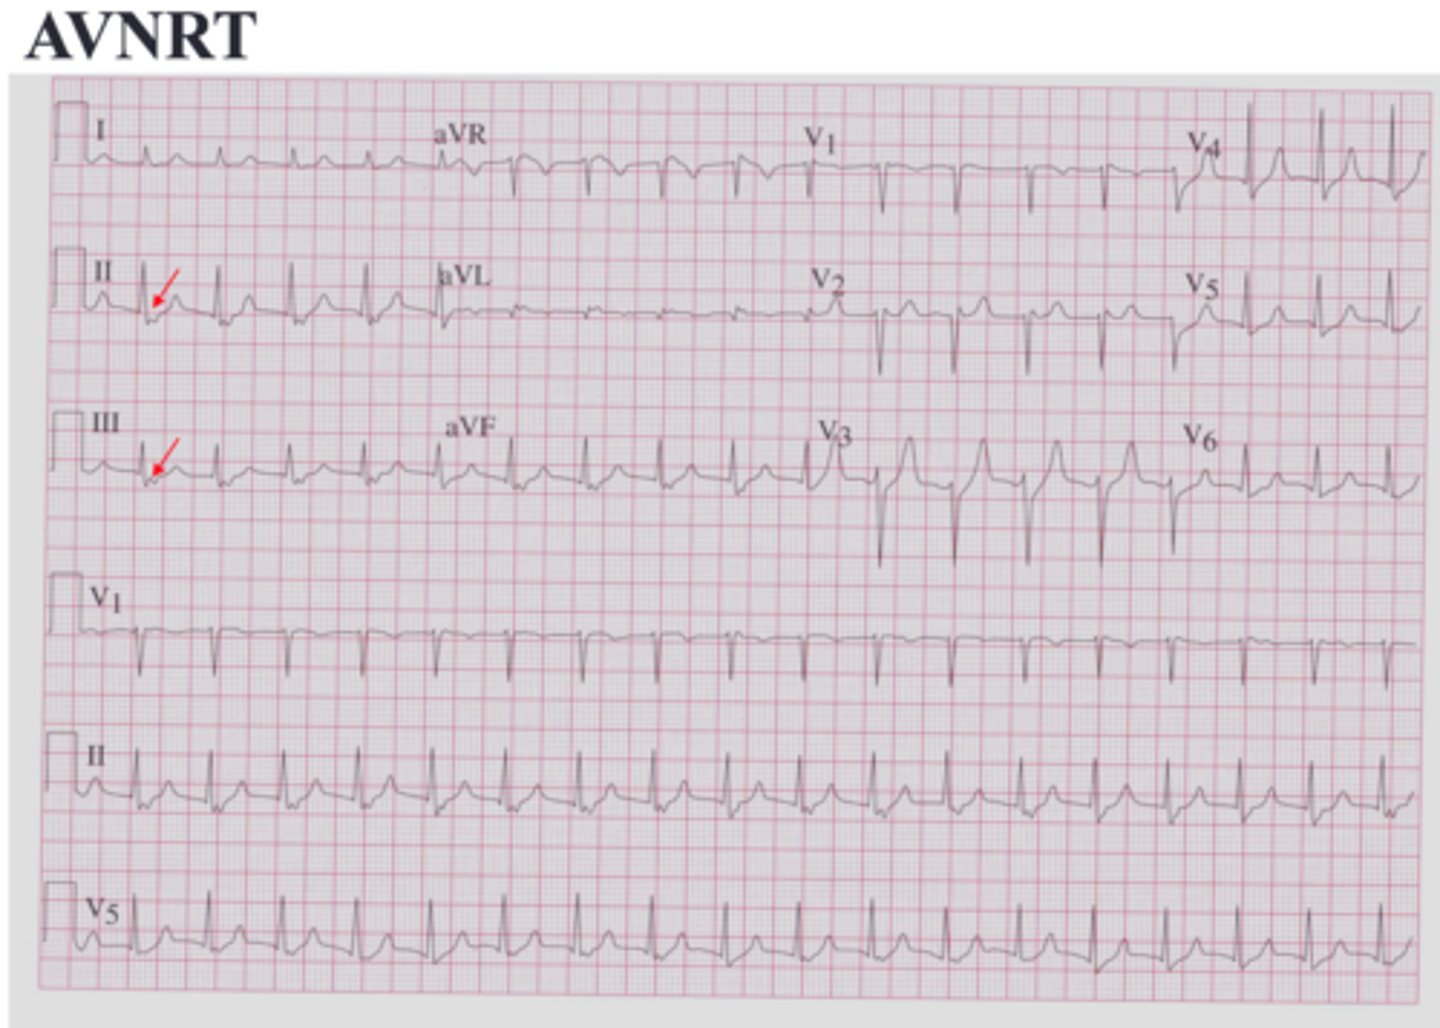
AV Node Re-entrant Tachycardia (AVNRT)
ectopic atrial rhythms
Lown-Ganong-Levine syndrome (short PR, normal QRS)
coronary artery disease
common findings uncovered when your patient notes "palpitations" on their diary.
PVCs
SVEs
Atrial Tachycardia
Atrial Fibrillation or Flutter
Ectopic Atrial Tachycardia
Ventricular Tachycardia
Pauses
Sinus Tachycardia
No changes
Blocked beats
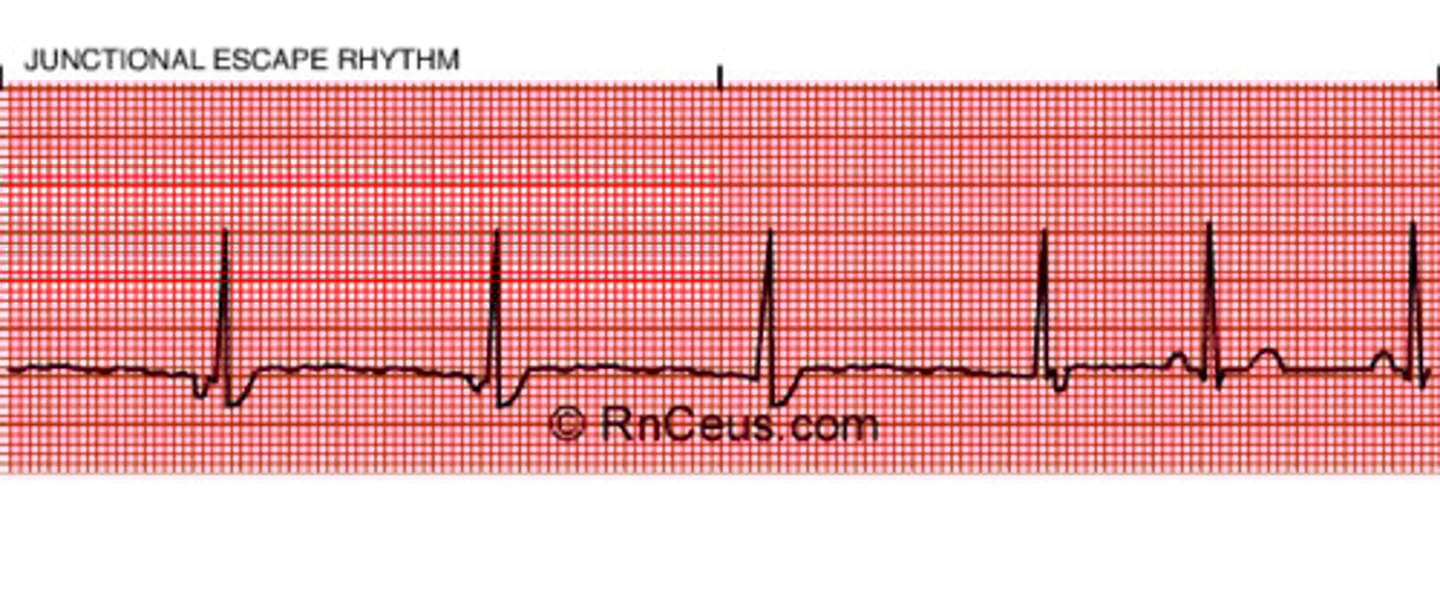
Junctional escape rhythm or beats
Sinus Bradycardia
Cardiac Ischemia AECG
AECG not the most effective for ischemia
Can be effective when monitoring
Prinzmetal's angina
nocturnal dyspnea
unpredictable chest pain
chest pain induced by stress/emotions
Ischemic changes may be confused with changes that occur with body position, medications, smoking or other activities.
A more common role of ambulatory monitoring in coronary ischemia is
evaluation of post MI arrhythmias. Ischemia may induce ventricular arrhythmias, or conduction defects such as heart block or bundle branch block.
High grade PVCs seem to be associated with:
position and magnitude of the infarct lesion
poor ventricular contraction (low ejection fraction and high end-diastolic volume)
degree of coronary obstruction and ST segment changes
Evaluation of Antiarrhythmic Treatment
The goal of treatment is to suppress dangerous or bothersome arrhythmias. When treatment does not eliminate arrhythmia, it is intended to suppress its occurrence or symptomatic effect.
Patients who are commonly treated with antiarrhythmics include those with the following:
complex PVCs
history of high grade ventricular arrhythmia and ischemia
PVCs causing syncope or presyncope, or angina
ventricular fibrillation or tachycardia
long QT and family history of sudden cardiac death
mitral valve prolapse with symptomatic ventricular tachycardia
sick sinus syndrome and bradyarrhythmias
WPW syndrome with PVCs
Cardiac Rehabilitation Monitoring
Untreated post MI patients with complex ventricular arrhythmia have a one year mortality rate of 10%. AECG may be used with the start of treatment, and is sometimes used to monitor a patient's progress through the rehab period.
Low cardiac output may be caused by several conditions:
cardiomyopathy
MI
arrhythmias
cardiogenic shock
Any tachycardia with insufficient diastolic venous-filling time will decrease stroke volume and possibly also cardiac output.
This condition may lead to fatigue, angina, light-headedness, dizziness, palpitations, or myocardial ischemia.
Pre-excitation Syndrome
Another condition that can cause unequal depolarization of the ventricle
This may be caused by accessory pathways, abnormal and faster than the normal pathway from the SA node to AV node
Three common conditions are:
WPW syndrome
Lown-Ganon-Levine syndrome
Mahaim syndrome
Prolonged QT AECG
caused by some medications and electrolyte imbalance, but several genetic abnormalities have been identified which create prolonged QT and put the patient at risk of life-threatening arrhythmias.
commonly treated with beta blocker therapy.
Mitral Valve Prolapse
often responsible for the presence of arrhythmias
Patients may report palpitations, chest pain, dyspnea, fatigue or presyncope. Conditions that may result are bacterial endocarditis or SCD. The arrhythmias may include PVCs, SVEs or atrial runs, bradycardia, or tachycardia. AECG monitoring may ensure appropriate treatment.
Cardiomyopathy AECG
Increased myocardial mass and volume may result from hypertrophic cardiomyopathy, or be caused by chronic hypertension. Some other types are congestive, infiltrative and idiopathic etc. The resulting damage may result in eventual congestive heart failure.
Be aware of heart rate variability
Simple and complex ventricular arrhythmias are most commonly seen in this condition. The standard treatment is beta blocker therapy,
chronic obstructive pulmonary disease (COPD)
The most common arrhythmias seen in those with COPD are atrial ectopics such as atrial fibrillation and multifocal atrial tachycardias. Ventricular ectopics may also occur, and they also commonly display changes of chronic pulmonary damage, such as P-pulmonale.
Diary AECG
Tracking their activities, symptoms or events during the time of the AECG monitoring
The most important aspect is the report of symptoms such as palpitations, dyspnea, dizziness, presyncope or syncope, nausea, or fatigue.
Some of the important items to include:
meals
taking stimulants such as coffee, smoking, or chocolate
taking medications
exercising or exertion such as walking, climbing stairs
change of body position: standing, sitting, prone
stress situations such as heightened emotion: anger, fear, frustration, excitement, anxiety, medical appointment, arguing, driving in traffic
fatigue, sexual activity, bowel movements, heavy lifting, urination, hyperventilation
symptoms of palpitations, pain, dyspnea, fast heartbeat, dizziness, thumping, pounding, heart slowing, lurching, jumping, quivering, bouncing, and other descriptors
This recorder records continuously but only stores select periods the patient activates. It will be over-written by newer recorded episodes when storage space is used up. What type of recorder is this?
Loop recorder
This recording lasts typically 24 hours and records the entire period. It is useful for documenting arrhythmias that occur two or more times weekly. What type of recorder is this?
holter monitor
Your patient may only experience symptoms rarely, but when they note a symptom they can transmit the event transtelephonically. What type of recorder is this?
event recorder
This monitor is used for a patient with difficult to detect arrhythmia symptoms. It can be used for two to three years, and will store a recording showing the period immediately prior to the arrhythmia so the onset may be noted. What type of recorder is this?
Implanted loop recorder
How does scanning equipment that uses analog data detect abnormal beats?
Numerical data on prematurity, amplitude, width and frequency of abnormal beats must be programmed into the analyzer. When the computer detects a beat that meets the predetermined criteria, it is counted as abnormal.
How does scanning equipment that uses solid-state devices detect abnormal beats?
The computer learns morphology, patterns and areas of normal beats and compares all subsequent beats to these criteria and identifies abnormal patterns.
A total of 120,000 heart beats were recorded in 24 hours. Calculate the average heart rate per minute.
83 bpm
The number of ventricular premature beats in 24 hours was 10,200 for a total of 123,250 beats per 24 hours. Calculate:
the average PVCs per hour
PVCs as percentage of normal beats
PVCs per 100 and PVCs per 1000 beats
24x60=1440123250beats/1440min = 85.6bpm (86)10200/123250 = 0.08276 (pvc to normal)0.08276x85.6bpm = 7.08426 (PVC's per min)a) 7.08426x60min = 425PVC per 1hrb) 10200/123250 = 0.08276 = 8.3% (pvc to normal)c) 100x0.083 = 8pvc per 100beats1000x0.083 = 83pvc per 1000beats
A 24 hour Holter monitor was used to evaluate pacemaker function. The recording showed that 95,000 of the total of 115,200 beats were paced. What percentage of the time did the pacemaker fire?
82% of the time the beat was paced
How is time domain HRV calculated?
This is a statistical method determining the mean and standard deviation of R-R intervals. The calculations are based on RRI variations to identify patients with decreased heart rate variability.
Name two clinical applications of recording heart rate variability.
a. Risk for development of sustained ventricular arrhythmias in patients recovering trom myocardial infarction with sinus rhythm and without bundle branch block or intraventricular conduction delay (QRS >120 ms).
b. Identification of patients with ischemic heart disease and unexplained syncope who are likely to have inducible sustained ventricular tachycardia.
Describe what is measured by time domain, or non-spectral analysis (TDA) of heart rate variability.
Time domain, also/or non-spectral analyses (TDA), estimates how much variability is present in the heart rate.
What is critical for ST segment analysis?
The critical finding is presence of a deviation of the ST segment from the baseline of at least 0.1 mV or more and a gentle upslope with a positive T wave.
Which type of ST segment deviation should not be used in analysis?
A flat ST segment with inverted T wave may still be used but downsloping or scooped T wave should not be used.
What is the criteria for measuring an R wave that is viewed on ambulatory monitoring?
An R wave must be at least 10 mm to be considered significant.
Coordination of contraction of the ventricles by the AV bundles and Purkinje system is of the utmost importance
Uncoordinated contraction will cause partial contraction while part of the ventricle is still relaxed. The relaxed portion will bulge outward and this will lower the ability of the ventricle to develop the normal rate of pressure rise and force of contraction.
"my heart beat disappeared" caused by PVC's (ventricular ectopic impulses)
The ventricles are not sufficiently filled and the coordination of contraction may be too poor to develop enough pressure or eject sufficient stroke volume. In such beats a QRS without any blood pressure pulse may be recorded.
When impulses are partially or totally blocked at the AV node, AV dissociation can develop:
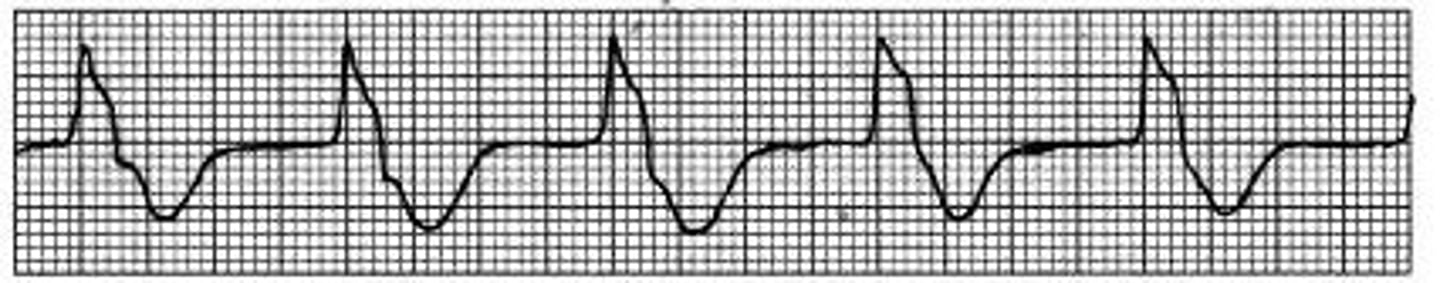
not all SA node impulses will reach the ventricles. Atria and ventricles may generate impulses independently from each other at different rates during total heart block. 70bpm p waves, 35bpm QRS.
Conduction defects should be evaluated according to standard ECG analysis
Recording speed (horizontal axis) is nominally at 25 mm/sec (some recorders have 50 mm/sec optional). This implies that 25 mm of recording represent 1.0 sec, or 1 mm = 0.04 sec, 5 mm = 0.20 sec.
To calculate the amplitude (intensity on vertical axis) of ECG waves the gain of the amplifier is calibrated so that 1 mV = 10 mm, or 0.1 mV = 1 mm
For determining abnormalities in heartbeats the essential first step is to
try to identify the P waves
Premature beats are
presented as atrial waves i.e., P (sinus node)
or QRS complexes (AV node or ventricular) that are recorded before the normal time.
Early beats with normal QRS
SVEs
Wide QRS, no P wave
Ventricular Ectopic
Irregular rhythm, fib waves
Atrial fibrillation
Inverted P waves, regular P-R
Ectopic atrial rhythm
Compensatory pause
PVC
Sinoatrial block (sinus exit block) an abnormally long PP interval or missed sinus beat
The important feature is that the long delay is not caused by an ectopic beat and compensatory period but the normal rhythm is maintained; there is just one beat in between two normal beats missing. This implies that the PP interval of the missed beat is exactly 2x the normal.
Sinus Pause
regular sinus rhythm with pauses of irregular lengths of time > 2x the normal - What started as a conduction defect, might lead to an impulse generation defect, resulting in bradycardia and eventually SA arrest.
Atrial fibrillation is
originate in atrial tissue. often generated in cells within the os (opening) of the pulmonary veins. The impulses are conducted erratically throughout the atrial tissue and through the AV node which slows and blocks conduction of some impulses.
greater risk of developing rate-related heart failure, or general decompensation
Atrial flutter is
originate in atrial tissue. conducted along a more defined pathway and through the AV node. The rapid atrial impulses may be conducted at varying rates, often creating patterns of 3:1 or 4:1 conduction. P-P 300-500bpm
Junctional rhythm has
rate: 40-60 typically
P waves: inverted, absent of retrograde
P-R: Normal, short, not applicable
QRS: Narrow usually,
Rhythm: regular
Idioventricular Rhythm has
Rate: slow 20-40
P waves: absent
P-R: N/A
QRS: wide > 0.12
Rhythm: regular
Normally the impulse is delayed at the AV node. When the normal duration of the delay is decreased it is called:
ventricular pre-excitation
Impulses are conducted from the atria to the ventricles at an accelerated rate along a pathway which may be confined within the AV node or may pass around the AV node.
Sympathetic over-stimulation and/or decreased parasympathetic tone may be the cause of a shift in
AV delay
AVNRT
atrioventricular nodal reentrant tachycardia
Caused by Slow / fast pathways, different refractory periods, making a loop.