2.7 Income distribution and welfare
 Call Kai
 Learn
Learn Practice Test
 Spaced Repetition
 Match
Match Flashcards
 Knowt Play
1/16

There's no tags or description
Looks like no tags are added yet.
Name | Mastery | Learn | Test | Matching | Spaced | Call with Kai | Chat |
|---|
No analytics yet
Send a link to your students to track their progress
17 Terms
Income
A flow of money going to factors of production e.g. Wages, pension, profits, dividends, rent, interest
Wealth
Wealth can be held in different ways such as savings, shares, property, corporate bonds, government bonds, pension schemes
Why government aims to have a more equitable distribution of income
Social housing is more difficult for low-income families to access
GDP per capita figures skewed (the average of extremely rich people and extremely poor people will not be representative)
Poverty trap (cycle of poverty, extremely difficult to get out)
Social tensions/political upheaval (people will turn against government if inequality becomes severe)
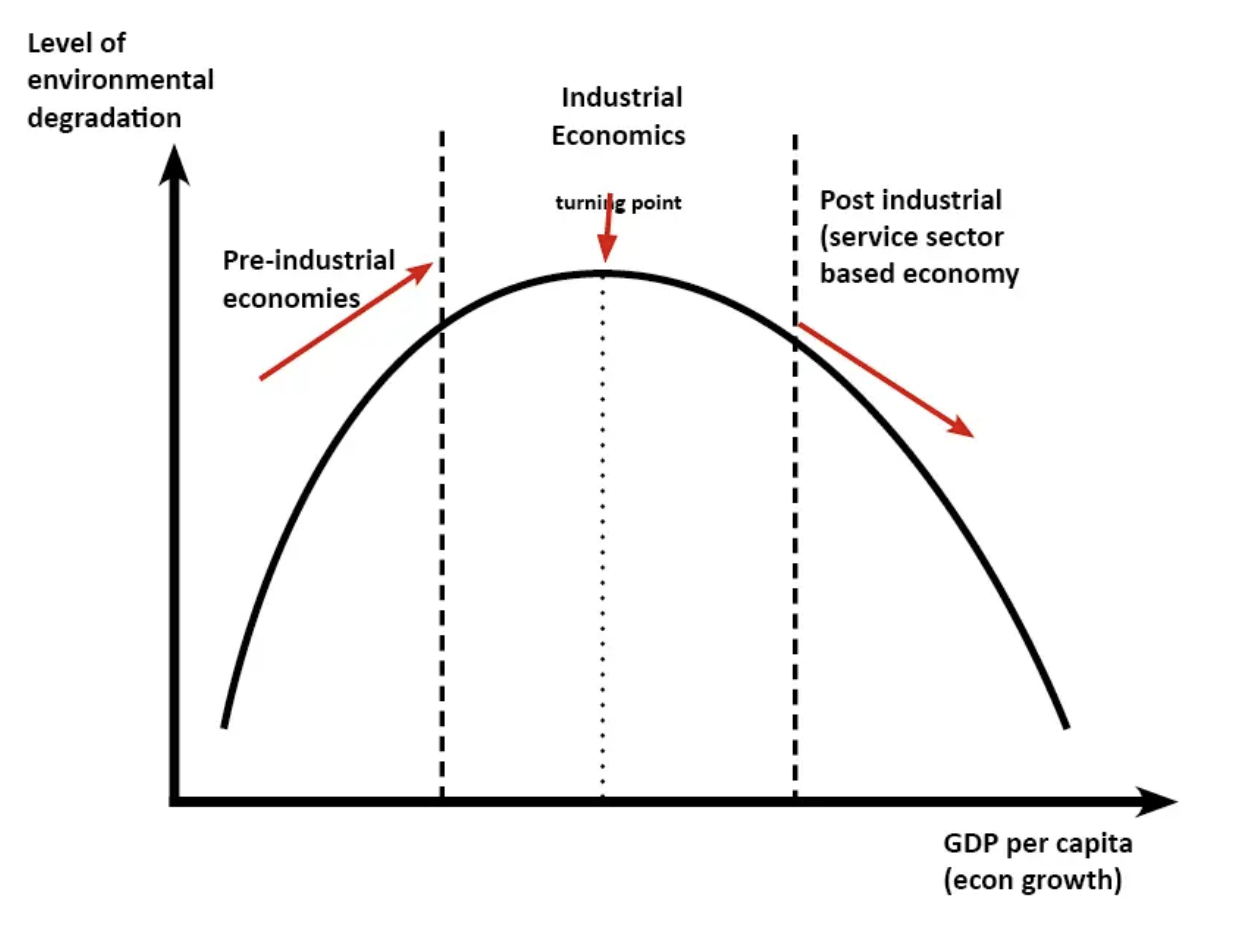
Explanation of Kuznet’s curve
Suggests that economic development initially leads to a deterioration in the environment, but after a certain level of economic growth, a society begins to improve its relationship with the environment and levels of degradation fall
Criticisms of Kuznet’s curve
It suggests that economic growth is good for the environment, but in fact the opposite is often the case
Industrial progress has a massive impact on the environment (factories burning fossil fuels, pollution etc.)
The turning point in Kuznet’s curve may never come, without government intervention
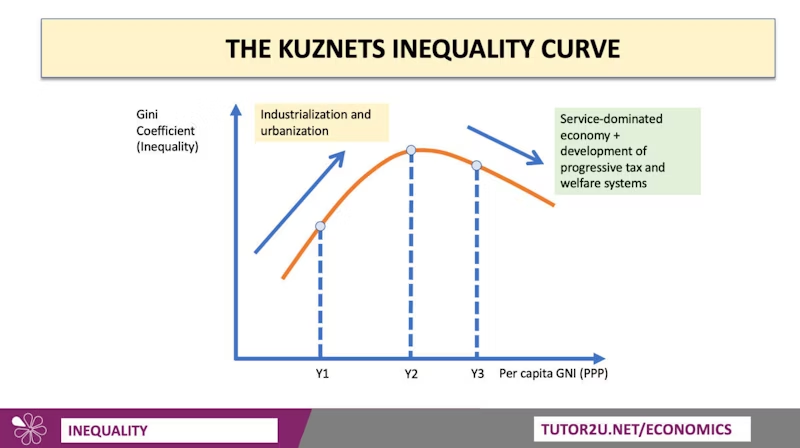
Kuznet’s inequality curve
Suggests inequality often rises during a phase of rapid industrialisation and urbanisation, but there may come a point where increased welfare provision, progressive taxes and more balanced income growth across industries may lead to a fall in overall inequality at higher per capita incomes
Causes of shape of Kuznet’s environmental curve
Spare income with growth: With more economic growth, people have more income after paying for necessities, so are more willing to pay higher prices for better environmental standards
Improved technology: Leads to higher productivity, which leads to more output with less raw materials used.
Deindustrialisation: The first shift from farming to manufacturing initially leads to greater environmental degradation. However, increased productivity and rising real incomes will see another shift from industrial to the services sector, which has a lower environmental impact than manufacturing
Absolute poverty
Condition where household income is insufficient to afford basic necessities of life (food, shelter, clothing)
This criteria does not change with economic growth
Relative poverty
When households receive 50% less income than average median incomes
This criteria will change with economic growth
Causes of poverty
Population growing faster than GDP in low income countries
Severe savings gap, families unable to save money
Absence of basic government/public services
Effects of endemic corruption in government and business
High levels of debt and high interest rates
Damaging effects of civil wars and natural disasters
Low employment rates, vulnerable jobs, poverty wages
Absence of basic property rights
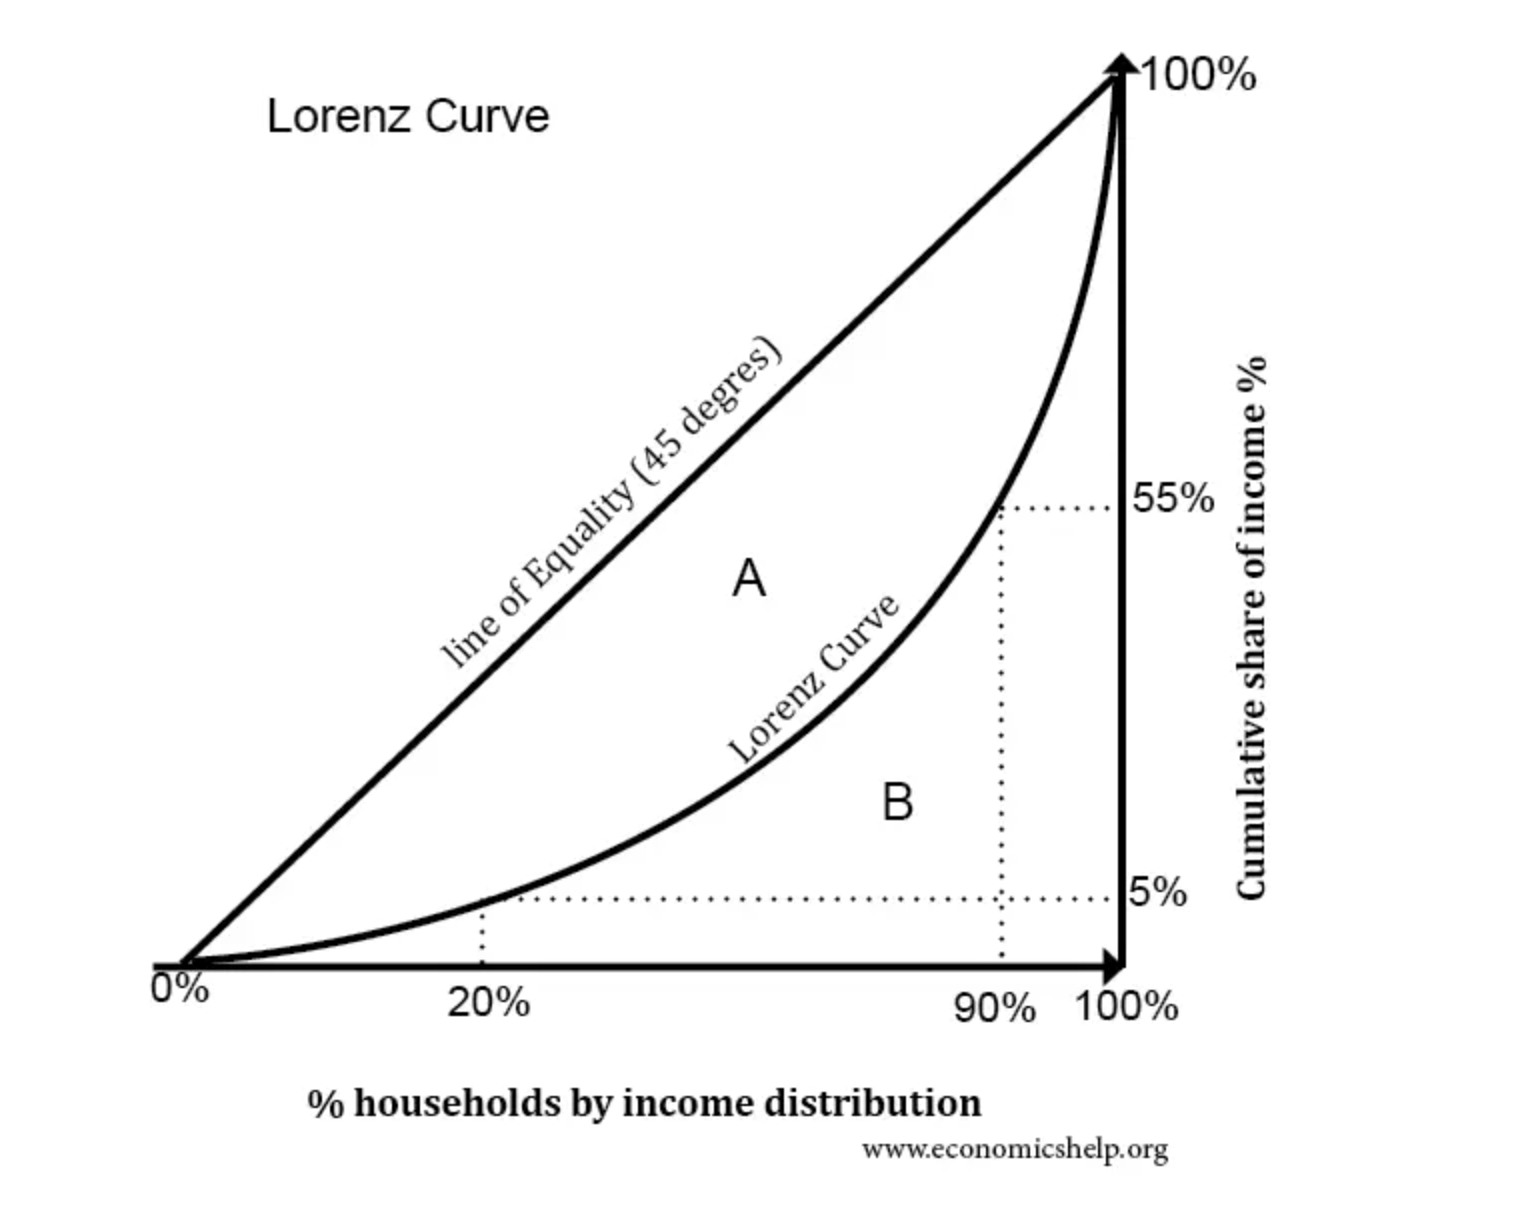
The Lorenz curve
Gives a visual interpretation of income or wealth inequality
The diagonal line shows a situation of perfect equality of income e.g. 50% of the population has 50% of income
The closer the curve is to the diagonal line, the more income equal it is
Gini coefficient formula
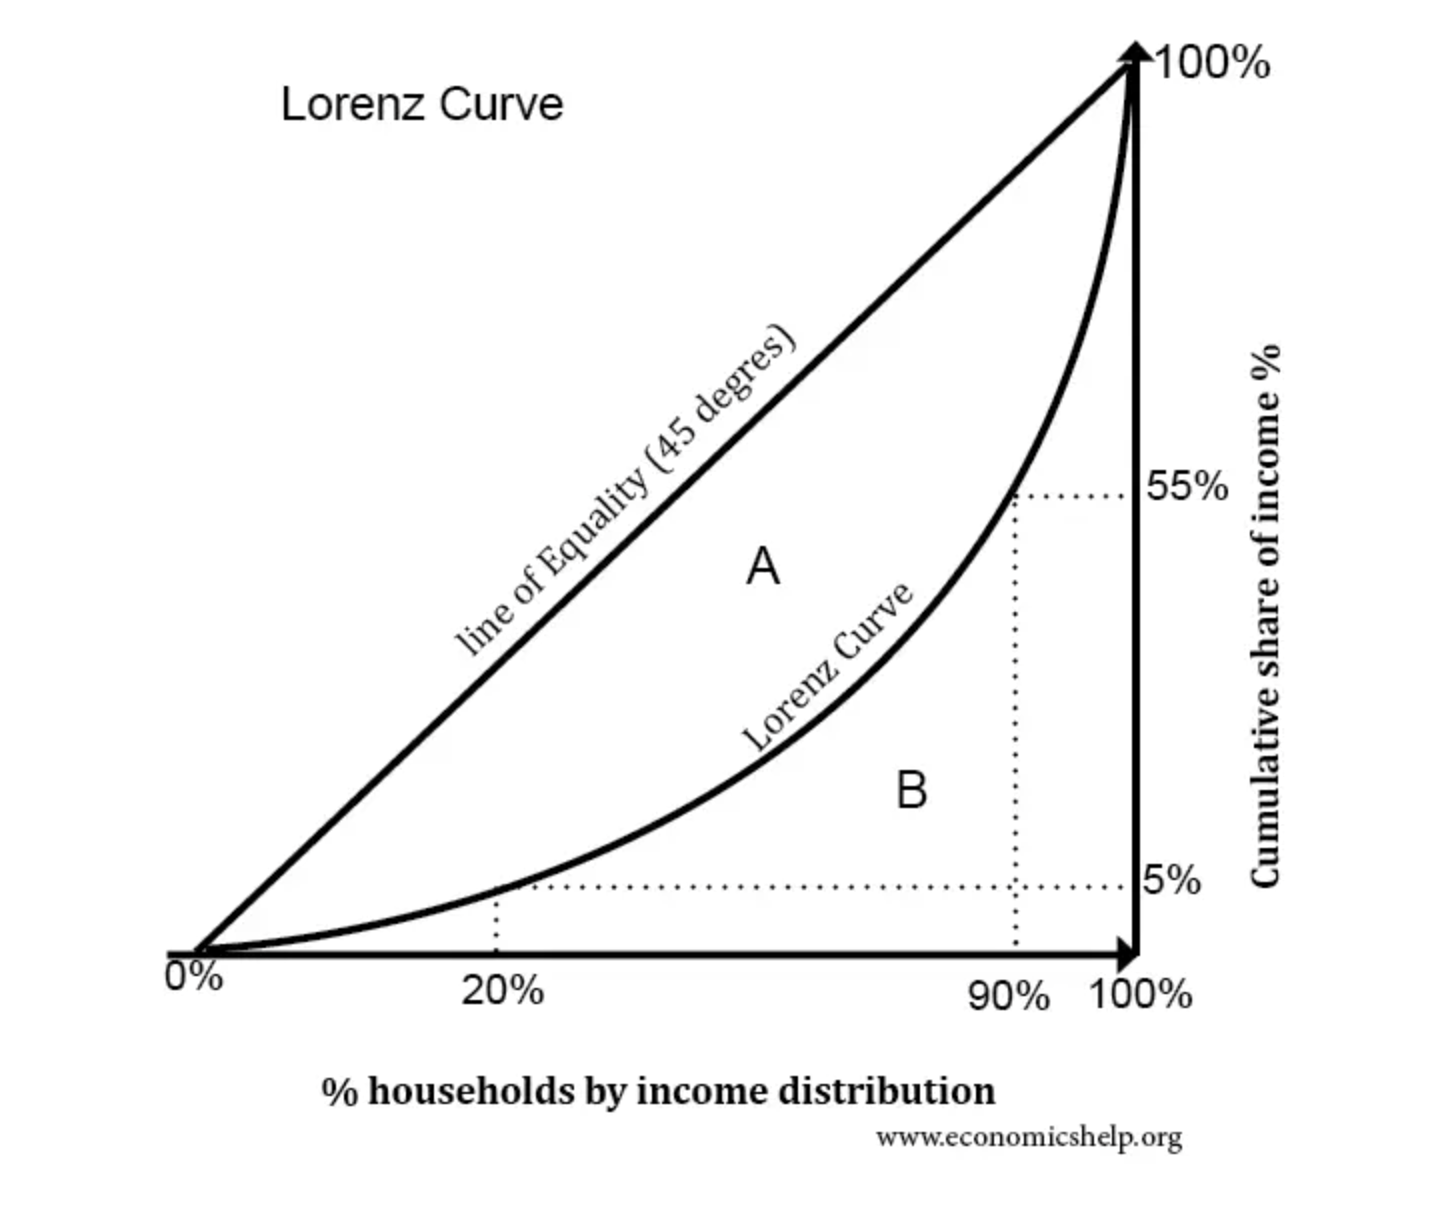
Area A divided by Area of A + B
Gini coefficient
Condenses the entire income distribution of a country into a single number between 0 and 1: the higher the number, the greater the degree of income inequality
0 means everyone has the same income, 1 means a single individual receives all the income
A Gini coefficient above 0.4 is linked with political instability and growing social tensions
Alternative measures of income inequality
Quintile ratio: Ratio of the average income of the richest 20% of the population to the average income of the poorest 20% of the population
Palma ratio: Ratio of the richest 10% of the population’s share of gross national income divided by the poorest 40%’s share
Consequences of extreme poverty for development
Low life expectancy and fewer years of healthy life expectancy
Low school enrolment rates as families cannot afford education (widens gender opportunity gap)
Low access to basic healthcare
Vulnerability to loan sharks (for families in major debt)
Limited access to technology
Threats to democracy and stable institutions
Low real spending power limits the size of domestic markets for consumer goods and services
How government spending can affect incomes
Welfare state transfers: Universal benefit, unemployment benefit, public pensions
State provided services: Education, healthcare, social housing, employment training
Role of taxation in promoting equity
Progressive taxes take a higher % of income from richer households
Tax free allowances can help lower income families to keep more earned income before they start to pay tax
Limits gap between original and final wealth
Most indirect taxes have a regressive impact on equity, though levying higher duties on luxury products could be effective