Untitled
1/51
There's no tags or description
Looks like no tags are added yet.
Name | Mastery | Learn | Test | Matching | Spaced |
|---|
No study sessions yet.
52 Terms
Statistics
Science of collecting, summarizing, and interpreting biological data.
Population
All individuals in a study.
Sample
A subset of the population used to estimate the population parameters.
Parameter
A value summarizing a population (e.g., true mean \( \mu \), true proportion \( p \)).
Estimate (Statistic)
A value summarizing a sample (e.g., sample mean \( \bar{x} \), sample proportion \( \hat{p} \)).
Sampling Error
Random deviation between a sample estimate and the true population parameter.
Bias
Systematic deviation from the true population parameter due to flawed sampling methods.
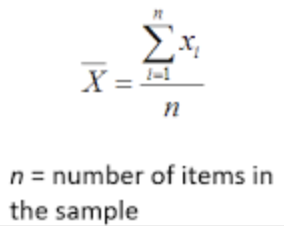
Sample Mean
sum of terms / number of terms
Precision
Related to the consistency of repeated estimates.
Accuracy
How close an estimate is to the true population parameter.
Categorical Data
Divides observations into groups.
Nominal Data
Categories with no natural order (e.g., species names).
Ordinal Data
Categories with a natural order (e.g., size:small, medium, large).
Numerical Data
Values that can be measured.
Continuous Data
Can take any value (e.g., weight).
Discrete Data
Takes specific integer values (e.g., number of eggs).
Frequency Table
A table that shows how often each category or value occurs.
Bar Graph
A graphical representation for categorical data.
Histogram
A graphical representation for numerical data; displays the distribution of values; continuous numerical data
Box Plot
Shows the spread of data, including median, quartiles, and outliers.
Skewness
Measures asymmetry in data.
Right-skewed
Tail on the right.
Left-skewed
Tail on the left.
Outliers
Data points that are far from the rest of the observations.
Mean \( \bar{x} \)
Average of data.
Median
Middle value when data are ordered.
Mode
Most frequent value in the dataset.
Variance \( s^2 \)
Average of the squared differences from the mean.
Standard Deviation \( s \)
Square root of variance.
Interquartile Range (IQR)
Difference between the third quartile \( Q_3 \) and the first quartile \( Q_1 \).
Coefficient of Variation (CV)
ratio of standard deviation to the mean
Sampling Distribution
The distribution of sample statistics across many samples.
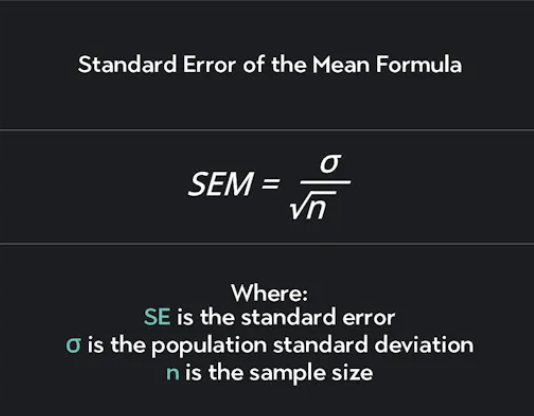
Standard Error (SE)
Reflects the variability of a sample estimate.
Standard Error of the Mean
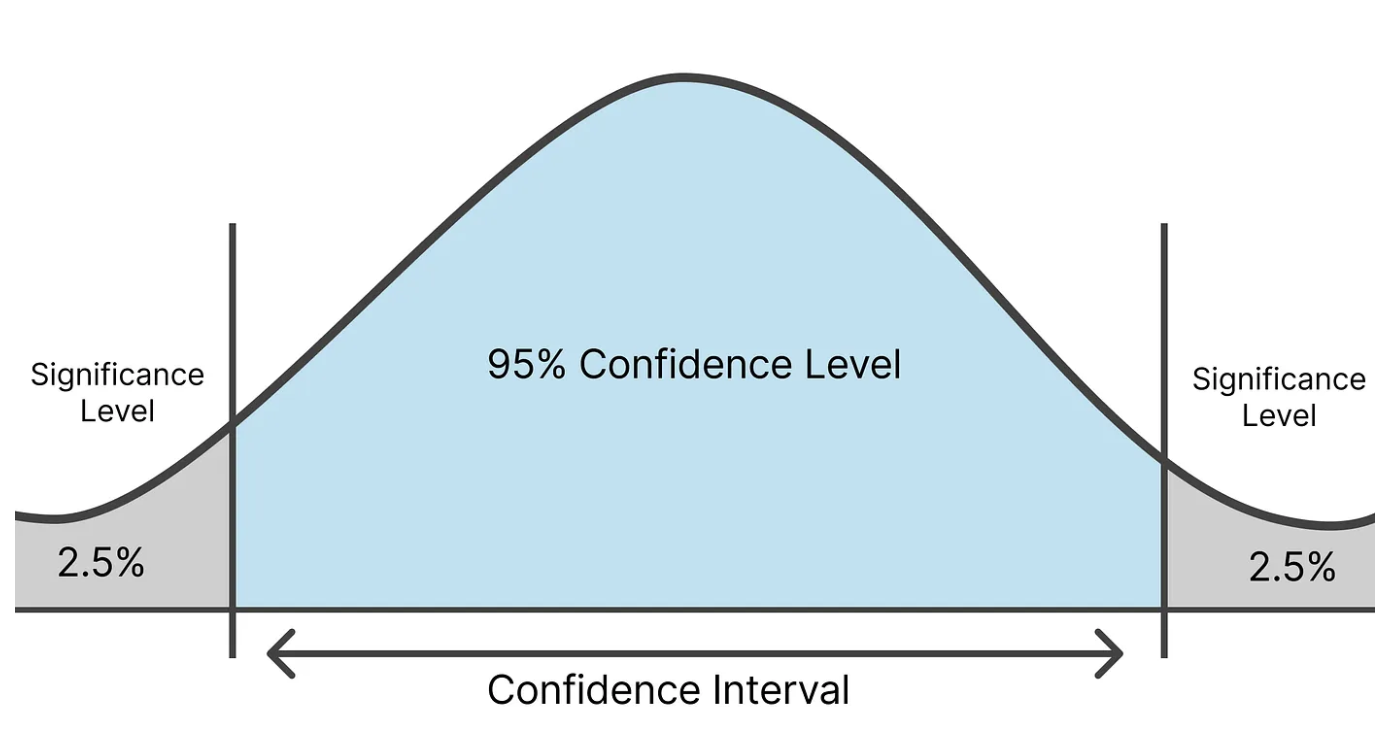
Confidence Intervals (CI)
A range that likely contains the population parameter.
95% Confidence Interval
range of values that describes the possible the mean of population based on a sample
Margin of Error
The range added to and subtracted from a point estimate to create a confidence interval.
Probability
The chance of an event occurring in the long run, expressed as a number between 0 and 1.
Discrete Probability Distribution
Describes probabilities for discrete random variables.
Continuous Probability Distribution
Describes probabilities for continuous variables.
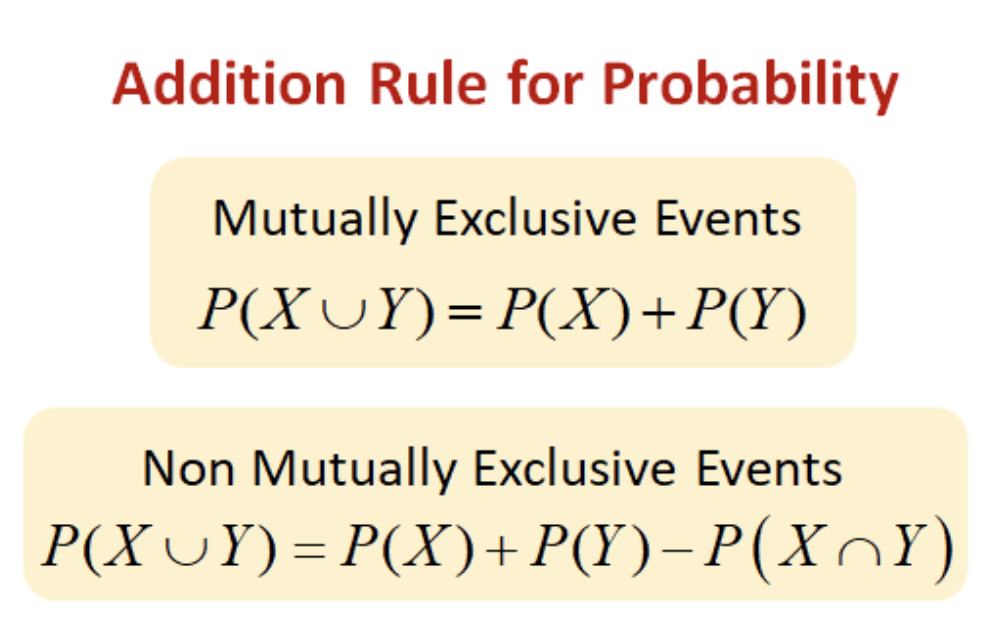
Addition Rule
general law of addition is used to find the probability of the union of two events
Independent Events
The outcome of one event does not influence the outcome of another.
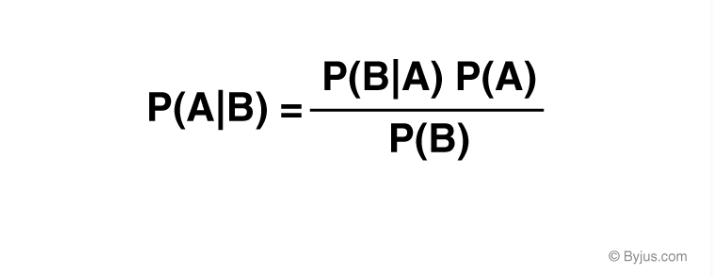
Conditional Probability (Bayes’ Theorem)
possibility of an event or outcome happening, based on existence of a previous event or outcome
Bar Graph
used for categorical data
Histogram
used for visualizing the distributions of continuous numerical data
Box Plot
summarizes the spread and central tendency of numerical data (includes outliers)
Scatter Plot
shows relationships between two continuous variables
Dot Plot
displays individual data points fro small datasets
Error Bars
used in bar graph and line graphs to show uncertainty (standard error, confidence intervals)
Probability Distribution (Discrete)
displays the probabilities of each outcome for a discrete variable
Normal Distribution Curve
bell-shaped curve representing a continuous normal distribution