Glucose/Diabetes
1/53
There's no tags or description
Looks like no tags are added yet.
Name | Mastery | Learn | Test | Matching | Spaced | Call with Kai |
|---|
No analytics yet
Send a link to your students to track their progress
54 Terms
What are Carbohydrates?
typically consist of a carbon backbone with hydroxyl groups attached and a carbonyl group (aldehyde or ketone)
classified into simple sugars (monosaccharides) and complex carbohydrates (polysaccharides)
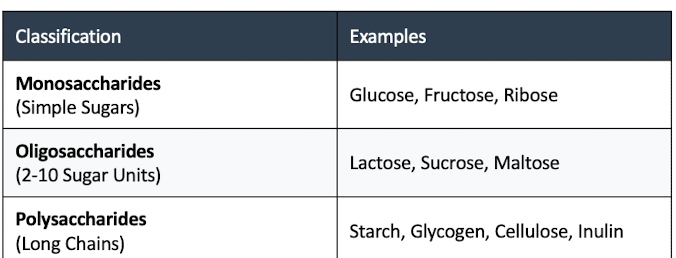
Monosaccharides Examples
Glucose, Fructose, Ribose
Oligosaccharides Examples (2-10 sugar units)
Lactose, Sucrose, Maltose
Polysaccharides (long chains)
Starch, Glycogen, Cellulose, Insulin
Key Classifications: Aldose vs Ketose
Aldoses: Carbohydrates with an aldehyde group at the chain end
Ketoses: Carbohydrates with a ketone group at an internal position
Types of Reducing Sugars:
play a crucial role in biochemical processes such as glucose and urine dipstick testing.
Glucose - monosaccharides
Galactose - monosaccharides
Fructose - monosaccharides
Lactose - oligosaccharides
Maltose - oligosaccharides
Reducing Sugar Definition
sugars that possess a free aldehyde or ketone group, allowing them to act as reducing agents by donating electrons to compounds like copper (II) ions in Benedict's solution.
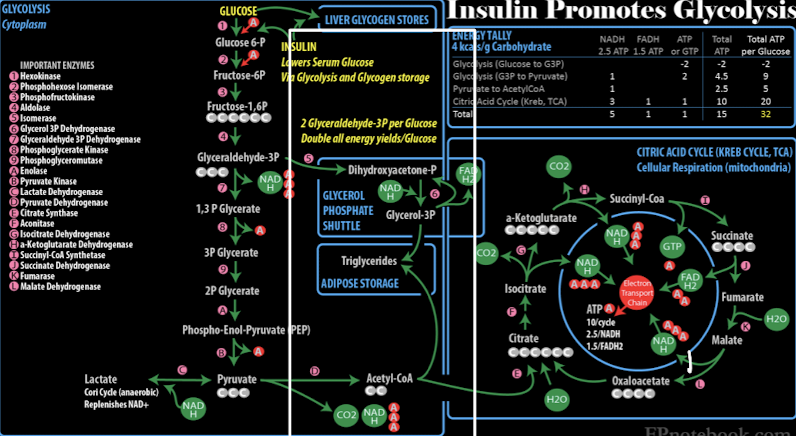
Acetyl CoA importance
connects glycolysis to the citric acid cycle, enabling glucose conversion to ATP in aerobic
modulates insulin signaling and enzymes involved in glucose metabolism and lipid synthesis → insulin promotes glycolysis
Glucose Metabolism
is tightly regulated by multiple hormones:
Insulin: Decreases blood glucose
Glucagon: Increases blood glucose
Epinephrine: Increases blood glucose
Cortisol: Increases blood glucose
Metabolic Pathways
The body processes carbohydrates through several interconnected pathways:
Glycolysis
Hexose monophosphate pathway
glycogenesis, glycogenolysis, gluconeogenesis
Glycolysis (Embden-Meyerhof pathway)
Converts glucose to pyruvate or lactate in the presence or absence of oxygen, producing ATP in the process.
Hexose monophosphate pathway:
Alternative glucose processing that generates NADPH and ribose-5-phosphate for anabolic reactions.
Glycogenesis
Storage of excess glucose as glycogen in liver and muscle cells. This process is stimulated by insulin and occurs when blood glucose levels are high.
Glycogenolysis:
Breakdown of glycogen to glucose for use as energy when blood glucose levels are low.
Gluconeogenesis:
Formation of glucose from non-carbohydrate sources such as amino acids, lactate, or glycerol portion of lipids by breakdown of glycogen
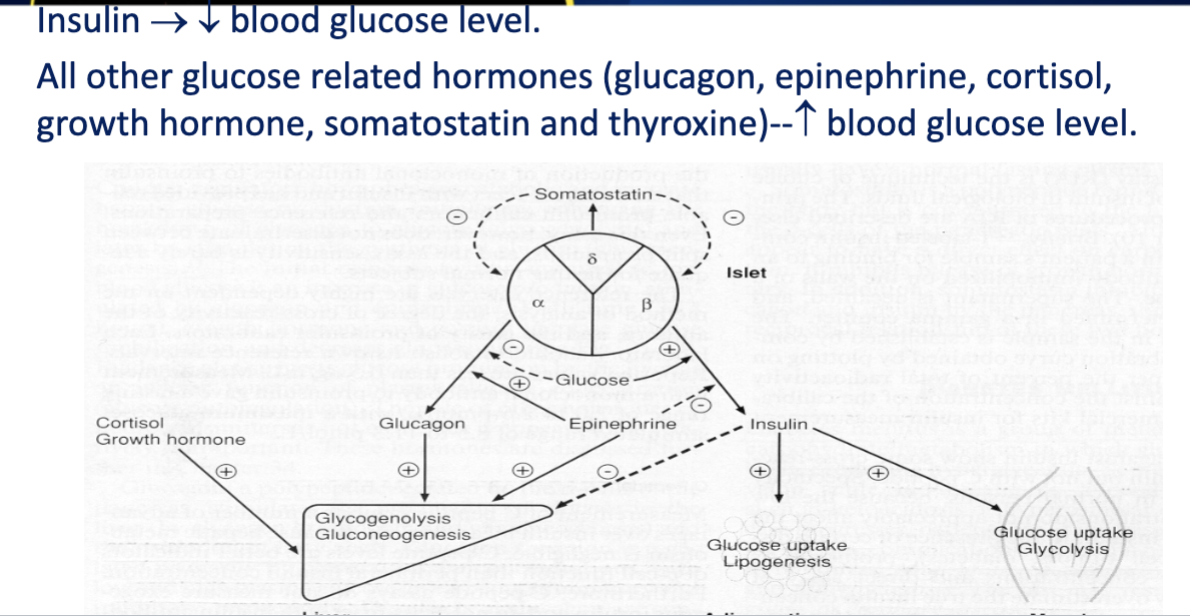
Hormonal Regulation
Multiple hormones work together to maintain glucose homeostasis:
Insulin LOWERS blood glucose
glucagon, epinephrine, cortisol, and growth hormone RAISE it.
Growth hormone antagonizes insulin's effects and promotes gluconeogenesis and the breakdown of fat stores
increases blood glucose levels.
Insulin
Decreases blood glucose through increased cellular uptake
Positive regulation occurs during high blood glucose levels, leading to increased insulin release,
negative regulation occurs during low blood glucose levels, stimulating glucagon release to raise glucose levels.
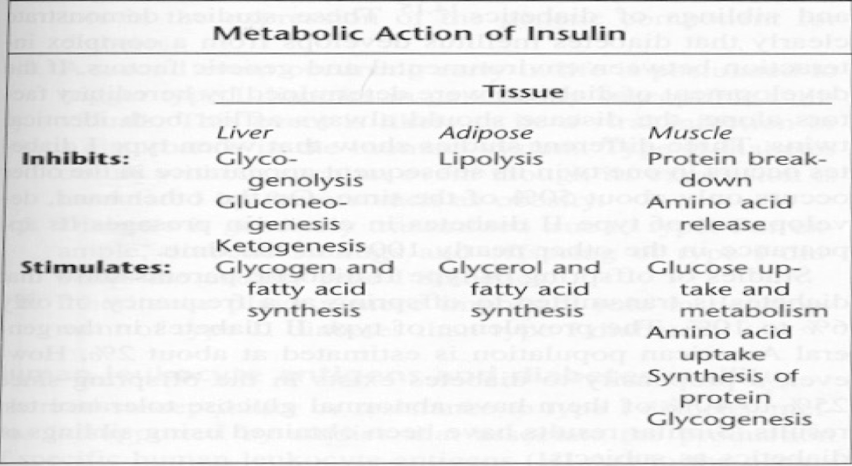
Metabolic Action of Insulin
increases the membrane permeability to glucose by binding receptors on cell surfaces, thus enhancing the entry of glucose into liver, muscle, and adipose tissue.
Glucagon
a hormone produced by the alpha cells of the pancreas.
primary role is to increase blood glucose levels when they are low, primarily through the process of glycogenolysis.
The release of glucagon is stimulated by low blood glucose levels (hypoglycemia)
Epinephrine
a hormone secreted by the adrenal glands during stress responses.
'fight or flight' response by rapidly increasing blood glucose levels to provide energy to muscles.
enhances glycogenolysis and stimulates gluconeogenesis
Cortisol
Increases blood glucose through gluconeogenesis, promotes the breakdown of fats, enhancing the availability of energy sources during stress.
Growth Hormone (ACTH)
Antagonizes insulin effects by promoting lipolysis and gluconeogenesis which increases blood glucose levels
Type 1 Diabetes
Autoimmune destruction of β cells
Absolute insulin deficiency
Risk of ketoacidosis
Type 2 Diabetes
Insulin resistance
Progressive β cell dysfunction
Risk of hyperosmolar coma
Type 1 vs Type 2 Diabetes
Type 1 diabetes is characterized by autoimmune destruction of insulin-producing β cells, leading to absolute insulin deficiency,(Inherent hyperglycemia)
while Type 2 diabetes involves insulin resistance and progressive dysfunction of β cells. (Acquired autoimmune disease)
Hypoglycemia vs Hyperglycemia
Hypoglycemia refers to abnormally low blood glucose levels, while hyperglycemia indicates elevated blood glucose levels, often seen in diabetes.
Hypoglycemia can cause symptoms like shakiness and confusion, while hyperglycemia may lead to excessive thirst and frequent urination.
Hypoglycemia
Definition: Plasma glucose <70 mg/dL; symptoms typically appear <50 mg/dL.
Symptoms: Confusion, chills, rapid heartbeat, weakness, trembling, sweating, nausea, lightheadedness, hunger, epigastric pain, shakiness (due to epinephrine).
Infants: Better tolerate short-term hypoglycemia due to increased ketone production; symptomatic at <40 mg/dL (lower for preemies).
Hypoglycemia pt. 2
Causes: Excess insulin response (insulinomas, glycogen depletion, intense exercise, fasting, liver disease).
Complications: Severe cases can lead to coma and death.
Diagnosis: CPG, insulin, C-peptide, insulin tolerance test.
Critical Value: Panic level <50 mg/dL (lab-dependent).
Hyperglycemia
elevated plasma glucose levels due to hormonal imbalance; insulin is typically secreted in this condition, while Diabetes Mellitus may arise from defects in insulin secretion or action.
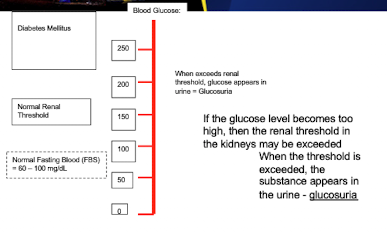
Renal Threshold and Glucose
If the glucose level becomes too high, then the renal threshold in the kidneys may be exceeded. → glucose appears in the urine - glucosuria
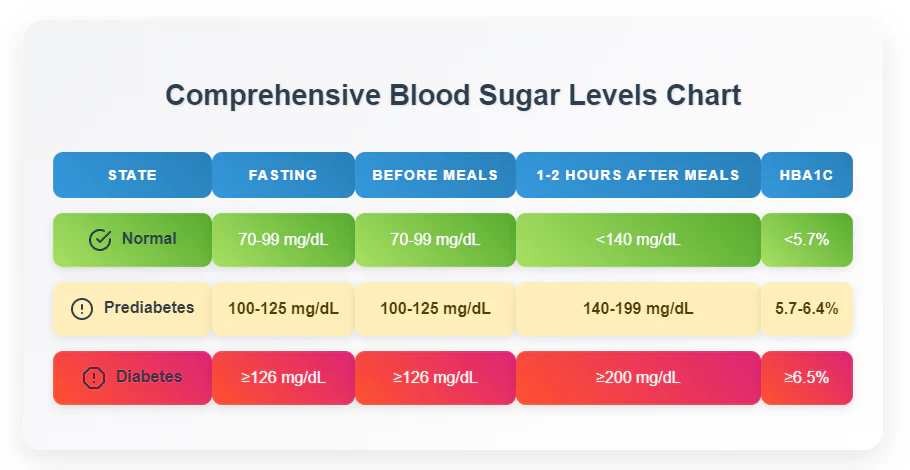
Blood Glucose Chart
hypoglycemic (low blood sugar), and hyperglycemic (high blood sugar) states

Type 1 vs Type 2 Diabetes Mellitus Complications
Diabetic Ketoacidosis (DKA) = insulin deficiency, high FPG
vs
Hyperosmoler Coma = severe dehydration and high FPG.
Both are complications associated with uncontrolled diabetes.
Type 1 vs Type 2 DM - Insulin
Type 1 diabetes leads to lack of insulin production while Type 2 diabetes has insulin present but insulin resistance occurs leading to relative insulin deficiency.
Type 1 DM - Etiology
characterized by autoimmune destruction of pancreatic beta cells, leading to a lack of insulin production.
affecting glucose metabolism in muscle (stimulating glycogenesis),
adipose tissue (increasing glucose uptake and lipogenesis)
liver (inhibiting gluconeogenesis and glycogenolysis).
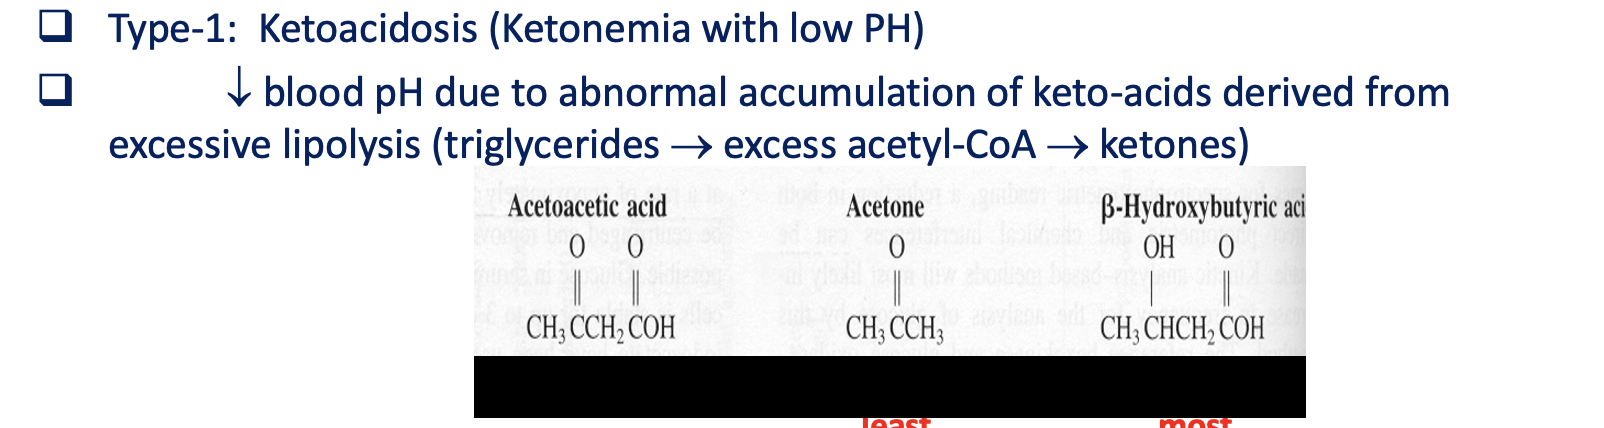
Type-1: Ketoacidosis
Ketonemia with low PH
decreased blood pH due to abnormal accumulation of keto acids derived from excessive lipolysis (triglycerides→excess acetyl-CoA → ketones)
Type 2 DM - Etiology
Characterized by insulin resistance and inadequate insulin production. Contributing factors include abdominal obesity, sedentary lifestyle, family history, previous gestational diabetes, and high blood pressure. Effects include hyperglycemia, abnormal triglycerides, and low HDL cholesterol, increasing cardiovascular disease risk.
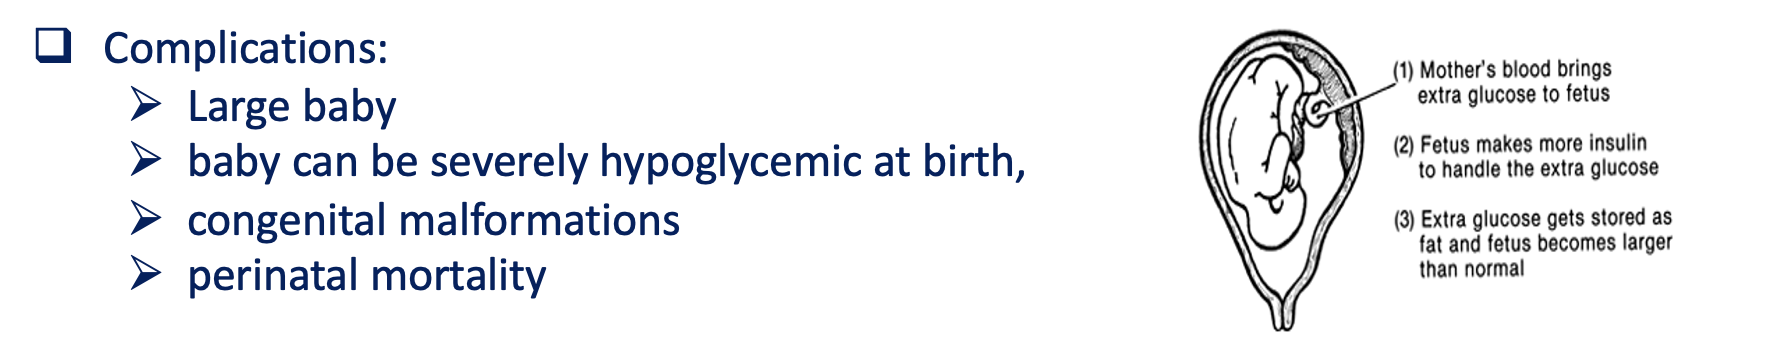
Gestational DM
A form of diabetes that develops during pregnancy, characterized by insulin resistance and high blood sugar levels. It typically resolves after childbirth but may increase the risk of developing Type 2 diabetes later in life.
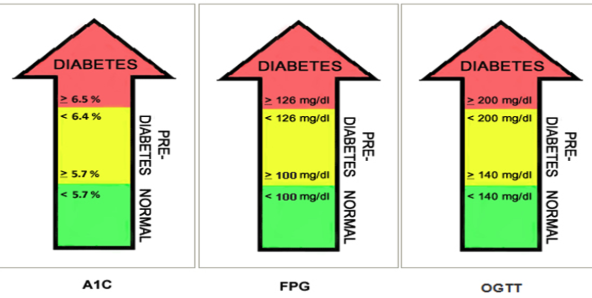
Diagnosis criteria of diabetes
Fasting Plasma Glucose ≥ 126 mg/dL
2-hour Plasma Glucose ≥ 200 mg/dL during OGTT
HbA1c ≥ 6.5%
Random Plasma Glucose ≥ 200 mg/dL with symptoms
Gestational Diabetes Mellitus (GDM)
Gestational diabetes develops during pregnancy and requires careful monitoring:
Typically appears between 24-28 weeks gestation
Associated with increased insulin resistance
Usually resolves after delivery
Increases risk for type 2 diabetes later in life
GDM diagnostic method
Screening occurs at 24-28 weeks of gestation with a fasting sample and a 75g glucose load.
Glucosuria
when blood glucose exceeds the renal threshold (180-200 mg/dL).
Diagnostic Criteria for GDM
Using 75g oral glucose tolerance test:
Fasting: ≥ 92 mg/dL
1 hour: ≥ 180 mg/dL
2 hour: ≥ 153 mg/dL
Diagnosis criteria of diabetes
Casual Plasma Glucose (CPG) ≥ 200 mg/dL with symptoms, presumptive test
Fasting Plasma Glucose (FPG) ≥ 126 mg/dL (no food for 8 hours for 2 consecutive occasions = confirmation
Two-hour post-load plasma glucose ≥ 200 mg/dL during OGTT (Impaired Glucose Tolerance is not diagnostic)
Hemoglobin A1c ≥ 6.5% Note: Confirmation with repeat testing is required.
Analytical Methods used to measure glucose levels in blood samples, priciples and key considerations
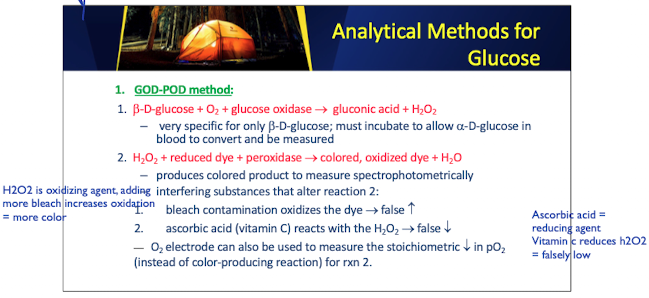
GOD-POD: Enzymatic oxidation of glucose
Specific for glucose
Hexokinase: Reference method
High specificity
HbA1c: Glycated hemoglobin measurement
Long-term glucose control
GOD POD method: Important Enzymes and Substrates
Beta-D glucose + O2 + glucose oxidase → gluconic acid + H2O2
H2O2 + reduced dye + peroxidase → color, oxidized dye + H2O2

GOD POD: beta-D-glucose
is a substrate used in the GOD-POD method for glucose measurement
–very specific for only b-D-glucose; must incubate to allow a-D-glucose in blood to convert and be measured
GOD POD: beta-D-glucose
produces colored product to measure spectrophotometrically
interfering substances that alter reaction 2:
bleach contamination oxidizes the dye → false increases
ascorbic acid (vitamin C) reacts with the H2O2 → false increases
Glucose Hexokinase Method: Important Enzymes and Substrates
1.D-glucose + ATP(Mg++) + hexokinase → glucose-6- phosphate + ADP
EDTA anticoagulant binds Mg++ = increased false negatives
2.glucose-6-P + NAD+ (or NADP+) + G6PD → 6-phosphogluconic acid + NADH (or NADPH) + H+
Glycated Hemoglobin (HbA1c)
Reflects average glucose over 2-3 months
Target < 7.0% for most adults
Measured by:
Ion-exchange chromatography
Affinity chromatography
Immunoassay methods
Push & Pull - "Sticky” on Glycosylated proteins
Ion-exchange chromatography Principle: When glucose attaches to the end of the b chains of hemoglobin, it ties up one of the possible sites of ionization (i.e. the amino group). changes the charge on the molecule.
Other Monitoring Parameters
Fructosamine (2-3 week glucose average)
Microalbuminuria (early kidney damage)
Lipid profile
Serum and urine ketones
Effect of hemolysis, lipemia, and icterus
Carbohydrate Metabolic Disorders Galactosemia
Glycogen storage diseases
Fructosuria
Their diagnostic criteria and testing methods
Ketoacidosis Characteristics
Laboratory tests for DM includes presence of ketones
characterized by high blood acidity (low pH) and the presence of ketones in the blood and urine.
presence indicates that the body is breaking down fat for energy instead of glucose.
Lactate: The relationship between glucose metabolisms
Type A vs Type B lactic acidosis
Measurement methods
Clinical significance
Reference ranges
Sample requirements