3.5-3.6 Population Growth & Age Structure Quiz Study Guide
1/15
There's no tags or description
Looks like no tags are added yet.
Name | Mastery | Learn | Test | Matching | Spaced |
|---|
No study sessions yet.
16 Terms
A
Which line represents the biotic potential of the species in a graph?

B
Which line represents the overshoot of the species in a graph?

E
Which line represents the carrying capacity of the species in a graph?
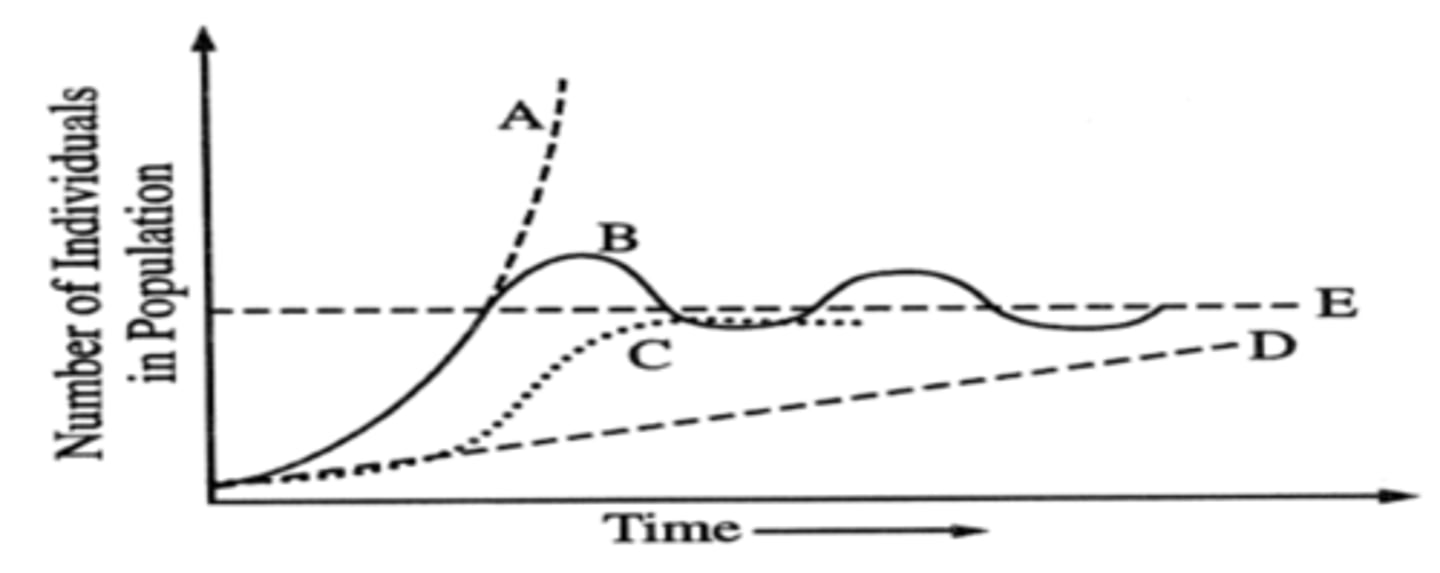
C
Which line represents the growth of a population predicted by the logistic model.

Carrying capacity
In a graph, this represents the maximum number of individuals that can be supported by a particular ecosystem on a long term basis.
J shape
Population growing exponentially is represented by what in a graph?
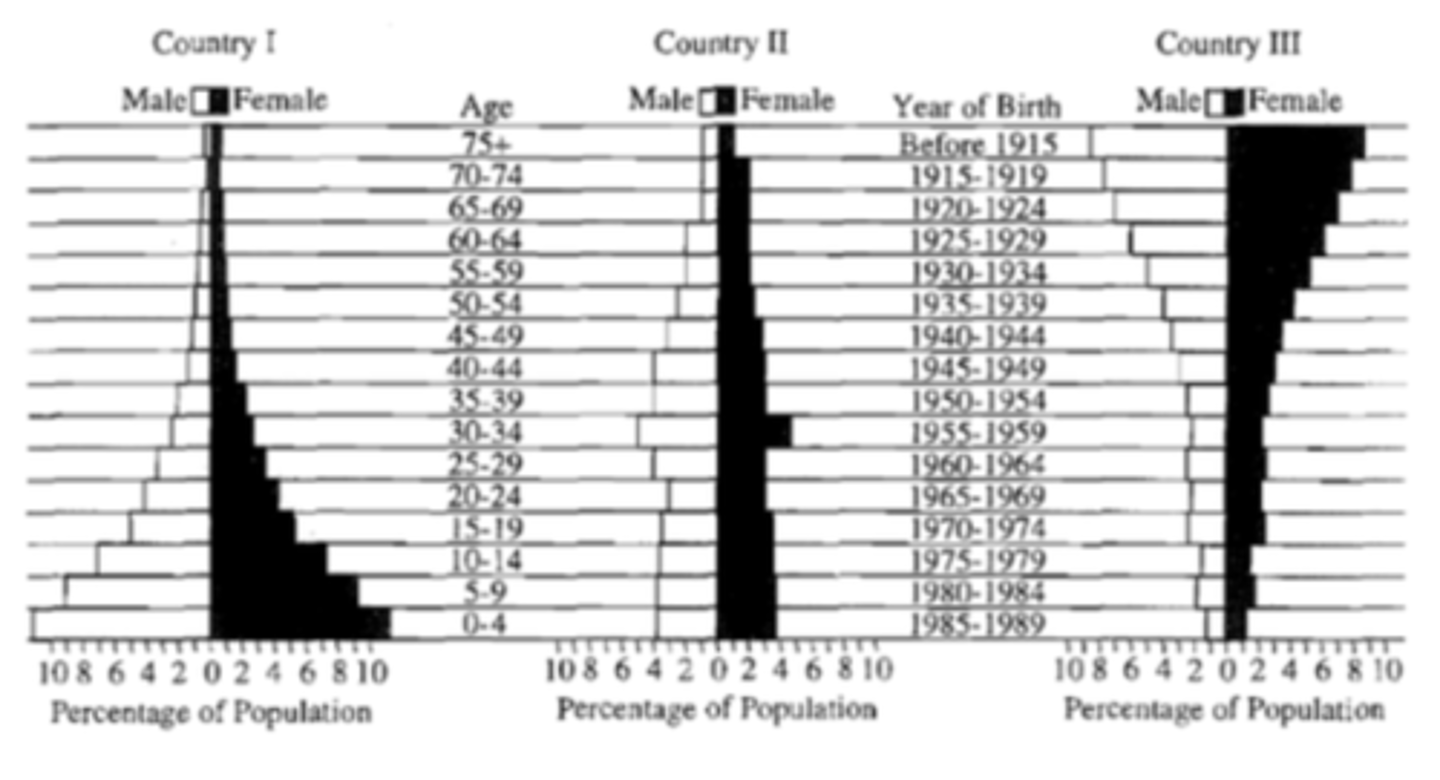
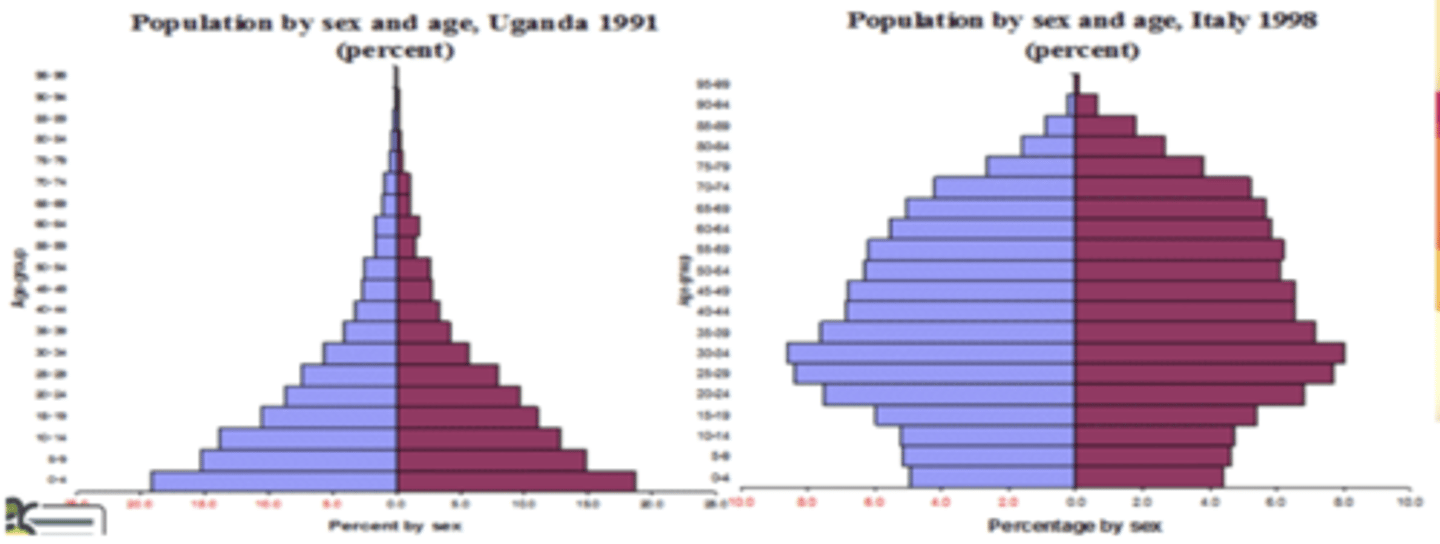
Country 1 (wide base)
Countries undergoing rapid population growth include which age structure diagram?
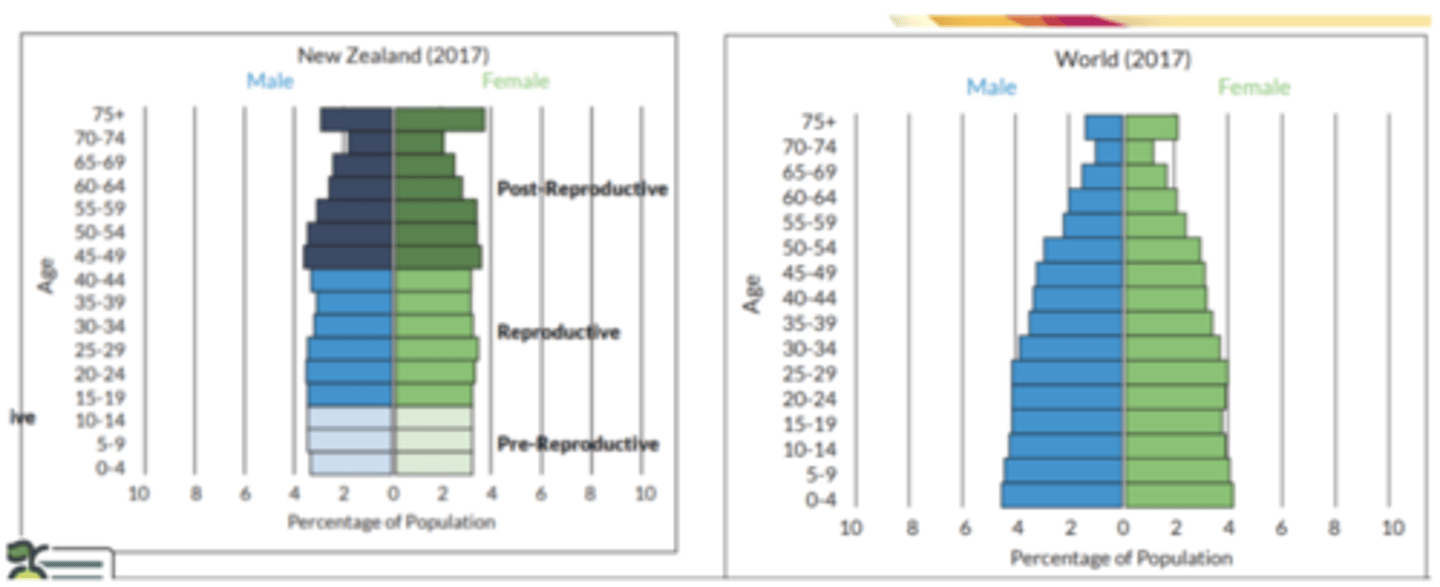
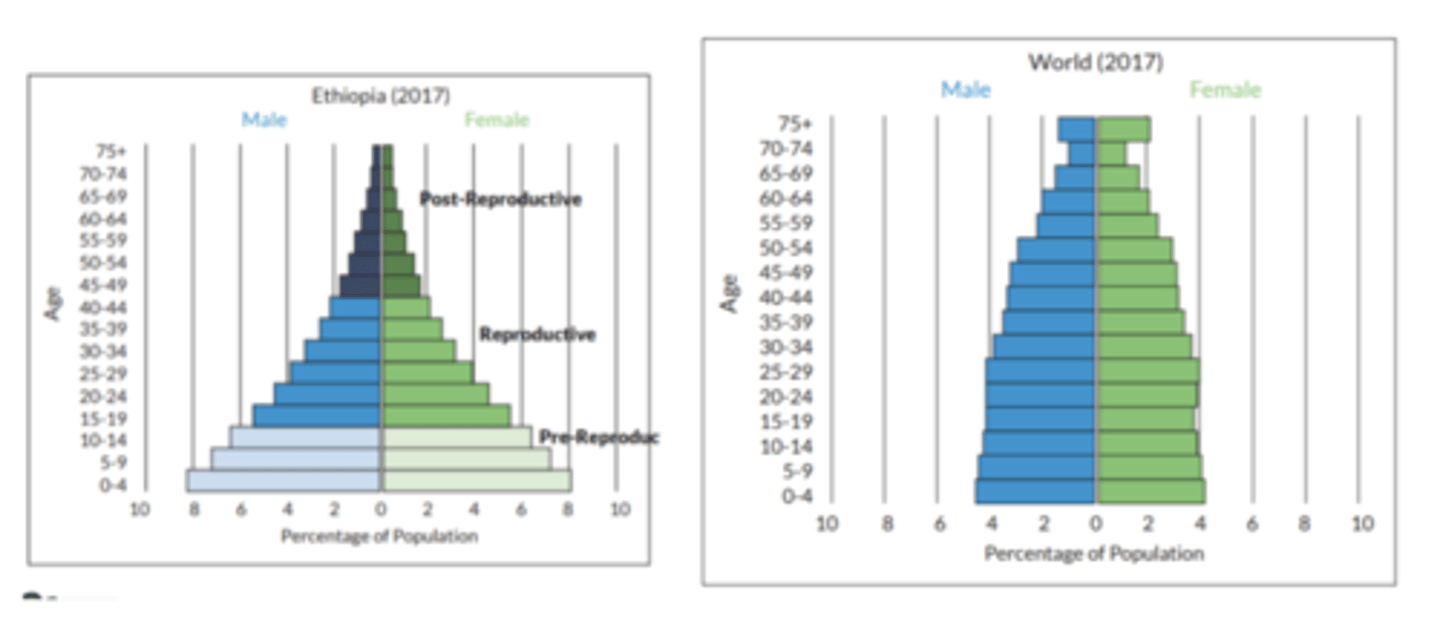
Pre-reproductive: younger than 18 years old
In a human population, the population momentum effect is most likely to occur in cases in which a large percent of people in the population are in what age-group?
The relative population growth rate of the population
What can be interpreted from an age-structure diagram of a country?
Continued growth of a population after fertility drops to replacement level
What best exemplifies population momentum?
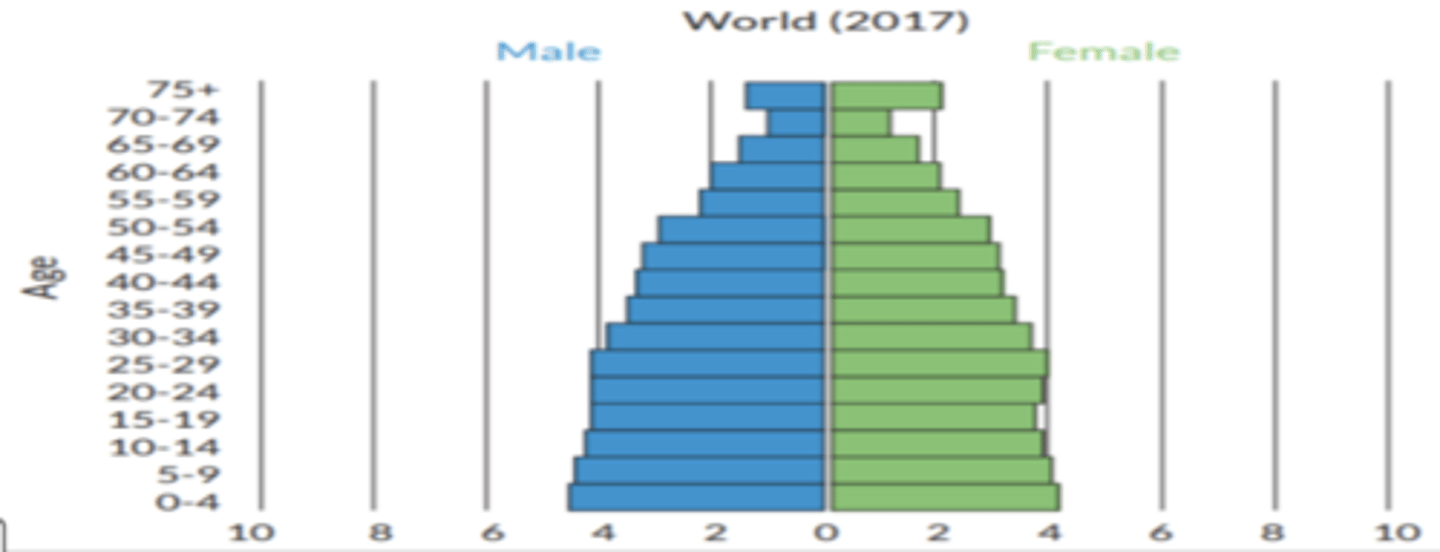
Males: 52%
females: 48%
Does this world have more males or females?
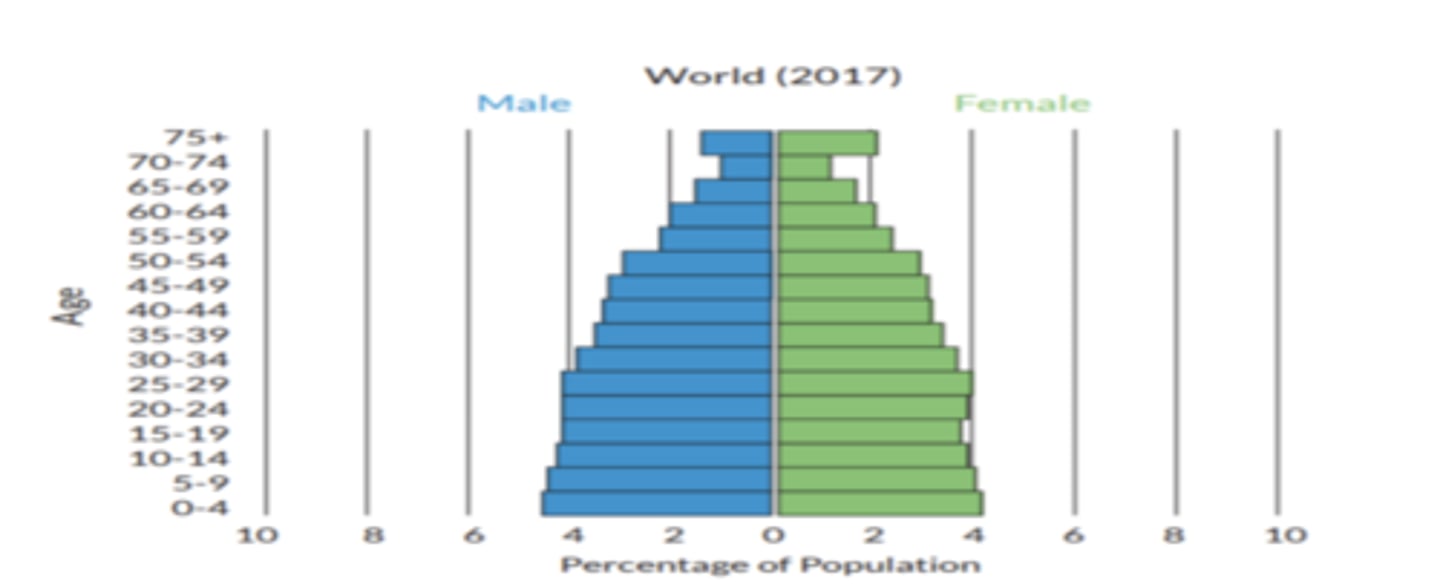
Can't tell because age structure diagrams show entire population of the world
Which country has highest density:
females
Are there more elderly males or females?
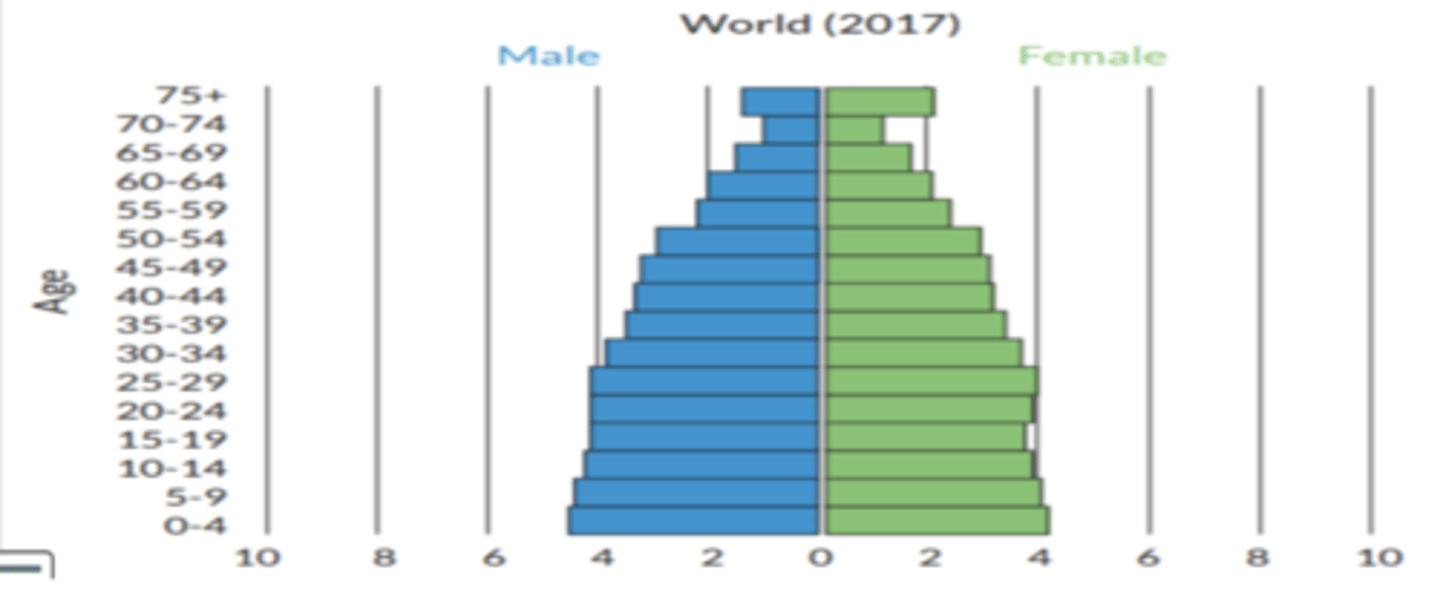
0-9 because they are the most abundant populations
If you owned a business, which age group would you want to target?
World has slower population growth
Which has the slowest population growth?
New Zealand
Which country is the closest to having zero population growth? In other words, it's stable.