CAP4770 Exam 1
1/48
There's no tags or description
Looks like no tags are added yet.
Name | Mastery | Learn | Test | Matching | Spaced | Call with Kai |
|---|
No study sessions yet.
49 Terms
Classify bronze, silver, and gold medals as awarded at the Olympics:
binary
discrete
ordinal
continuous
Ordinal - categories with meaningful order/ranking
Predicting sales amounts of a new product based on advertising expenditure is an example of regression. T/F?
TRUE
“Outlier” can be desired or interesing. T/F?
TRUE
Binary attributes are a special case of categorical attributes. T/F?
FALSE (special case of discrete)
Combining two or more attributes (or objects) into a single attribute (or object) is an example of …
sampling
aggregation
feature extraction
feature selection
Aggregation
In sampling without replacement, the same object can be picked up more than once. T/F?
FALSE
In order to do simple random sampling, we split the data into several partitions; and draw random samples from each partition. T/F?
FALSE
Arrangement is a broader term that encompasses both similarity and dissimilarity. It’s like having a single word to describe how two things are connected - whether they’re alike or different. T/F?
FALSE
Euclidean Density: Center-Based is one of the simplest approaches to divide the region into a number of rectangular cells of equal volume and define density as a number of points teh cell contains. T/F?
FALSE
Jaccard similarity = number of 11 matches / number of non-zero attributes
x = 0101010001
y = 0100011001
What is the Jaccard similarity?
0.6
For a coin with probability p of heads and probability q =1 - p of tails.
For p = 1, what is the entropy (H)?
0
1
1.32
2
0
While correlation is a valuable measure for assessing linear relationships, it’s important to remember that it only captures linear connections. In cases where the relationship between variables is non-linear, the correlation coefficient may not accurately represent the underlying patter. T/F?
TRUE
Cosine similarity measures the cosine of the angle between two vectors and is especially useful for text-based data. T/F?
TRUE
When you are the fourth tallest person in a group of 20, it means that you are the 80th percentile. T/F?
TRUE
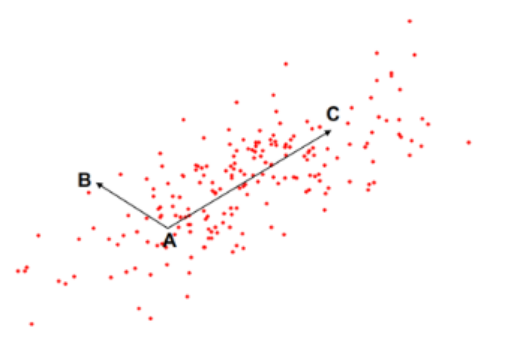
Assume we have three points A, B, and C as shown in the figure. No matter which distance metric we employ, we can assert that the distance from A to C is larger than the distance from A to B. T/F?
FALSE
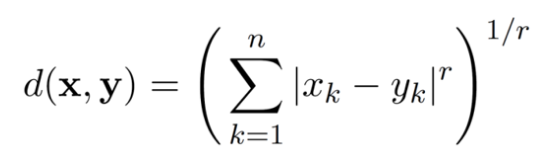
Minkowski distance with r=1 is Manhattan distance. T/F?
TRUE
Entropy quantifies the amount of information needed to describe the state of a system or the unpredictability of an outcome. T/F?
TRUE
EDA is a short form of Exploratory Data Analysis. T/F?
TRUE
Density measures the degree to which data objects are close to each other in a specified area. Concept of density is typically used for clustering and anomaly detection. T/F?
TRUE
The curse of dimensionality means that adding more variables always improves the performance of data models. T/F?
FALSE
PCA is suitable for both numerical and categorical variables. T/F?
FALSE
PCA focuses on maximizing the variance in data. T/F?
TRUE
LDA is an unsupervised dimensionality reduction technique. T/F?
FALSE
t-SNE is primarily used for feature reduction before classification. T/F?
FALSE
In PCA, the principal components are orthogonal to each other. T/F?
TRUE
LDA aims to maximize the variance between classes and minimize the variance within classes. T/F?
TRUE
The maximum number of principal components in a dataset with n samples and p features is min(n-1, p). T/F?
TRUE
PCA always leads to perfect class separability. T/F?
FALSE
t-SNE captures non-linear relationships in data better than PCA and LDA. T/F?
TRUE
Which of the following best describes the curse of dimensionality?
adding more variables leads to sparse data space and poor model performance
adding more variables improves model performance
adding more data points always solves data sparsity
none of the above
Adding more variables leads to sparse data space and poor model performance
Which dimensionality reduction technique is supervised?
t-SNE
LDA
PCA
All are supervised
LDA
Which technique focuses on maximizing the variance in the data?
Logistic Regression
t-SNE
LDA
PCA
PCA
Which technique is most suitable for visualizing high-dimensional non-linear data?
Random forest
LDA
PCA
t-SNE
t-SNE
What is the main goal of LDA?
Maximize variance in data
Minimize error in data points
Maximize class separability
Reduce number of features randomly
Maximize class separability
Which of the following steps is common to both PCA and LDA?
Reducing dimensions based on neighborhood probabilities
Standardizing the data
Using class labels reduction
Calculating between-class scatter
Standardizing the data
t-SNE is particularly useful for:
Visualizing high-dimensional data
Linear transformations of data
Optimizing regression models
Feature selection for classification
Visualizing high-dimensional data
In PCA, the eigenvector with the highest eigenvalue is called:
The main axis
The principal component
The variance vector
The discriminant function
The principal component
Which of the following is a limitation of PCA?
PCA doesn’t have any limitations
It is supervised
It ignores class labels
It requires non-linear separability
It ignores class labels
Which technique focuses on maximizing the separation between classes while minimizing variance within each class?
LDA
PCA
t-SNE
Factor analysis
LDA
What are the categorical attributes?
Nominal: no coherent order
Ordinal: meaningful order or rank
What are the numerical attributes?
Interval: meaningful order and consistent intervals
Ratio: meaningful order and a TRUE ZERO
What is a discrete attribute?
Has a finite or countably infinite set of values
BINARY is a special case of DISCRETE
What is a continuous attribute?
has real numbers as attribute values
(typically represented as floating point values)
How do we identify outliers?
Z-score; this measures how many standard deviations a data point is away from the mean of a dataset
Can outliers have a positive impact too?
Yes; they can provide insight on unusual trends, opportunities, or exceptional cases in data.
What is clustering and why is it used?
Clustering finds groups of objects with similar relation to one another within each group compared to other groups.
Used for understanding groups of similarities in datasets and reducing the size of large datasets.
What is Association Rule Discovery?
Finding similarities or relations between variables in databases.
Consider a dataset where the “Income” attribute is heavily skewed. What transformation technique would you apply to normalize this data, and why?
Logarithmic transformation; this will reduce skewness by normalizing the data distribution