BIEN135 Final Discussion Questions (Ch. 6-8)
0.0(0)
Studied by 45 peopleCard Sorting
1/24
Earn XP
Description and Tags
Last updated 12:00 PM on 12/1/22
Name | Mastery | Learn | Test | Matching | Spaced | Call with Kai | Chat |
|---|
No analytics yet
Send a link to your students to track their progress
25 Terms
1
New cards
6.1) Which of the following properties are extensive (choose all that apply):
a. temperature
b. pressure
c. amount of heat released
d. density
e. energy
f. molarity
g. number of moles
h. mass
i. volume
a. temperature
b. pressure
c. amount of heat released
d. density
e. energy
f. molarity
g. number of moles
h. mass
i. volume
C, E, G, H, I
2
New cards
6.2) A piston containing an ideal gas expands isothermally from 7 atm pressure to 2 atm pressure. The energy of the system (that is, the contents of the piston) remains constant during this process. (True/False)
True
3
New cards
6.4) The enthalpy change for a process is equal to the heat transferred to the system under which of the following conditions?
a. constant volume
b. constant pressure
c. constant temperature
d. reversible expansion
e. expansion at a constant pressure followed by reversible compression
a. constant volume
b. constant pressure
c. constant temperature
d. reversible expansion
e. expansion at a constant pressure followed by reversible compression
B
4
New cards
6.8) A reaction that releases energy is called an __________ reaction.
exothermic
5
New cards
6.10) Electrostatic interactions are governed by _______'s Law
Coulomb
6
New cards
6.12) The energy for van der Waals interactions approaches _______ as the distance between atoms goes to zero and approaches _______ at infinite distance.
infinity, zero
7
New cards
6.17) The complete oxidation of one mole of a sugar produces carbon dioxide and water. 2000 kJ of heat is transferred from the system to the surroundings. The rearrangement of bonds as 0.5 moles of the sugar are oxidized generates heat in an open test tube (101 J*L^-1 pressure and 300 K temperature). What is the change in internal energy of the system (ΔU)? What is the change in enthalpy of the system (ΔH)?
ΔU = q + w. There is no work done. Therefore:
ΔU = q = –2000 kJ•mol–1 × 0.5 mol released by the
system
ΔU = –1000 kJ
ΔH = ΔU + PΔV. Since there is no volume change,
ΔV = 0 and ΔH = ΔU = –1000 kJ.
ΔU = q = –2000 kJ•mol–1 × 0.5 mol released by the
system
ΔU = –1000 kJ
ΔH = ΔU + PΔV. Since there is no volume change,
ΔV = 0 and ΔH = ΔU = –1000 kJ.
8
New cards
6.19) How much kinetic energy does a system containing
3 moles of an ideal gas at 300 K possess? What is the
heat capacity at constant volume? How much heat
would need to be transferred to the system to raise the
temperature by 15°C?
3 moles of an ideal gas at 300 K possess? What is the
heat capacity at constant volume? How much heat
would need to be transferred to the system to raise the
temperature by 15°C?
K.E. = 3/2 nRT
= 3/2 × 3 mol × 8.31 J•K^(–1)•mol^(–1) × 300 K
= 11,218.5 J = 11.2 kJ
CV = 3/2 nR
= 3/2 × 3 mol × 8.31 J•K^(–1)•mol^(–1)
= 37.4 J•K^(–1)
q = CV × ΔT = 37.4 J•K^(–1) × 15 K = 561 J
= 3/2 × 3 mol × 8.31 J•K^(–1)•mol^(–1) × 300 K
= 11,218.5 J = 11.2 kJ
CV = 3/2 nR
= 3/2 × 3 mol × 8.31 J•K^(–1)•mol^(–1)
= 37.4 J•K^(–1)
q = CV × ΔT = 37.4 J•K^(–1) × 15 K = 561 J
9
New cards
6.25) A salt bridge between an arginine and a glutamic acid
has the two bridging atoms 3.5 Å apart. Assume that
these bridging atoms have elementary charges of +1
and –1, respectively. What is the energy if the residues are a) on the protein
surface (ε = 80) and b) in the core of the protein (ε = 2)?
has the two bridging atoms 3.5 Å apart. Assume that
these bridging atoms have elementary charges of +1
and –1, respectively. What is the energy if the residues are a) on the protein
surface (ε = 80) and b) in the core of the protein (ε = 2)?
a. U = 1/ε (qiqj/rijÅ) x 1390 kJ•mol^(–1)
U = 1/80(-1/3.5) x 1390 kJ•mol^(–1)= –4.96 kJ•mol^-1
b. U = 1/ε (qiqj/rijÅ) x 1390 kJ•mol^(–1)
U = 1/2(-1/3.5) x 1390 kJ•mol^(–1)= –199 kJ•mol^-1
U = 1/80(-1/3.5) x 1390 kJ•mol^(–1)= –4.96 kJ•mol^-1
b. U = 1/ε (qiqj/rijÅ) x 1390 kJ•mol^(–1)
U = 1/2(-1/3.5) x 1390 kJ•mol^(–1)= –199 kJ•mol^-1
10
New cards
7.1) It is easier to predict the bulk behavior of a small
number of molecules than a large number of molecules. (True/False)
number of molecules than a large number of molecules. (True/False)
False
11
New cards
7.3) Consider a coin with two sides (H = heads; T = tails). The
probability of observing HHHHHTTTTT is equal to the
probability of observing HTHTHTHTHT.
(True/False)
probability of observing HHHHHTTTTT is equal to the
probability of observing HTHTHTHTHT.
(True/False)
True
12
New cards
7.7) A state corresponds to many different microstates. (True/False)
True
13
New cards
7.9) When the volume of a system increases, its multiplicity
________.
________.
increases
14
New cards
7.11) The combined entropy of the system and surroundings
always _______________ for a spontaneous process.
always _______________ for a spontaneous process.
increases
15
New cards
7.13) A coin is weighted deliberately so that the probability
of tossing heads is twice the probability of tossing tails.
What is the probability of tossing three heads in a row?
What is the probability of tossing three tails in a row?
What is the relative probability of tossing three heads
versus three tails?
of tossing heads is twice the probability of tossing tails.
What is the probability of tossing three heads in a row?
What is the probability of tossing three tails in a row?
What is the relative probability of tossing three heads
versus three tails?
increases
2/3 chance of heads, 1/3 of tails.
3 heads in a row = (2/3)3 = 8/27 = 0.296.
3 tails in a row = (1/3)3 = 1/27 = 0.037.
Relative probability = (8/27)/(1/27) = 8 times more likely
2/3 chance of heads, 1/3 of tails.
3 heads in a row = (2/3)3 = 8/27 = 0.296.
3 tails in a row = (1/3)3 = 1/27 = 0.037.
Relative probability = (8/27)/(1/27) = 8 times more likely
16
New cards
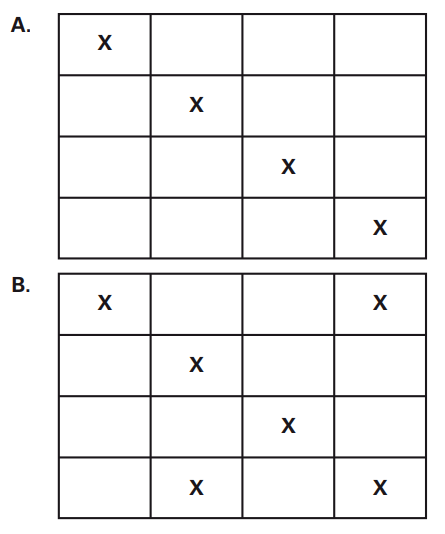
7.17) Consider the systems below consisting of different
numbers of identical molecules (indicated by the
symbol X) and equal-sized grid boxes that are either
empty or occupied by a molecule. Which system has
a higher entropy? What is the difference in entropy
between A and B?
numbers of identical molecules (indicated by the
symbol X) and equal-sized grid boxes that are either
empty or occupied by a molecule. Which system has
a higher entropy? What is the difference in entropy
between A and B?
WA = 16!/12!4!
WB = 16!/6!10!
WB > WA
WB = 16!/6!10!
WB > WA
17
New cards
7.20) System A has a multiplicity of 15, whereas System B has
a multiplicity of 12. What is the total entropy of Systems
A and B?
a multiplicity of 12. What is the total entropy of Systems
A and B?
The entropies of the two parts will be additive.
Therefore we can calculate them separately.
SA = kB ln(15) = 2.71 kB; SB = kB ln(12) = 2.48 kB.
Total entropy = 5.19 kB.
Therefore we can calculate them separately.
SA = kB ln(15) = 2.71 kB; SB = kB ln(12) = 2.48 kB.
Total entropy = 5.19 kB.
18
New cards
8.2) If the second-lowest energy level is separated from the
ground state by 0.5kBT, then the second-lowest energy
level will not be occupied appreciably. (True/False)
ground state by 0.5kBT, then the second-lowest energy
level will not be occupied appreciably. (True/False)
False
19
New cards
8.6) After spontaneous heat transfer between systems, the
overall multiplicity is:
a. lower than it was before the transfer of heat
b. zero
c. maximized
d. minimized
overall multiplicity is:
a. lower than it was before the transfer of heat
b. zero
c. maximized
d. minimized
C
20
New cards
8.8) The Boltzmann distribution describes the energy of
molecules at _________________.
molecules at _________________.
equilibrium
21
New cards
8.10) Kinetic energy is due to the __________ of atoms.
Potential energy is due to the ___________ of atoms.
Potential energy is due to the ___________ of atoms.
motion, configuration/relative positions
22
New cards
8.12) If two systems of different temperatures are brought
together, there will be a net transfer of heat from the
system of __________ temperature to the system of
_________ temperature.
together, there will be a net transfer of heat from the
system of __________ temperature to the system of
_________ temperature.
higher, lower
23
New cards
8.14) A system starts with a multiplicity of 1099. Heat is transferred out of the system reversibly at 298 K such that
the final multiplicity is 105. How much heat was lost?
the final multiplicity is 105. How much heat was lost?
∆S = kB ln(Wfinal/Winitial) = kB ln (10^5/10^99) = -216J*K^-1
qrev = T∆S = (298 K)(–216 J•K^–1) = -64.5 kJ
64.5 kJ of heat are lost
qrev = T∆S = (298 K)(–216 J•K^–1) = -64.5 kJ
64.5 kJ of heat are lost
24
New cards
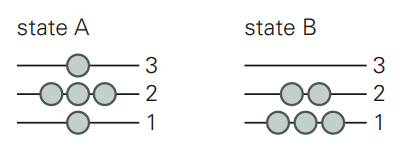
8.17) Consider a system with five molecules and three energy
levels. The energy levels are such that a molecule at
energy level 1 contributes 1 J of energy to UTOTAL, a
molecule at energy level 2 contributes 2 J of energy to
UTOTAL, and a molecule in energy level 3 contributes
3 J of energy to UTOTAL. Which has more internal energy,
state A or state B?
levels. The energy levels are such that a molecule at
energy level 1 contributes 1 J of energy to UTOTAL, a
molecule at energy level 2 contributes 2 J of energy to
UTOTAL, and a molecule in energy level 3 contributes
3 J of energy to UTOTAL. Which has more internal energy,
state A or state B?
For State A
UTOTAL = ΣNiUi = 3 × N3 + 2 × N2 + 1 × N1
= 3 × 1 + 2 × 3 + 1 × 1 = 10
For State B
UTOTAL = ΣNiUi = 3 × N3 + 2 × N2 + 1 × N1
= 3 × 0 + 2 × 2 + 1 × 3 = 7
Therefore, system A has greater energy.
UTOTAL = ΣNiUi = 3 × N3 + 2 × N2 + 1 × N1
= 3 × 1 + 2 × 3 + 1 × 1 = 10
For State B
UTOTAL = ΣNiUi = 3 × N3 + 2 × N2 + 1 × N1
= 3 × 0 + 2 × 2 + 1 × 3 = 7
Therefore, system A has greater energy.
25
New cards
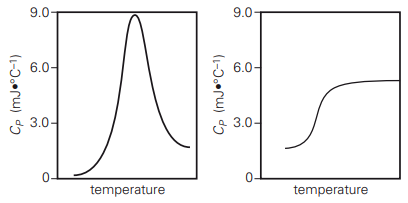
6.20) Below are two graphs of heat capacity changes in
a differential scanning calorimeter experiment. In
the experiment, protein molecules in solution are
unfolded by increasing the temperature. In both graphs,
temperature increases from left to right. Which graph
correctly characterizes the heat capacity changes of
a protein as it is heated? Which characteristics in the
graph lead to this conclusion?
The graph on the left is correct. Both graphs correctly
indicate that the heat capacity at low temperatures,
when the protein is folded, is lower than the heat
capacity at high temperatures, when the protein is
unfolded. However, the heat capacity of a protein peaks
at its melting temperature because relatively more
energy goes into breaking intramolecular interactions.
It then decreases at higher temperatures when fewer
unbroken interactions persist. Only the left graph
indicates this correctly.