psychometrics
1/75
There's no tags or description
Looks like no tags are added yet.
Name | Mastery | Learn | Test | Matching | Spaced | Call with Kai |
|---|
No analytics yet
Send a link to your students to track their progress
76 Terms
factor matrix
correlations (factor loadings) of the items with the factors of the unrotated factor solution
before rotation all items load as high as possible on the first factor, because the first factor explains the most variance.
pattern matrix
semi-partial correlations ritem1,factor1.factor2 (comparable to regression coefficients) of the items and the factors of the rotated factor solution.
Often called the unique contribution of a factor to an item
usually the most clear structure
factor correlation matrix
shows the correlation between the factors for the rotated solution
this correlation is 0 per definition if we use varimax (orthogonal) rotation
structure matrix
e correlations between the items and the factors of the rotated factor solution
unidimensional test
includes items that reflect only a single attribute of a person
Only a single score is computed
all the items are combined into a compositive score
conceptual homogeneity
responses to each item are a function of the same psychological attribute
multidimensional tests
can produce a variety of scores
each subtest is unidimensional and has its own score
whole test can be scored in several ways; second order structure is the most common
explorative factor analysis
tries to identify sets of items that strongly correlate with each other and weakly correlate with others
orthogonal rotation
generates factors that are uncorrelated with each other
varimax is the most common
obique rotation
generates factors that are either correlated or uncorrelated with each other
allows the factors to do what they want
→ preferred by experts
factor loading in orthogonal rotation
loadings can be seen as correlation between each item and each factor
pattern coefficient
reflect the unique association between an item and a factor
structure coefficient
correlations between respondents item responses and their levels of the underlying factor
interpreting factor loadings
size of loading indicated the degree of association between an item and a factor → larger loading means larger association
direction of loading: positive loading means that people with a high score have high levels of the underlying factor
simple structure
occurs when each item is strongly associated with only one factor
validity
not the property of a test, is related to interpretation and use of the scores in a specific context
is a matter of degree
is based on strong empirical evidence
construct validity
considered the essential concept of validity
validity definition
the degree to which evidence and theory support the interpretations of test scores for proposed uses

facets of construct validity
test content (content validity)
internal structure (structural validity)
response processes (response process validity)
association with other variables (associative validity)
consequence of use ( consequential validity)
content validity
is rated by experts
does the content of the test match what should be in the test
threats to content validity
Construct irrelevant content
Construct underrepresentation
face validity
the degree to which a test appears to be related to a specific construct
weakest form of validity, but influences participant motivation
structural validity
Does the internal structure of the test match the internal structure the test should have
evidence through factor analysis (number of factors, association among factors, meaning of factors)
response process validity
Do the psychological processes that respondents use when completing a measure match the processes they should use?
evidence comes from interviews and indirect indicators like response time and eye tracking
associative validity
Do the associations between the test and other measures match the associations the test should have with these other measures?
relevant evidence: correlations
convergent validity
discriminant validity
concurrent and predictive validity (criterion validity)
consequential validity
Do the consequences of using a test match the consequences that should be seen?
Are the test scores equally valid for different groups?
relevant evidence: evaluation of intended consequences, unintended differential impact and systematic changes
reliability
the extent to which differences in respondents' observed scores are consistent with differences in their true score
is a property of test responses and test scores (consistency)
effects of reliability
affects the association between variables, which is an aspect of construct validity (associative validity)
we can use correlations to make conclusions about validity
high reliability is necessary for validity but not sufficient
convergent validity
Are variables that should be (highly) positively correlated, actually (highly) positively correlated?
Are variables that should be (highly) negatively correlated, actually (highly) negatively correlated?
discriminant validity
Are variables that should not be correlated, actually uncorrelated?
multitrait-multimethod matrices
purpose: to set clear guidelines for evaluating convergent and discriminant validity
evaluate construct/trait variance and method variance
construct/trait variance
Tests share _________ when they measure the same (or similar) constructs
method variance
share ________ when they use the same type of measure/instrument (e.g., self-reports on both measures, parents filling out both questionnaires)
outcomes multitrait-multimethod matrices
same trait - same method: reliabilities should be high because they affect the observed correlation between variables
same trait - different method: correlation should be moderate to high because it measures the same construct
different trait - same method - correlation depends on the constructs you are measuring and the expectations should be based on theory
different trait - different method: also depends on the measured construct but should be lower than the one with same method; weakest correlation
sources of variance
systematic
trait/construct → intended
method → variance in the scores caused by the instrument used (unintended)
subject properties: variance that comes from differences between participants that are not related to the measured trait (unintended)
situation/location: variance comes from differences in the environment or context in which a measurement takes place (unintended)
unsystematic
measurement error
validity coefficient
is a correlation
can be inflated by unintended systematic variances, are not accurate
factors affecting a validity coefficient
association between constructs: the higher the association the higher the coefficient
measurement error and reliability: the validity coefficient is affected by the reliability of the test and criterion
restricted range: causes weaker correlation
skew and relative proportions: differential skew→ weaker possible correlation
time: greater distance → weaker correlation
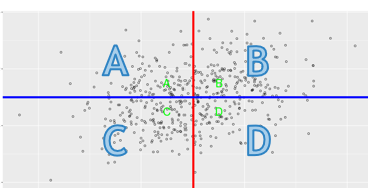
sensitivity
the proportion of people who meet the criterion, and who are correctly identified by the test
B/ A+B

specificity
the proportion of people who do not meet the criterion, and who are correctly identified by the test
C/C+D

positive predictive value (success rate)
the probability that someone with a positive test result actually meet the criterion
B/B+D

negative predictive value
the probability that someone with a negative test result actually does not meet the criteria
C/A+C
base rate
everyone who actually meets the criterion
test rate
proportion of people who were identified by the test
reliability depends on what
the extend to which differences in test scores can be attributed to real differences
the extend to which differences in test scores are a function of measurement error
key assumptions of reliability
a persons observed score on a test is a function of that persons true score, plus error
measurement error is random → it cancels itself our across respondents and they are uncorrelated with true scores
variance of error scores
represents the degree to which error affects different people in different ways
→ high error variance indicates the potential for poor measurement
four ways to think about reliability
as the ratio of true score variance to observed score variance
as lack of error variance
as the squared correlation between observed scores and true scores
as the lack of squared correlation between observed scores and error scores
standard error of measurement
represents the average size of error scores
larger means greater difference between true and observed score and less reliability
assumption that error is random
respondents true score on each test are uncorrelated with their error scores on the other tests
respondents error score on test 1 are uncorrelated with error scores on test 2
common assumptions among all models
error is random
tests are unidimensional
true scores on one test are linearly related to the true scores on other tests
differences in assumptions of models
slope value
intercept value
same error variance
parallel tests criteria
basic assumptions of CTT are met
3 additional assumptions
slope for true scores is one
intercept for true scores is 0
two tests have the same error variance
→ correlation between parallel tests is equal to the reliability
implications of same error variance
perfect correlation of true scores
identical mean true score across tests
identical variability
identical mean observed scores
identical variability of observed scores
tau-equivalence criteria and implications
all basic CTT assumptions are met
2 additional assumptions
intercept for true scores is 0
slope for true scores is 1
perfect correlation of true scores
identical variability of true scores
identical mean true scores across tests
identical mean of observed scores
essentially tau-equivalent criteria and implications
CTT assumptions are met
slope for true scores is 1
perfect correlation of true scores
identical variability of true scores
basics of the methods for estimating reliability
no single method can provide a completely accurate estimate
every method requires at least two testing’s to generate an estimate of reliability
consistency is the basis of estimating reliability for every method
alternate forms method of estimating reliability
obtain scores from two different test forms and compute the correlation between the two forms
take that as an estimator of reliability
only works when test forms are parallel
disadvantages of alternate forms method of estimating reliability
we can never know if two tests are parallel
there is potential for carryover effect or contamination due to repeated testing
contamination
error on one test might influence the error on another test but according to CTT it must be random
assumed parallel items
when we have two test forms that have similar means and standard deviations and we feel confident that they measure the same construct
test-retest method of estimating reliability
requires the people to take the same test one more than one occasion
is assumptions are met then the correlation between test and retest can be interpreted as an estimate of the test reliability
assumes that the two test occasions produce test scores that are equally reliable
disadvantages of test-retest method of estimating reliability
stability assumptions
error variance is strongly affected by temporal elements so test situations have to be set up carefully because we need error variance to be the same
we assume same true scores → respondents might experience psychological changes between occasions which change their true score
length of interval has an effect
short intervals carry the risk of contamination/carryover
long intervals make psychological changes more likely
psychological changes are more likely in certain lifetime periods
internal consistency method of estimating reliability
requires only one test
different parts of a test can be treated as different forms of a test
if the different parts are highly correlated it is likely that the test is reliable
long test is likely to provide more reliable sources
split-half reliability
sort the test items into two parallel subtests of equal size
compute a score for each subtest and correlate those
enter the correlation in a formular
→ idea is to create tow parallel subtests
raw coefficient alpha
is an item level approach, conceives of every item as a subtest
consistency among all of the items can be used to estimate the reliability
Cronbachs alpha (raw alpha)
most widely used method
calculate the variance of scores on the complete test
calculate the covariance between each pair of items
sum up covariances → larger sum means items are more consistent
enter into equation
obtaining a negative alpha
may be because something is very wrong with the test
the test is fine but more items need to be reverse scored
standardized coefficient alpha (spearman brown formular)
highly related to raw alpha
is appropriate when test items are scored on different scales and therefore have dramatically different variances
obtain a set of item level statistics
calculate the correlations between each pair of items
average pairwise correlations
enter in the equation
Raw alpha for binary items (KR-20)
is algebraically identically to raw alpha
for each item calculate the proportion of each of the two possible answers
calculate the variance for each item and the variance of the total test score
enter into the formular
factors affecting the reliability of test scores
consistency among the parts of a test
length of the test → as test length increases, true score variance increases more than error variance
sample heterogeneity and reliability generalization
spearman brown prophecy formular
estimates the reliability of a revised test
can be used to forecast what would happen if a test was revised in a particular way
length only improves reliability if everything else stays the same
items must be parallel
intraindividual change score
each person has two scores on the same test of measure
intraindividual discrepancy score
each person has scores from two different test
estimating reliability of difference scores
estimation on the basis of three sets of information
the estimated reliability of each set of test scores used to compute the difference scores
variability of the tests observed scores
correlation between observed test scores
factors affecting the reliability of difference scores
correlation of observed scores → is two tests have high correlation, the difference score has low reliability
reliability of the two test scores used to compute the difference scores → positive correlation
reliability of the difference scores will not be higher than the average reliability of the two test scores but can be much lower
problems of unequal variability
if tests have different variability, the difference score will be strongly linked to the test with the higher variance