Hematology 1b
1/24
There's no tags or description
Looks like no tags are added yet.
Name | Mastery | Learn | Test | Matching | Spaced |
|---|
No study sessions yet.
25 Terms
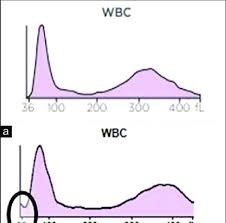
What is the circle indicating
if large blip, could indicate nRBC or Plt clumps
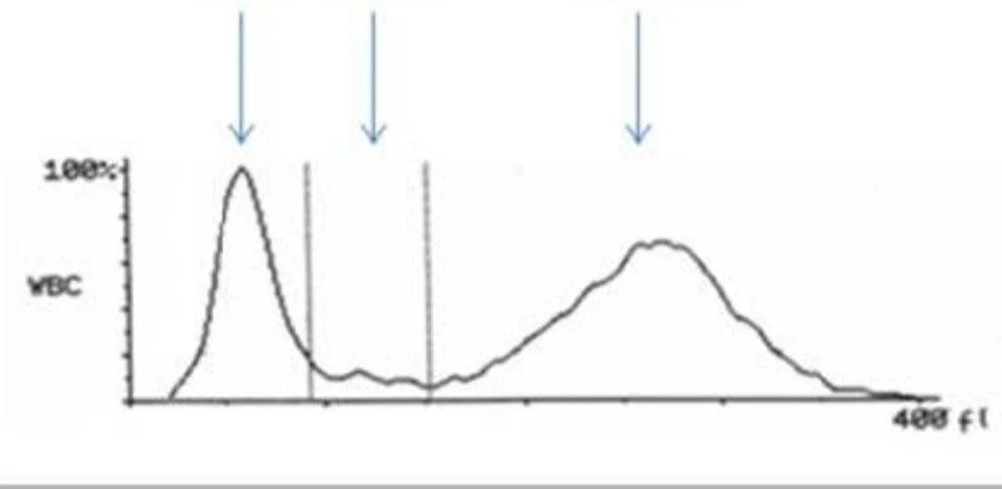
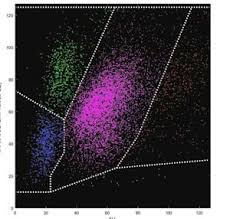
What instrument? What are each arrow representing?
Left- Lymphocytes
Middle- Mononuclear cells
Right- Granulocytes
Coulter LH Series WBC 3 part differential
Coulter principle
Blood cells diluted in an electrically conductive diluent
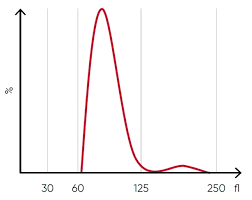
What does this represent? The width of the peak represents?
RBC & RDW. Larger RDW has a broad curve
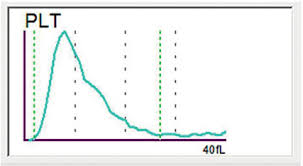
What does this graph represent? What would be happenin if the line was jagged?
Platelet
platelet clump
Blue- Lymphocytes
Green- Monocytes
Pink- Neutrophils
Right: Eosinophils
very very left would show nRBC or giant Plts
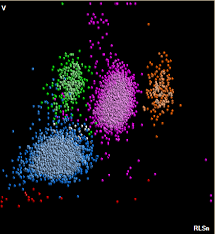
Blue- lymph
Green- Mono
Pink- Neutrophils
Orange- Eosinophils
Basophils are mixed behind
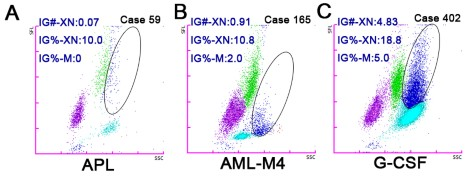
what are the circles represnting
immature grans
VCS flow cellnfor 5 part WBC diff principle
Cells pass thru flow cell singly by hydrodynamic focusing
Volume, conductivity, scatter
Coulter measured parameters
WBC, RBC, Plt, Hgb
Coulter derived parameters
MCV, RDW
Coulter calculated parameters
Hct, MCH, MCHC
System XE series Hemoglobin measurement
Converts ferrous Fe to ferris Fe- methemoglobin
Cyanide free method
Sysmex measured parameters
WBC, RBC, Hgb, Hct, Plt, nRBC, Diff%, Ret%, IRF
Sysmex derived parameters
MCV, RDW, MPV
Sysmex calculated parameters
MCH, MCHC, Diff#, Ret#
Cellavision
Non CBC analyzer
Automated digital cell morphology identification system
Abbott principle
Light scatter and fluorescence
MAPPS technology
Abbott forward light scatter
Cell size
Abbott 7* light scatter
Cell complexity
Abbott 90* light scatter
Nuclear lobularity
Abbott extra assasys
Fluorescent immunophenotyping methods
T cell assay- CD4 & CD8
IMMUNOplt assay- CD61
Abbott 90* depolarized light scatter
Cytoplamsic granularity
WbC histogram cell sizes
Lymphocytes 35-90fL
Mononuclear cells 90-160fL
Granulocytes 160-450 f)