2. Population Ecology (Measuring Populations)
1/32
Earn XP
Name | Mastery | Learn | Test | Matching | Spaced | Call with Kai |
|---|
No analytics yet
Send a link to your students to track their progress
33 Terms
population ecology
the study of populations in relation to environment, including environmental influences on density and distribution, age structure, and population size
density
the number of individuals per unit area or volume
dispersion
the pattern of spacing among individuals within the boundaries of the population
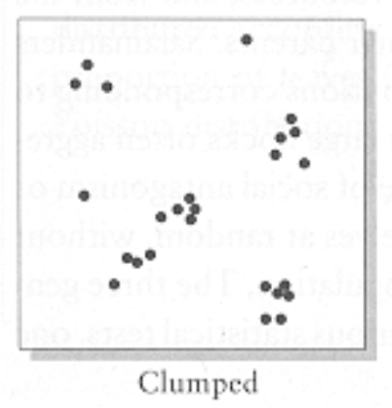
clumped dispersion
(pic)
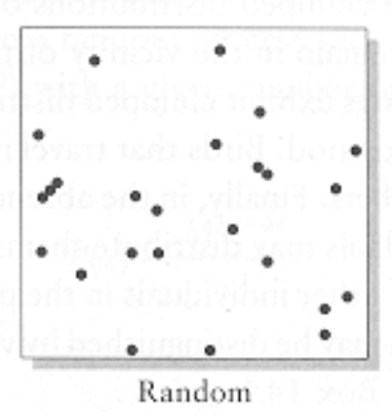
random dispersion
(pic)
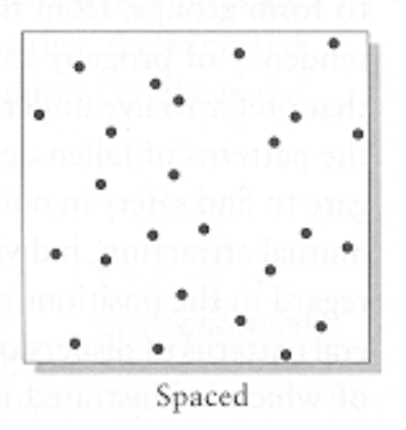
spaced dispersion
(pic)
ex of what dispersion:
filter-feeding stream-dwelling insects
tnet catepillars
wolves (living in group increases hunting effectiveness, work divided up)
clumped/aggregated
ex of what dispersion:
penguins in a rookery
trees in an orchard
king penguins nesting
regular/spaced
ex of what dispersion:
forest trees
poisson/random
demography
the study of the vital statistics of a population and how they change over time
factors where population grows:
birth
immigration
factors where population decreases:
death
emigration
closed population is when there is no:
immigration or emigration
immigration
moving to an area
emigration
leaving an area
parameters that are important to maximize growth rate in growing populations:
age at first reproduction
fecundity
survivorship
fecundity
average number of offspring per episode (clutch size)
survivorship
how many females of a particular age, x, are reproducing
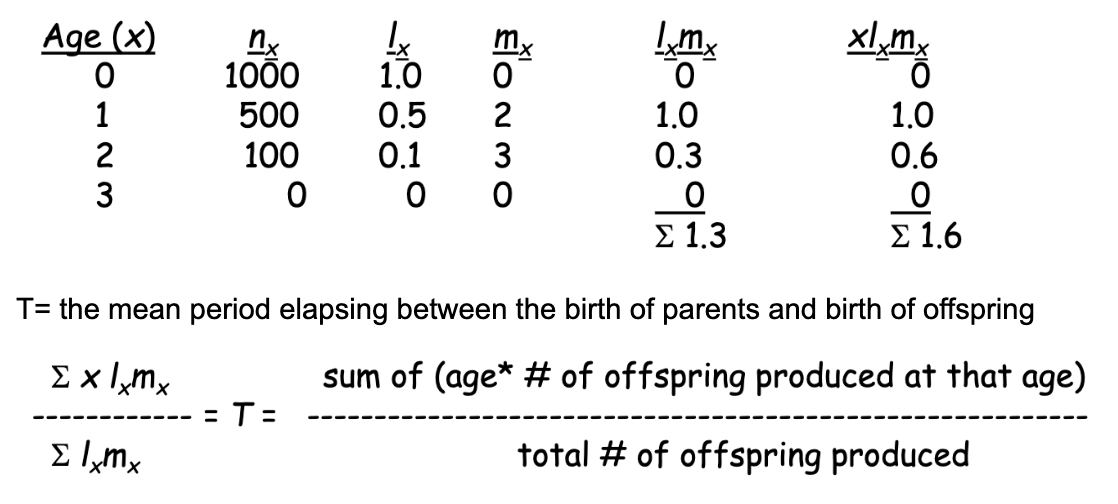
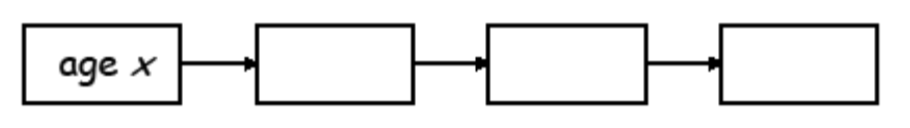
what is a life table?
age-specific summary of the survival pattern of a population
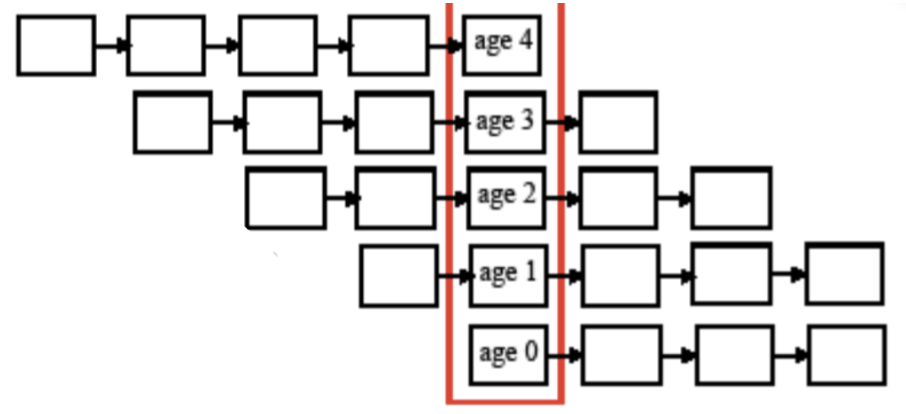
horizontal life table
single observed cohort: age specific data collected
vertical life table
time-specific data are utilized
lx is:
age specific survivorship
n0 is:
the number at the start
nx / n0 is:
proportion of individuals alive at the start of age interval x
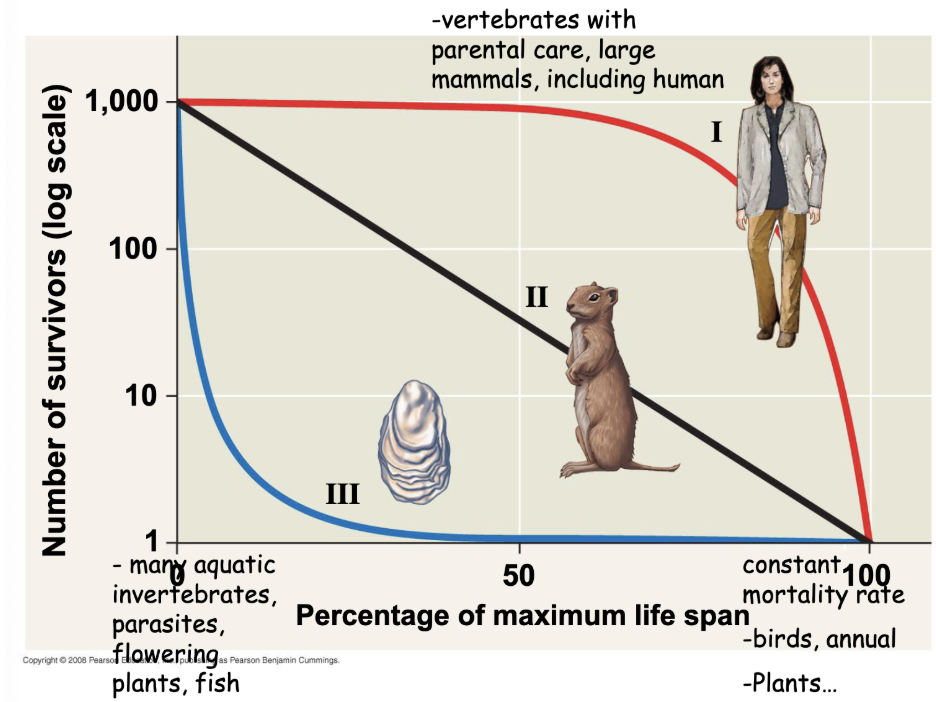
3 types of survivorship curves
Type I: low death rate during early and middle life, then an increase among older age groups
Type II: the death rate is constant over the organisms life span
Type III: high death rate for the young, then slower death rate for survivors
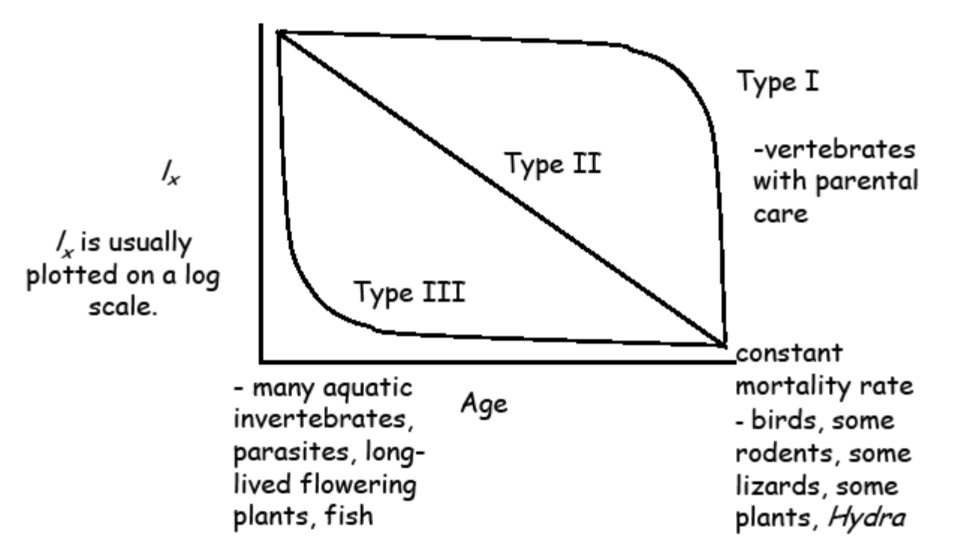
survivorship curve examples
(pic)
reproductive table
or fertility schedule, an age specific summary of the reproductive rates in a population
mx is:
age-specific survivorship
mean number of offspring produced by females of age x
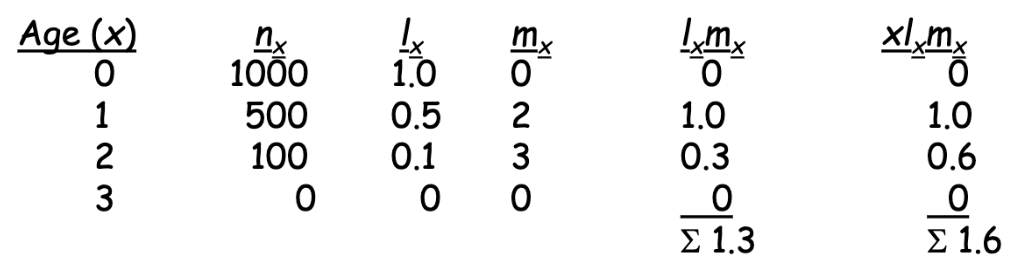
R0 is:
net reproductive rate
expected number of female offspring produced per female per generation
if R0 = 1
population is stable
if R0 < 1
population is decreasing
if R0 >1
population is increasing
mean generation time
ex
T= (1.6)/(1.3) = 1.23 time units