statistics summer flashcards
1/75
Earn XP
Description and Tags
Name | Mastery | Learn | Test | Matching | Spaced | Call with Kai | Chat |
|---|
No analytics yet
Send a link to your students to track their progress
76 Terms
What is catergorical data?
Data that can be sorted into non-overlapping categories
What is ordinal data?
Data which is placed into order or ranked
What can discrete data be grouped into?
Non-overlapping classes with class intervals eg 0-10, 11-20...
What must continuous data intervals be?
They must have no gaps and no overlaps
What is a census?
survey of the entire population
How do u avoid bias in a sample?
Make it as large as possible and don't pick certain individuals as that can add bias.
What is a sampling unit?
Each individual thing in the population that can be sampled
What is a sampling frame?
list of sampling units
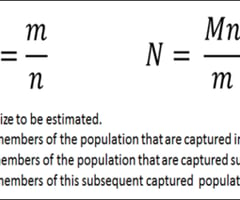
What is the 'Petersen Capture-Recapture' method?
number marked in second sample/ size of second sample = size of first sample/population
what is a random sample
a sample that fairly represents a population because each member has an equal chance of inclusion
What is judgement sampling?
Uses judgement to select a representative sample
Oppurtunity sampling
a sample of whoever happens to be there and agrees to participate
cluster sampling
a sampling technique in which clusters of participants that represent the population are used
systematic sampling
Every nth item in the target population is selected
quota sampling
A nonprobability sampling technique in which researchers divide the population into groups and then arbitrarily choose participants from each group
stratified sampling
a variation of random sampling; the population is divided into subgroups and weighted based on demographic characteristics of the national population
How do u check how reliable results are?
If repeating the survey gives similar data
What is a simulation?
Modelling events in real life to predict what could actually happen
What can be hard to do with open questions?
Hard to analyze and summarise results due to the varied answers
What is an opinion scale?
A table asking if u agree or disagree or strongly agree etc on something.
What to do in questionnaires.
Simple wording.
Unbiased and not leading.
Not too hard or personal to answer.
Make sure good non-overlapping categories.
Time frames for some questions so no confusion.
What is cleaning the data?
The process of removing anomalies from a data set
What are extraneous variables?
any variables other than the independent variable that seem likely to influence the dependent variable in a study
What is a control group?
The group that does not receive the experimental treatment in an experiment.
What is a matched pair test?
When each individual in one group is paired with an individual in another group. The two individuals have everything in common apart from the factor being tested.
What is a pilot survey?
It is a survey conducted on a small sample to test the design and the methods of that survey.
What is a random response method and how do you calculate it
Uses a random event (coin toss) to decide how to answer the question. calculate number of people who ticked yes because they got heads. subtract this from total number who got heads . this number divided by number who got heads.
What is a two-way table?
Displays categorical data for two variables.
What is a vertical line graph?
A bar chart with lines instead of bars
What is a multiple bar chart?
A bar chart with more than one bar for each class. Easy to compare frequencies.
What is a composite bar graph?
Each bar is made up of different components.
What are comparative pie charts?
reas of the 2 should be in the same ratio as their frequencies.
To compare the total frequencies use the area
To compare proportions compare angles
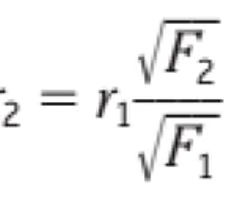
What is the formula for pie chart comparison?
r1^2 over r2^2 = f1 over f2
What is a population pyramid?
A bar graph that represents the distribution of population by age and sex
What is a histogram?
A bar graph that shows continuous data and has no gaps between each bar.
What is a frequency polygon?
Joins the mid-points of bars with straight lines.
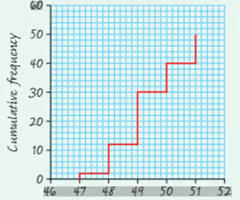
What is a cumulative frequency step polygon?
Discrete data and you plot cumulative frequency against upper class boundaries.
What is a cumulative frequency diagram?
For grouped continuous data and you plot cumulative frequency against upper class boundaries but then join the points up forming curve.
What is the shape of distribution?
Shape formed by bars in a histogram or frequency polygon
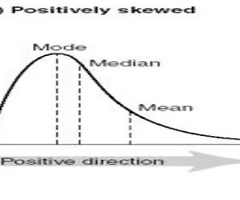
What is a positive skew distribution?
values above median are more spread out
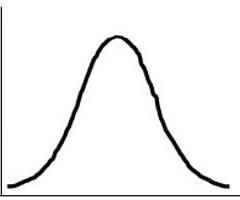
What is a symmetrical distribution?
no skew
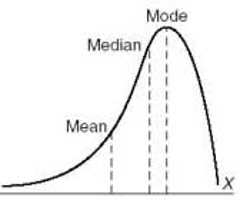
What is a negative skew distribution?
values below the median are more spread out
How do u draw a histogram with unequal class widths?
ou adjust the bar height so the area shows the frequency
What is frequency density?
Frequency/class width
How can graphs be misleading?
Misleading scales eg not starting at 0
Thick lines
No labels
No keys
Missed out some of the data or focusing on one part.
What do tables show?
exact values but no trends or patterns.
Why are 3d diagrams bad?
They distort the data proportion
median of linear interpolation formula
formula for geometric mean
all the values times together rooted by the number of values
What is the formula for weighted mean?
times all values by their weight then add together and divide by total of the weights
How do you calculate an outlier?
large outlier > UQ + 1.5 x IQR
small outlier < LQ - 1.5 x IQR
How do u calculate an outlier in standard deviation?
If it is more than 3 standard deviations from the mean.
skew formula
-3(mean - median) / standard deviation,
-q3-q2>q2-q1 ( positive)
What is a causal relationship?
A change in one variable directly results in the change in another variable
What is a line of best fit?
a straight line that goes through the middle of most of the points and usually the mean point.
What is the regression line?
line of best fit
What is Spearman's Rank correlation coefficient?
It measures the strength of NON-LINEAR correlation between 2 sets of data and is between 1 and -1.
What is Pearson's product moment correlation coefficient
It measures the strength of LINEAR correlation between 2 sets of data basically how much of a straight line the points form.
What is seasonal variation?
Variation in a time series following a regular time period
How do u calculate a moving average?
You take data for one complete cycle of time and work out its average moving a point along and working out the average until you reach the end
Where do you plot moving averages on a graph
On the midpoint of the points that were averaged.
What is probability?
likelihood that a particular event will occur
What is the probability of an event if all outcomes are equally likely
number of successful outcomes / number of total outcomes.
What is expected frequency?
Number of time that a particular event should occur calculated by doing the P(x) x the number of trials
How do you calculate risk?
number of times the event happened/ total number of trials
What is absolute risk?
The probability of an event happening.
What is relative risk?
How many times more likely it is to happen to one group than another.
How do you calculate relative risk?
Risk for group/ risk for those not in the group
What is a sample space?
total number of all possible outcomes
What are mutually exclusive events?
events that cannot happen at the same time
What do you do for mutually exclusive events?
You add them up to get the total probability, known as the addition law.
What are exhaustive events?
They contain all possible outcomes which add up to 1.
What is the general addition law in probability?
P(A or B) is equal to P(A) + P(B) - P(A and B)
What is the multiplication law for independent events?
P(A and B ) = P(A) x P(B)
What is conditional probability?
the probability of an event given that another event has occurred
P(A|B) means probability of A given B
What is the formula for conditional probability?
P(A|B) = P(A and B) / P(B)