AP Stats 1.4-1.8 Vocab Sheet
 Call Kai
 Learn
Learn Practice Test
 Spaced Repetition
 Match
Match Flashcards
 Knowt Play
1/28

There's no tags or description
Looks like no tags are added yet.
Name | Mastery | Learn | Test | Matching | Spaced | Call with Kai | Chat |
|---|
No analytics yet
Send a link to your students to track their progress
29 Terms
Categorical Variable
Places data into groups or categories.
Quantitative Variable
Numerical data
Discrete
Digits you count
Continuous
Can contain decimals
Distribution
The overall pattern of data.
Shape
The form of a distribution (symmetric, skewed left, skewed right).
Spread (Variability)
How much the data values differ from one another.
Mean, Median, Range
Mean: The average of a data set.
Median: The middle value when data is ordered.
Range: Largest value minus smallest value.
Five-Number Summary
Minimum, Q1, Median, Q3, Maximum.
IQR (Interquartile Range)
The spread of the middle 50% of the data; Q3−Q1.
Standard Deviation (SD)
The typical distance of data values from the mean.
Resistant Statistic
Not greatly affected by outliers.
Non-Resistant Statistic
Greatly affected by outliers.
Percentile
The percentage of observations at or below a value.
Z-Score
The number of standard deviations a value is above or below the mean
Standardizing
Converting values into z-scores.
Boxplot
A graph showing the five-number summary.
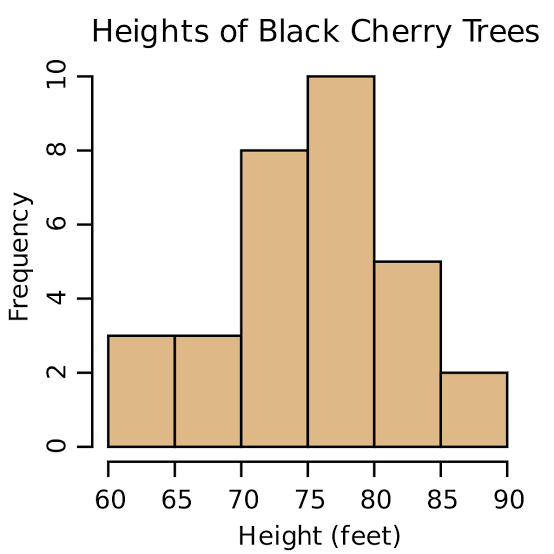
Histogram
A graph displaying quantitative data using intervals.
Stemplot
A graph that organizes data by place value while showing actual values.

Linear Transformation
Applying the same mathematical change to every value in a data set.
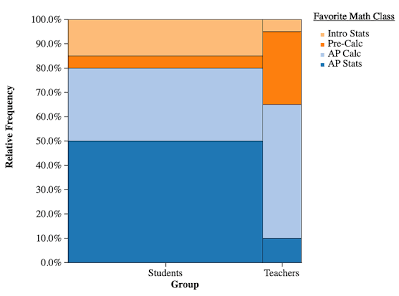
Bar Chart
categorical data
S = Shape
Symmetric → mean ≈ median
Skewed Right → mean > median
Skewed Left → mean < median
Outlier Rule
Lower Fence:
Q1−1.5(IQR)
Upper Fence:
Q3+1.5(IQR)
Outlier if outside either boundary.
Comparing Quantitative Distributions
Use SOCS and compare in context.
Compare:
Shape
Outliers
Center
Spread
Example:
Team A has a higher median score than Team B.
Team A has less variability because its IQR is smaller.
Z-ScoresFormula:
z=x−meanSD
Meaning
z > 0 → above mean
z < 0 → below mean
z = 0 → at mean
Interpretation
The value is ___ standard deviations above/below the mean.
Finding a Value from z
x=mean+z(SD)
Add/Subtract a Constant
Example:
y=x+5
Changes
Mean: +5
Median: +5
Stays Same
Shape
SD
IQR
Range
Memory:
Center changes, spread stays.
Multiply/Divide by a Constant
Example:
y=2x
Everything Multiplies by 2
Mean
Median
SD
IQR
Range
Stays Same
Shape
Memory:
Center and spread change.
Biggest Rules
Right skew → mean > median
Left skew → mean < median
Median & IQR are resistant
Mean & SD are non-resistant
Positive z = above mean
Negative z = below mean
Add/Subtract → center changes, spread stays
Multiply/Divide → center and spread change
Standardized distributions: Mean = 0, SD = 1
Describe distributions using SOCS