psych 218
 Call Kai
 Learn
Learn Practice Test
 Spaced Repetition
 Match
Match Flashcards
 Knowt Play
1/52

There's no tags or description
Looks like no tags are added yet.
Name | Mastery | Learn | Test | Matching | Spaced | Call with Kai | Chat |
|---|
No analytics yet
Send a link to your students to track their progress
53 Terms
descriptive statistics
Descriptive statistics refers to the methods used to summarize and describe the main features of a dataset. This includes measures such as mean, median, mode, range, skew, and standard deviation, variance, interquartile range, providing a clear overview of the data's distribution.
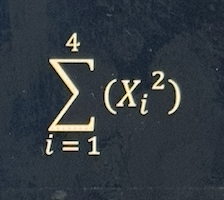
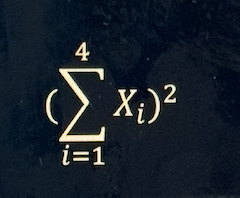
summation
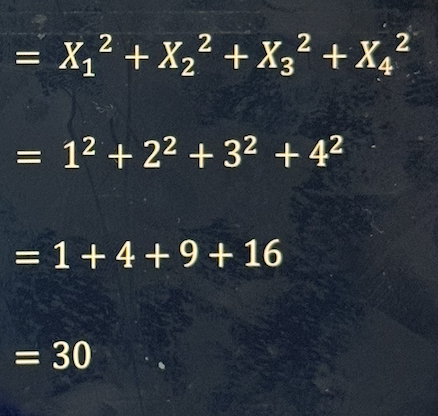
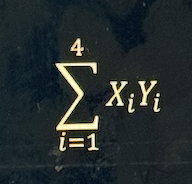
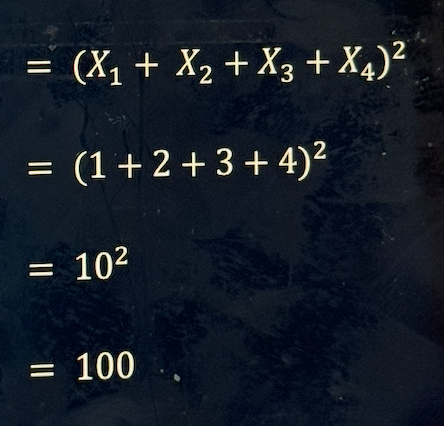
more summation example
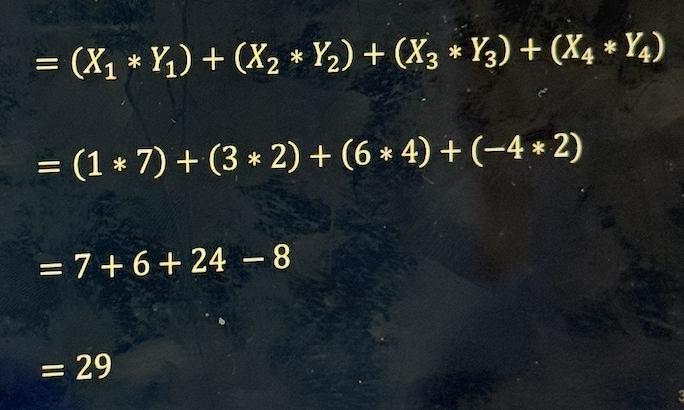
more summation example
Nominal
named categories (ex: dog, mouse, cat, trees, water brands) (never numbers)
Ordinal
rankings (ex: first, second, third) (doesn’t matter the distance between ranks)
Interval
numbers without meaningful zero; scales with meaningful distances between values but no true zero (ex: temperature in Celsius)
Ratio
scales with meaningful distances and a true zero point (ex: height, weight, Kelvin)
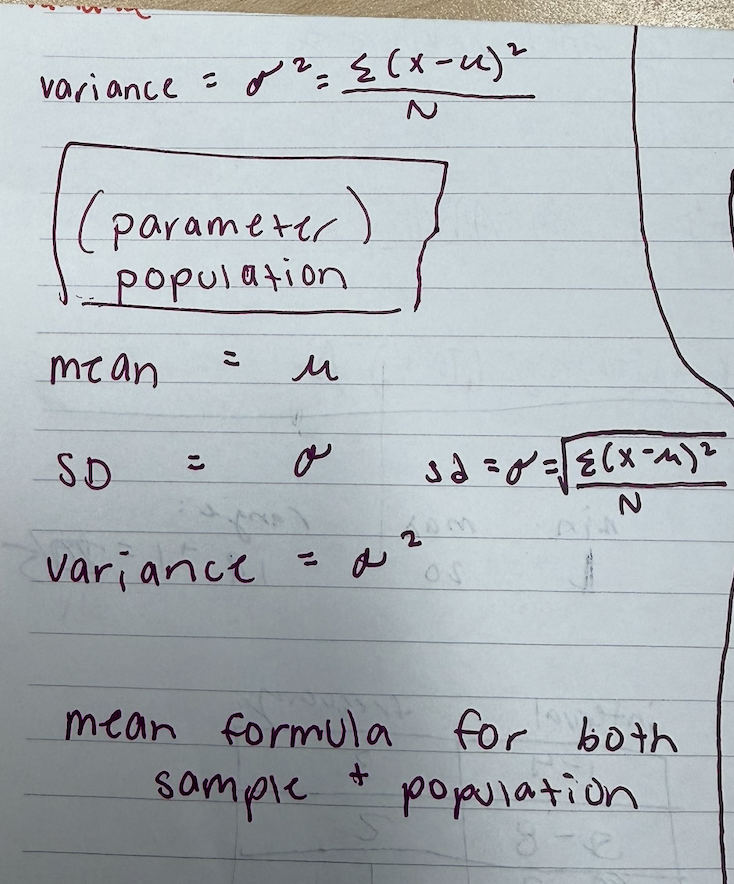
Population
all instances of the people or things that the research question refers to
Parameter
a characteristic of a population (μ) (σ)
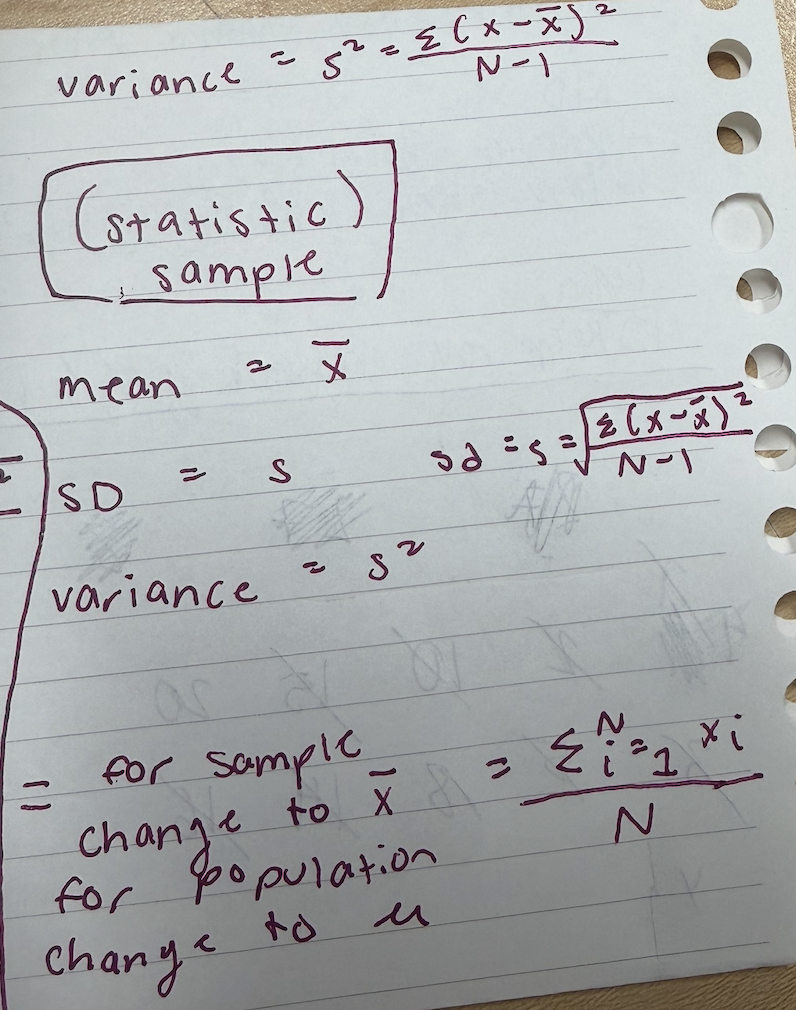
Sample
a selected subset of the population
Statistic
a characteristic of a sample mean (x̄) or sd (s)
Inferential stats
the branch of stats in which we perform a process called hypothesis testing, which enables us to determine the probability of an outcome. makes inferences about the population using data from a sample
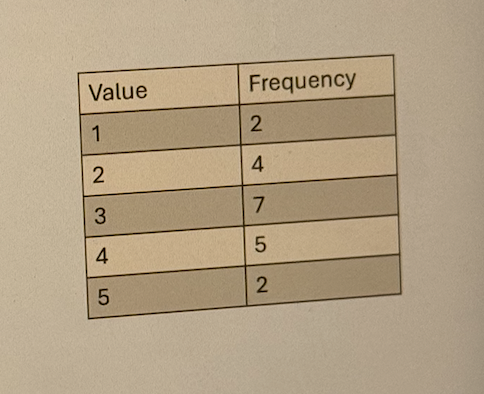
Frequency table
if given a group frequency table, look at the range between numbers and list the values (1- however high it goes to) then list a values column and a frequency column and count how many of each number is in the previous table
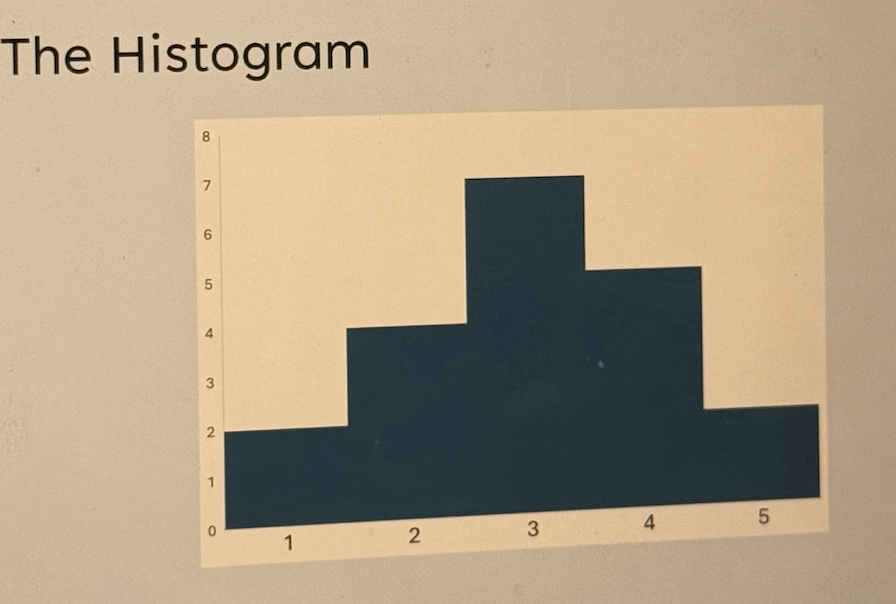
Histogram
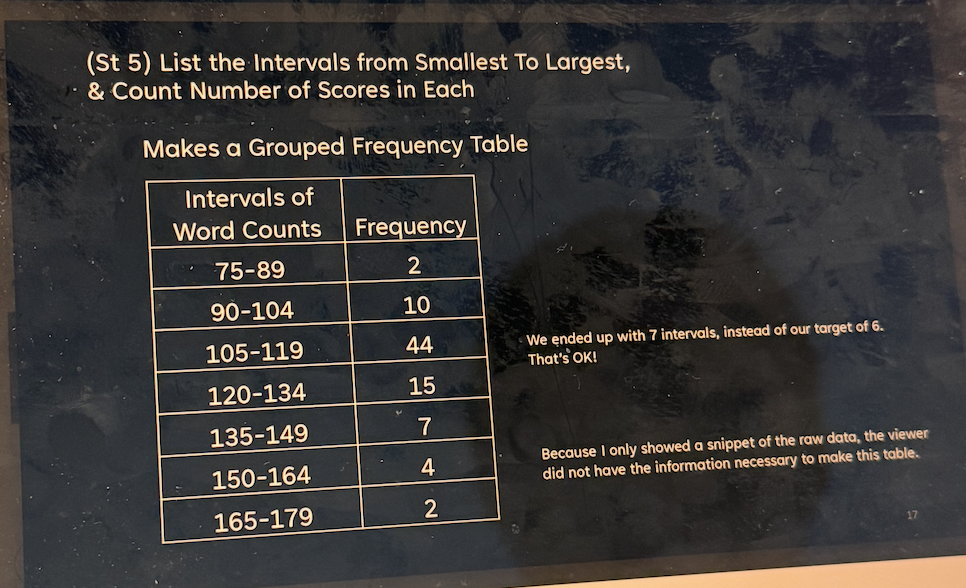
Grouped frequency table
step 1: find min max score
step 2: identify full range of data (round max and min values down, take difference between them and add 1)
step 3: determine number of intervals and best interval size
step 4: decide on number that will be bottom of lowest interval (must contain lowest value, and be divisible by the interval size)
step 5: list intervals from highest to lowest and count number of scores in each
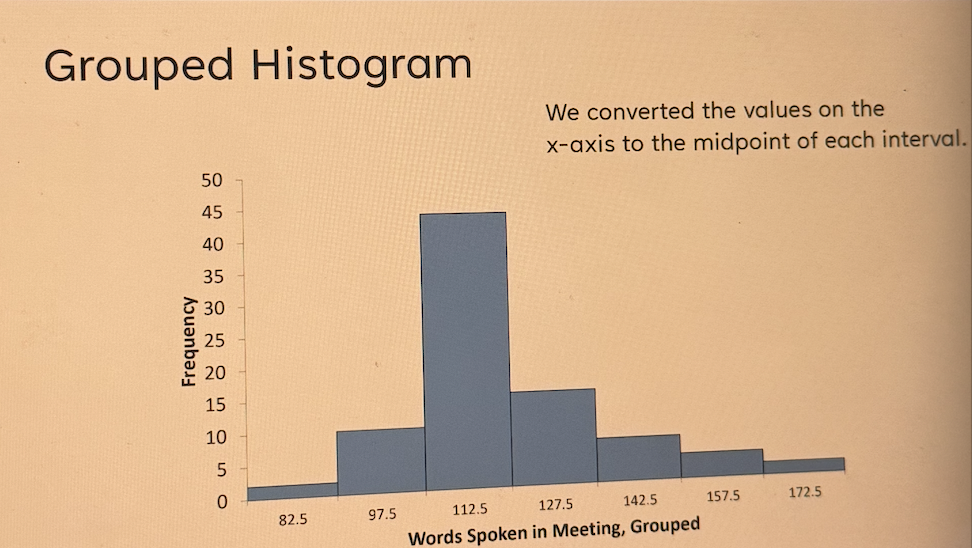
step 6: graph and label x axis with midpoint of each interval
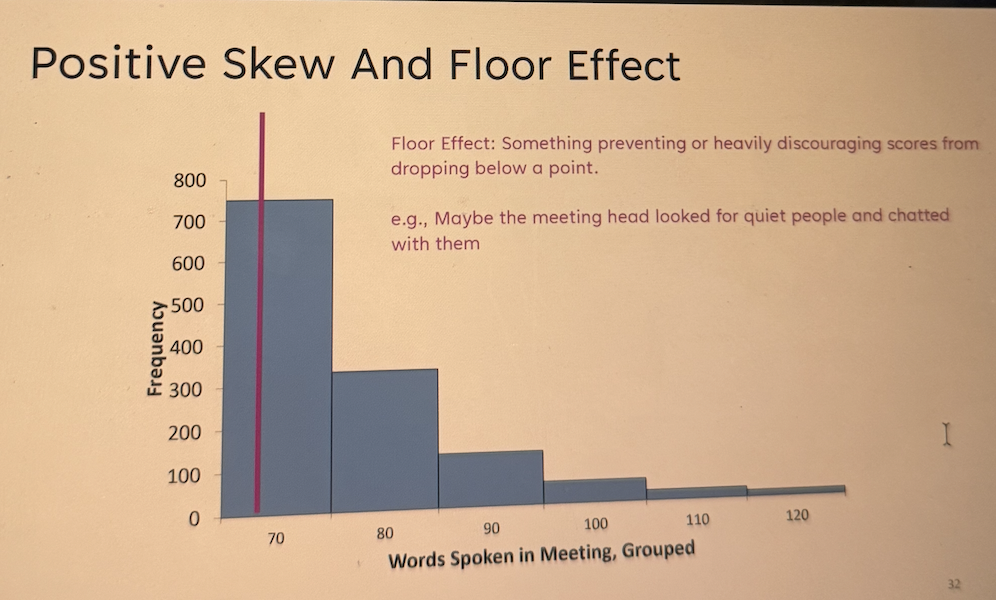
Positive skew
Floor effect: something preventing or heavily discouraging scores from dropping below a point
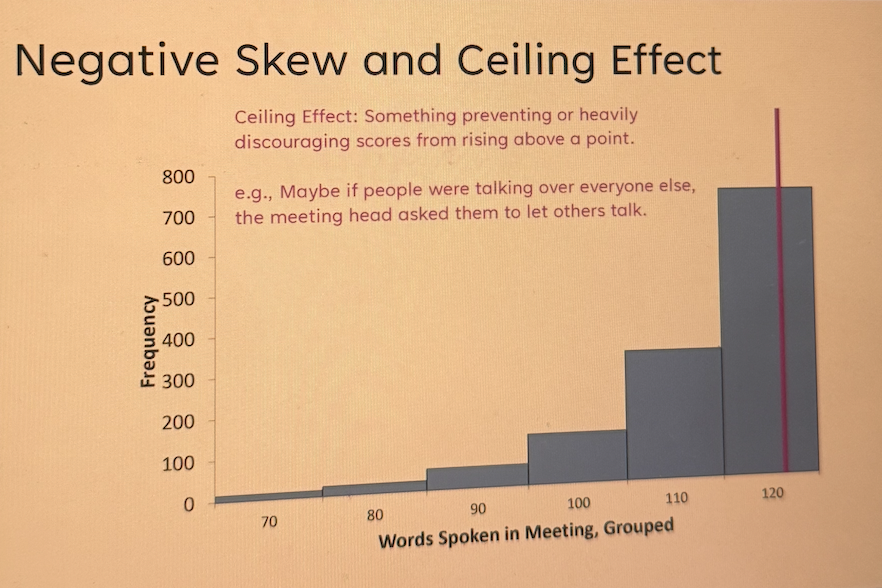
Negative skew
Ceiling effect: something preventing or heavily discouraging scores from rising above a point
Pareto chart
same as bar graph but numbers are ordered or bar height from lowest to highest
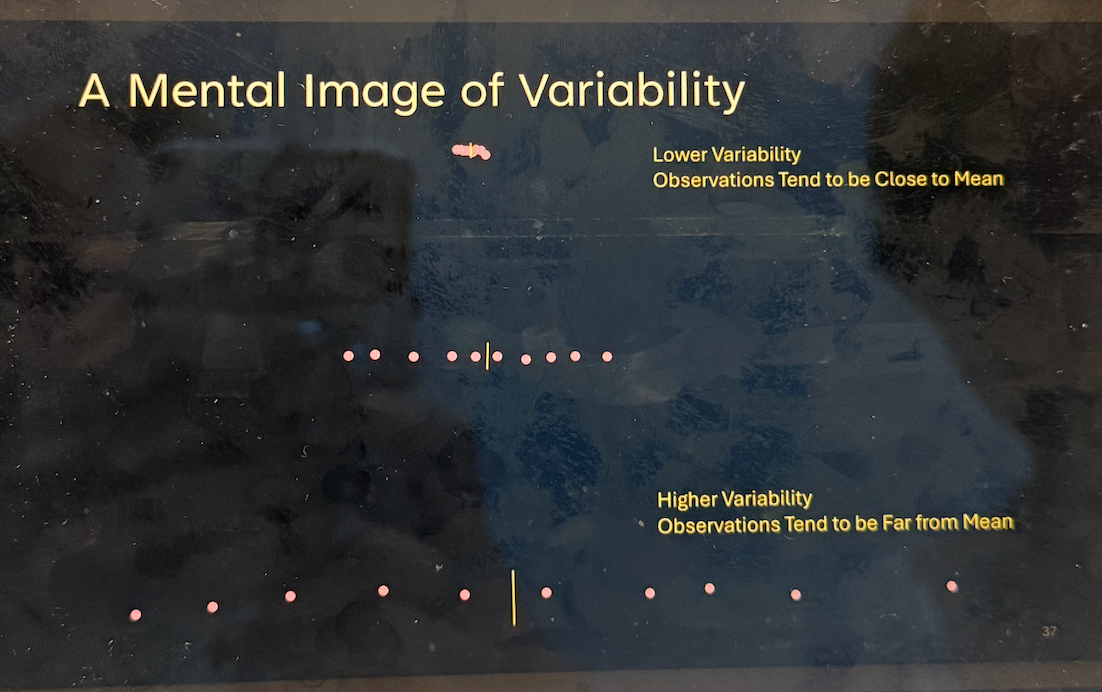
Variability
a numerical way of describing how widely spread out the observations are in a distribution
4 ways of calculating it: variance, standard deviation, range, interquartile range
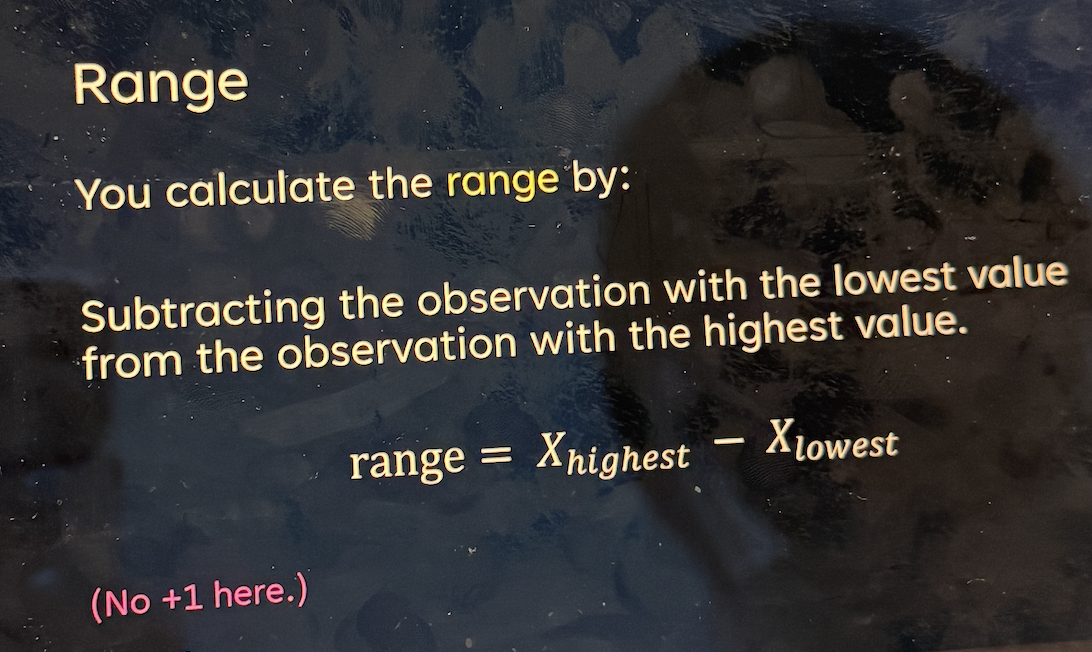
Range
limitations: can’t tell you how spread out the data is beyond the highest and lowest values.
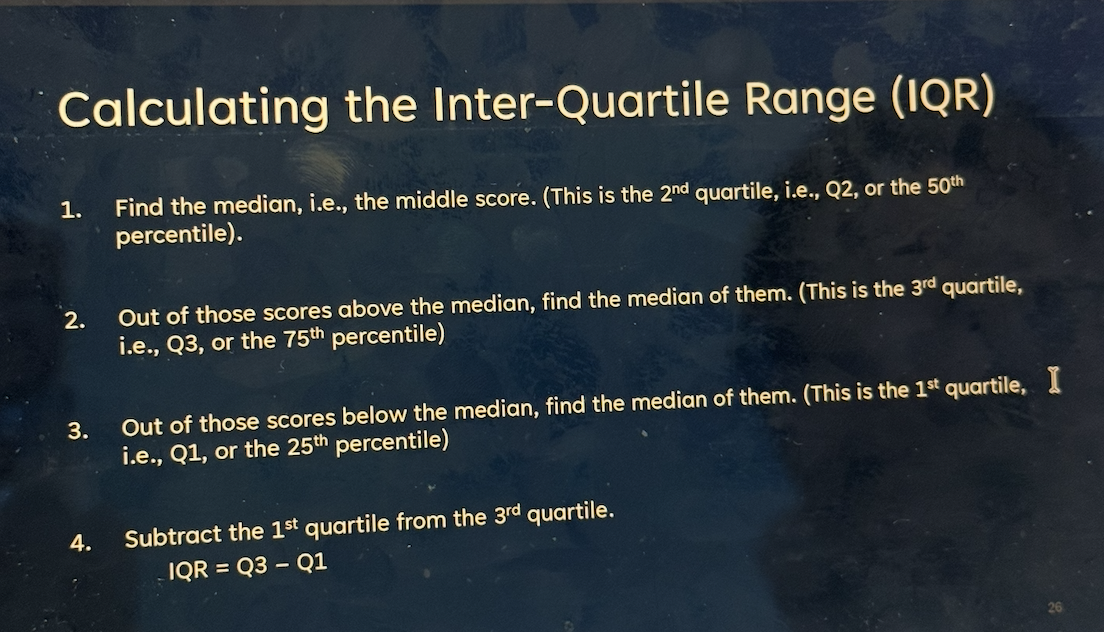
Inter-quartile range
the distance between the first and third quartiles
i.e. the middle 50% of observations
find the median to get Q2
find median between Q2 median and last number to get Q3
find median between first set of number up until Q2 to find Q1
(always include Q2 when crossing out)
formula: IQR = Q3 - Q1
Box plots
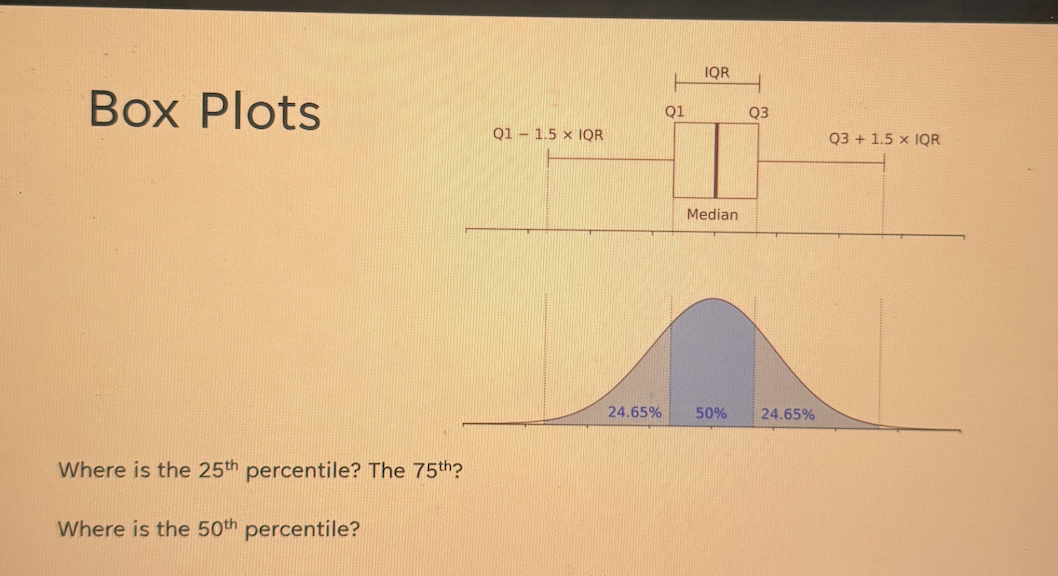
visualization of the mean, 3rd quartile, 1st quartile, and range (outliers if any)
Variance
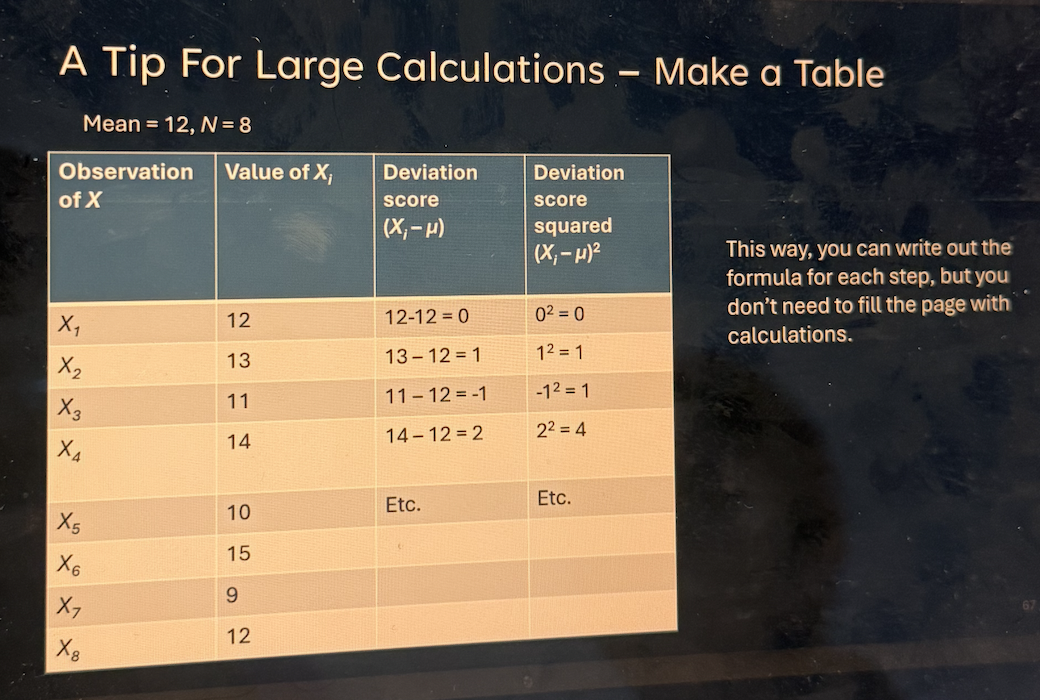
variance and sd must be 0 or positive
can be bigger than range

Standard deviation
cant be bigger than range
doesn’t get affected by adding a number to every observation (same for variance)

normal distributions
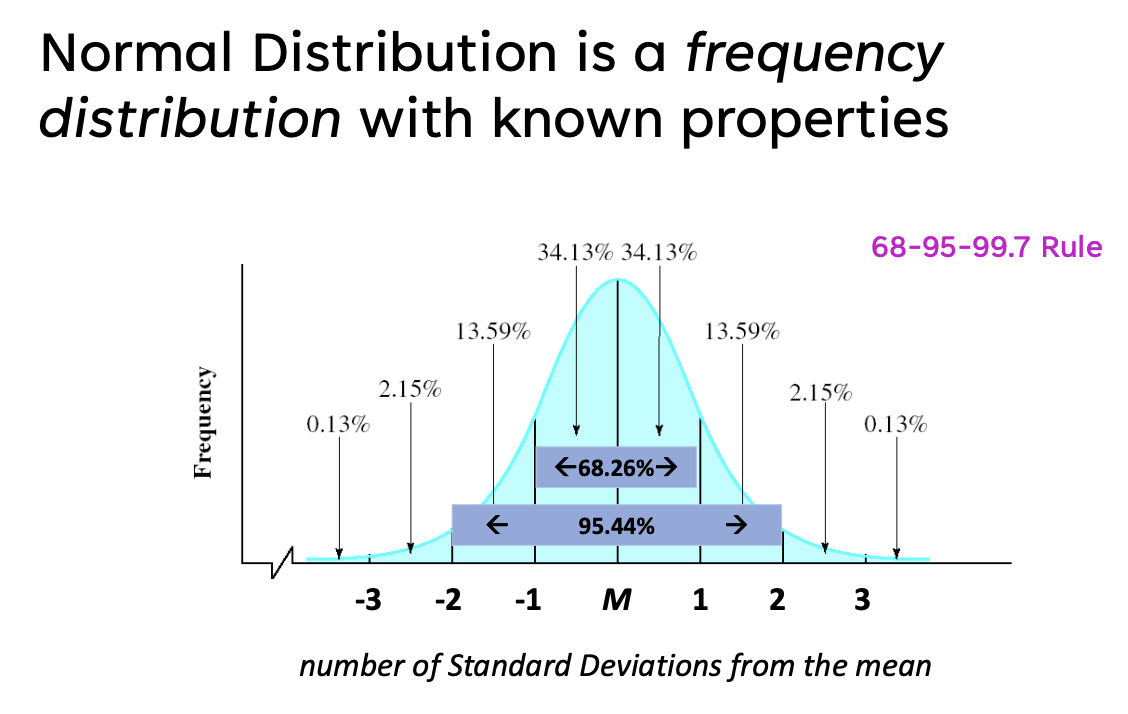
bell curve, symmetrical, unimodal
random sampling
the process of selecting a subset of individuals from a population, ensuring that every individual has an equal chance of being chosen. its practically impossible because we can’t force people to participate at random or who’s willing to join the study; best way is random number generator; not based on characteristic of a person
convenience sampling
procedure that uses participants who are available at easiest convenience. problem is that it may not accurately represent the population
volunteer sampling
people who actively volunteer themselves; could introduce extreme bias in the direction of results; might have extreme opinions
personal probability
persons feeling of what the likelihood of an outcome is; not what this class does
expected-relative frequency probability
relevant to this class; the likelihood of an event occuring based on the actual outcome of many trials
trial
each occasion that a given procedure is carried out e.g. how many coin flips
outcome
the result e.g. heads or tails
success
is it the outcome that we chose e.g. how many heads did we get
law of large numbers
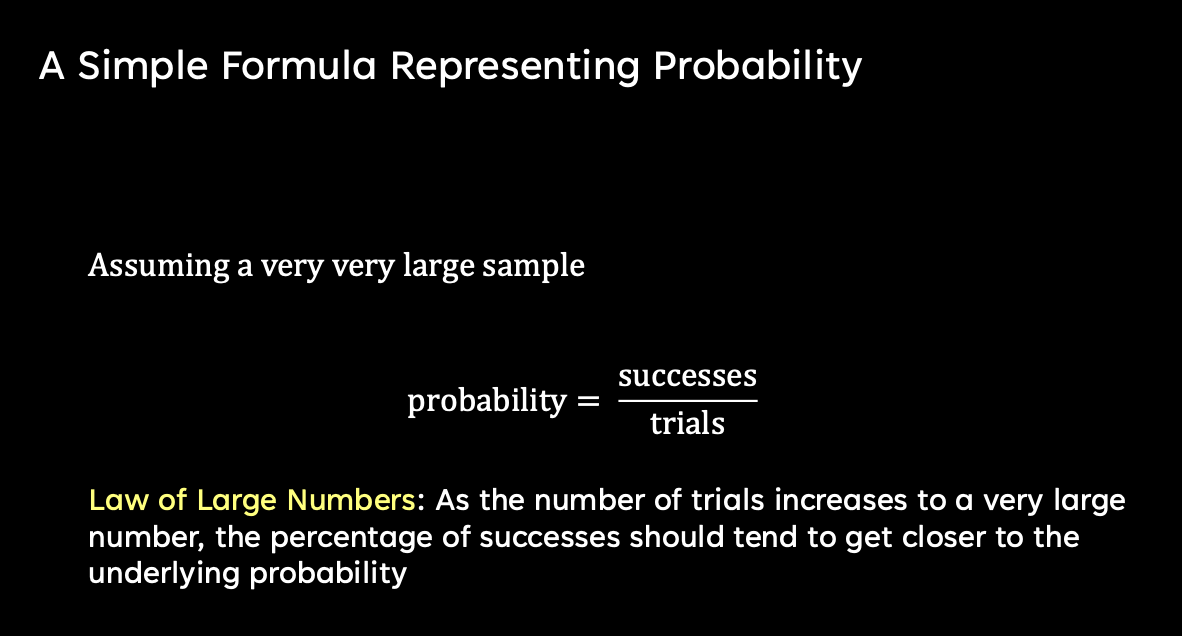
as the number of trials increases to a very large number, the percentage of successes should tend to get closer to the underlying probability
probability formula
research hypothesis
hypothesis that follows your theory and predicts the expected outcome. e.g. people given encouragement will have more positive mood
null hypothesis
this is the negation of the research hypothesis and states that there is no effect or difference. e.g. people given encouragement will not have a more positive mood e.g. often uses “not” or “does not” or “not true that”
null hypothesis significance testing
A statistical method for determining whether to reject the null hypothesis. It assesses if observed data significantly differ from what would be expected under the null hypothesis
if you assume null hypothesis is true and data is distributed in a way that is highly improbable …
you should reject it and therefore the research hypothesis is retained NOT proven
if you assume the null is true, and the data is distributed in a way that is NOT highly improbable …
retain null hypothesis and reject research hypothesis ; no effect because data supports that the null hypothesis is true
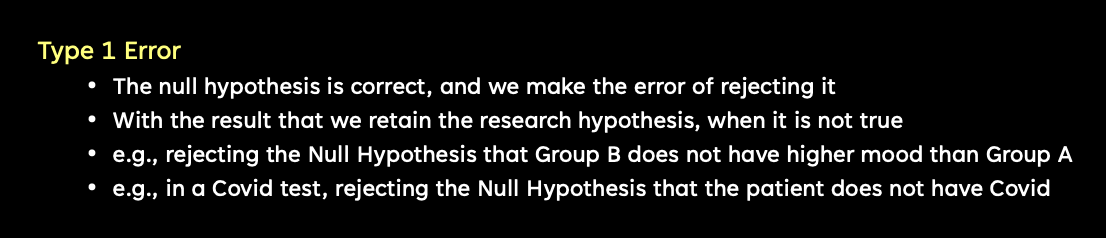
type 1 errors
are false positives, occurring when the null hypothesis is incorrectly rejected when there is no effect ; type 1 = not pregnant flat belly but you tell them that they are preg. example: criminal convictions so if someone is put in jail when they are actually innocent
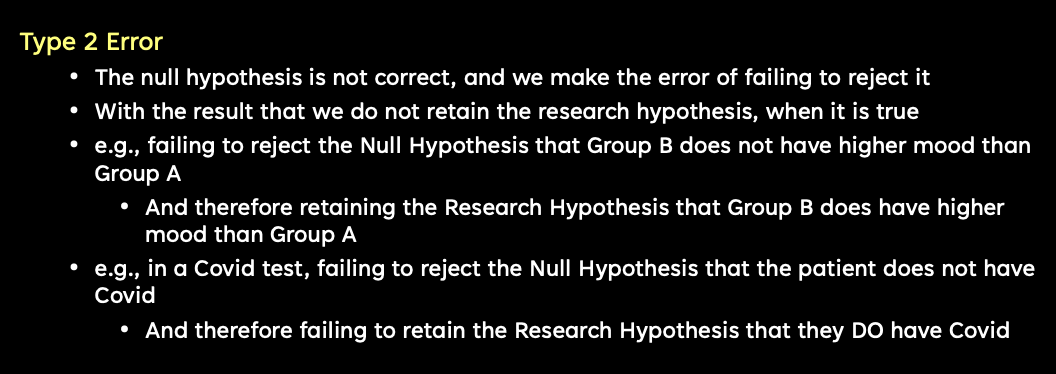
type 2 errors
are false negatives, occurring when the null hypothesis is retained and there is an effect. type 2 = they are preg because big belly and you tell them they aren’t preg. example: fire alarm if there is a fire and the alarm doesn’t go off orrrrr covid tests being if a doctor gives a false negative when the person actually has covid
percentile
indicates the value at and below where a given percentage of observations fall. For example, the 50th percentile is the median, meaning that 50% of the data points are below this value.
why do we want to know the area under the curve
1) compare raw score to a distribution of other raw scores (compare across units) ; uses z score
2) compare ones sample mean score to other sample mean scores (also can compare across units) ; uses z statistic
z score
is a statistic that indicates how many standard deviations a data point is from the mean. It standardizes scores across different distributions, allowing for comparisons.
how much away from the mean: is it higher or lower// how many standard deviations
1 SD means the exact same thing as +1 z score
-1 SD is the same thing as above -1 z score
why is the z score so useful?
1) mean of a distribution of z scores is always zero
2) the standard deviation of a distribution of z scores is always 1
3) skewness is retained and mostly bell shaped distributions
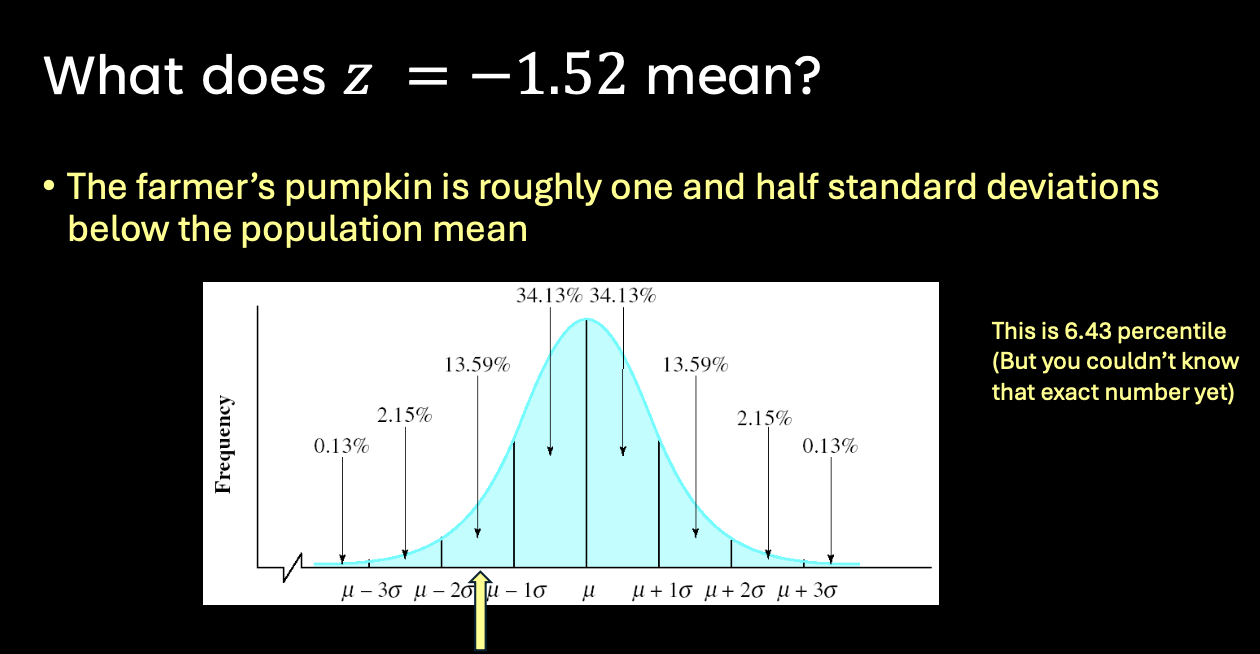
4) always say for example if they ask to explain so whatever x is say “farmers pumpkin (x) is one standard deviations below the population mean (-1)”
what does z = -1.52 mean
central limit theorem
-a distribution of sample means will tend to be normally distributed, regardless of the shape of the population distribution, given a sufficiently large sample size. (at least 30)
-enables us to use the normal distribution to model any distribution of sample means
raw score distribution vs “distribution of means”
-for raw score distribution you are just looking at the raw score or 1 sample
-for distribution of means you are looking at the mean or average of multiple people (samples)
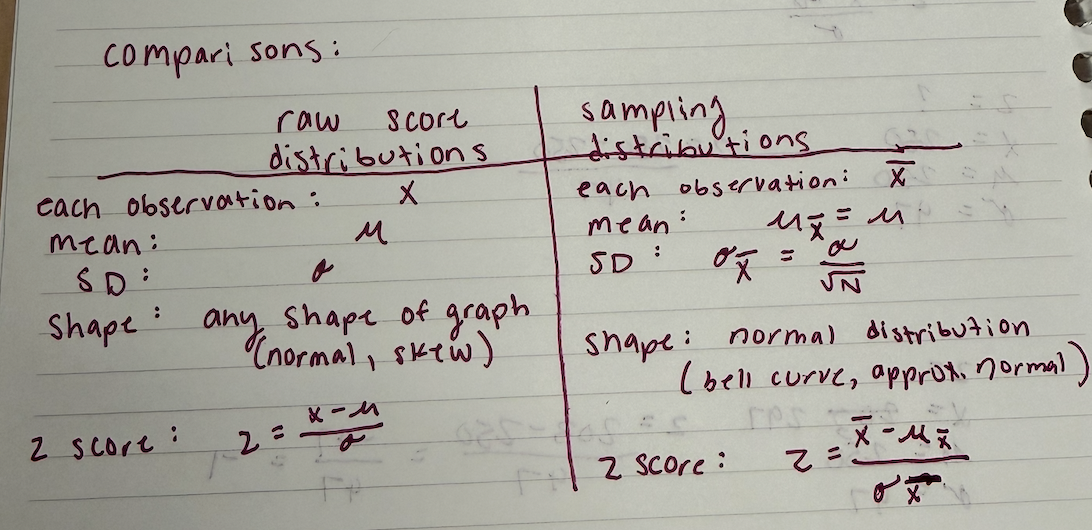
distribution of means
sampling distributions of the sample mean
standard error of mean and z statistic
this is a measure of variability of a distribution of means
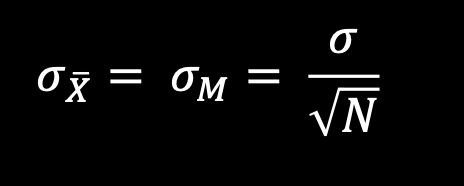
z score formula vs z statistic (below is just z score formula)
