Business cycle
1/11
There's no tags or description
Looks like no tags are added yet.
Name | Mastery | Learn | Test | Matching | Spaced |
|---|
No study sessions yet.
12 Terms
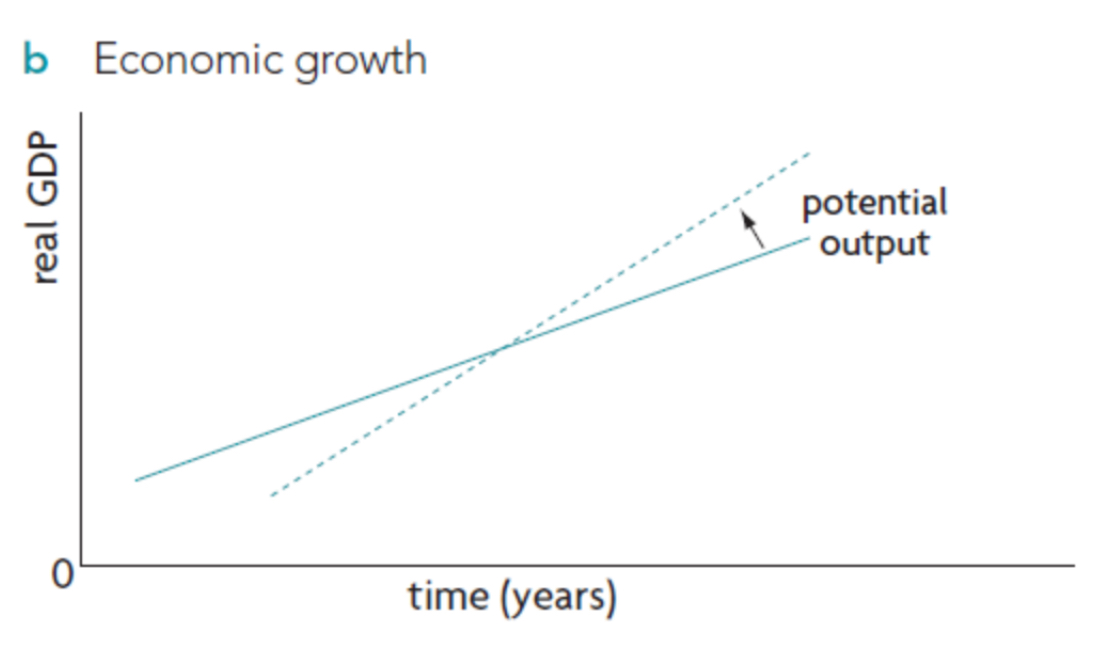
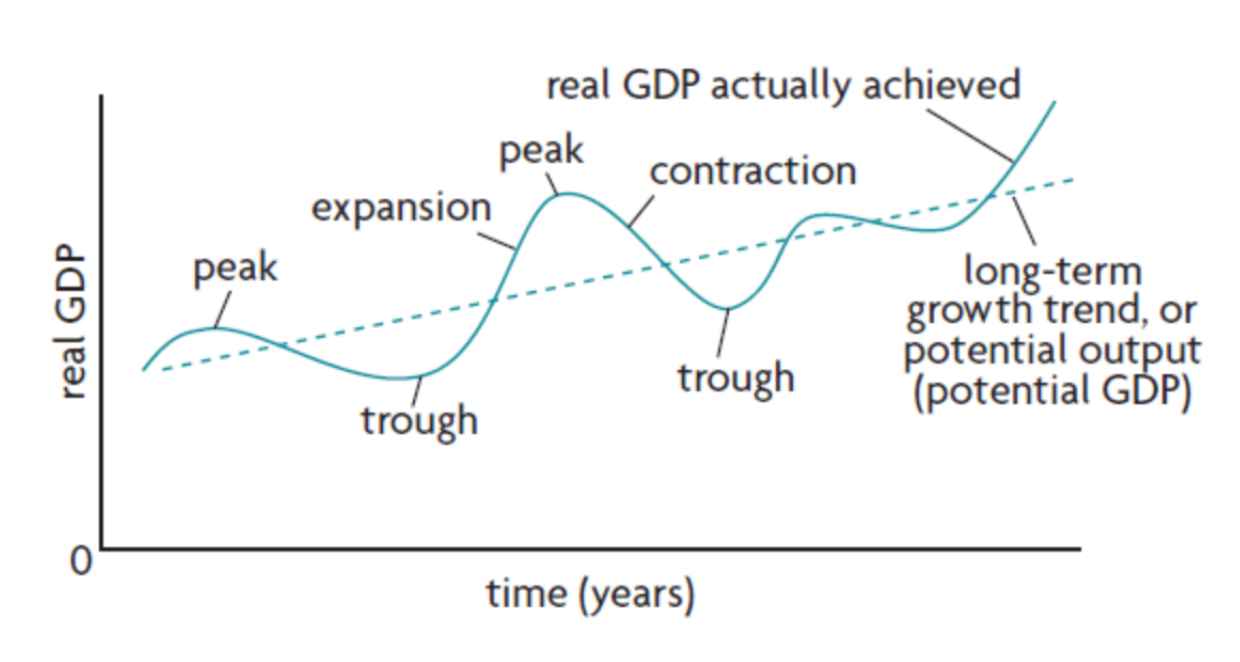
What does the linear line show
Long term growth trend, or potential output (potential GDP). Shows full employment
What does the cyclical line show
Actual output
What is expansion
Follows trough. Where there is positive growth in rGDP, shown by upward sloping parts of the cyclical curve
Employment increase, general price level of economy rise (inflation)
What is peak
maximum rGDP of a cycle. economy most likely experiencing inflation
What is contraction
Follows peak. Where there is negative growth in rGDP, shown by downward sloping parts of the cyclical curve
Employment decrease, increase of price level slows and might fall in some sectors
What is trough
minimum rGDP of a cycle. Widespread unemployment. End of a cycle
What defines a recession
When a contraction lasts more than 2 quarters (6 months)
Characterised by falling rGDP and growing unemployment.
Draw and label business cycle
Define full employment
Operating with natural rate of unemployment. Determined by position of LRAS
Output gap
Actual GDP - Potential GDP
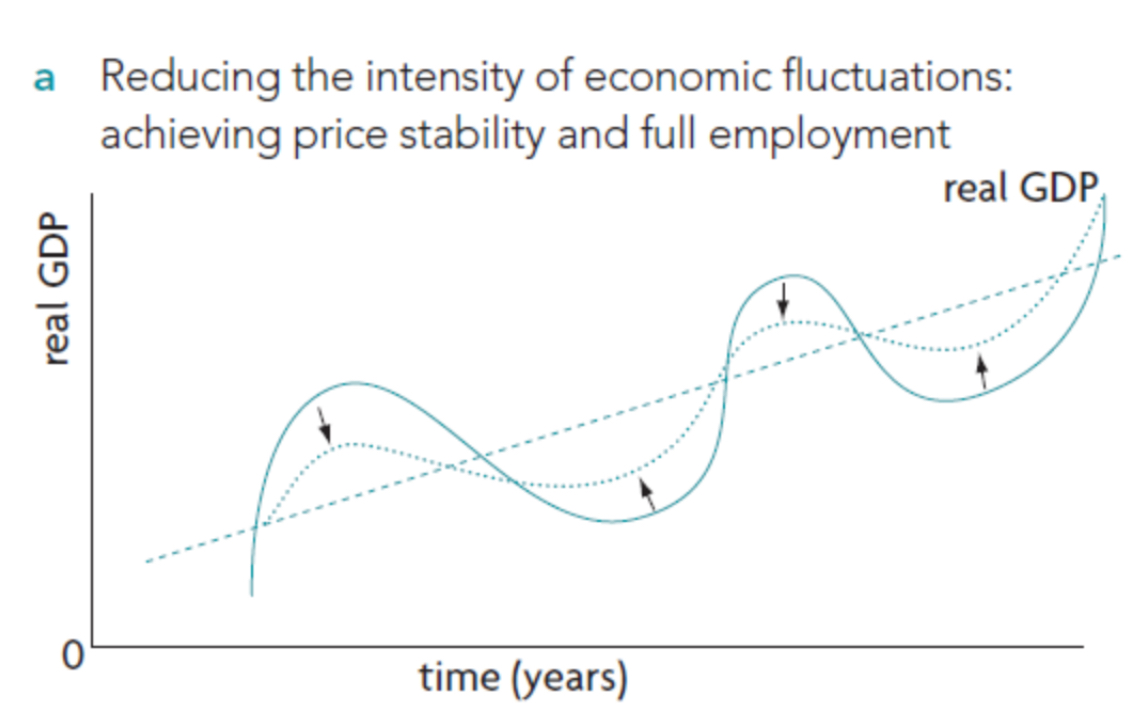
Draw and label achievement of price stability on the business cycle
Draw and label economic growth on the business cycle