BIO3 - Exam revision
5.0(1)
Studied by 30 peopleCard Sorting
1/69
Last updated 10:57 PM on 11/15/22
Name | Mastery | Learn | Test | Matching | Spaced | Call with Kai |
|---|
No analytics yet
Send a link to your students to track their progress
70 Terms
1
New cards
Estimating total populations - formula
Total number = (number counted x total area)/ area sampled
2
New cards
Estimating population density - formula
Density = Total number counted/Area sampled
(no. area-n)
(no. area-n)
3
New cards
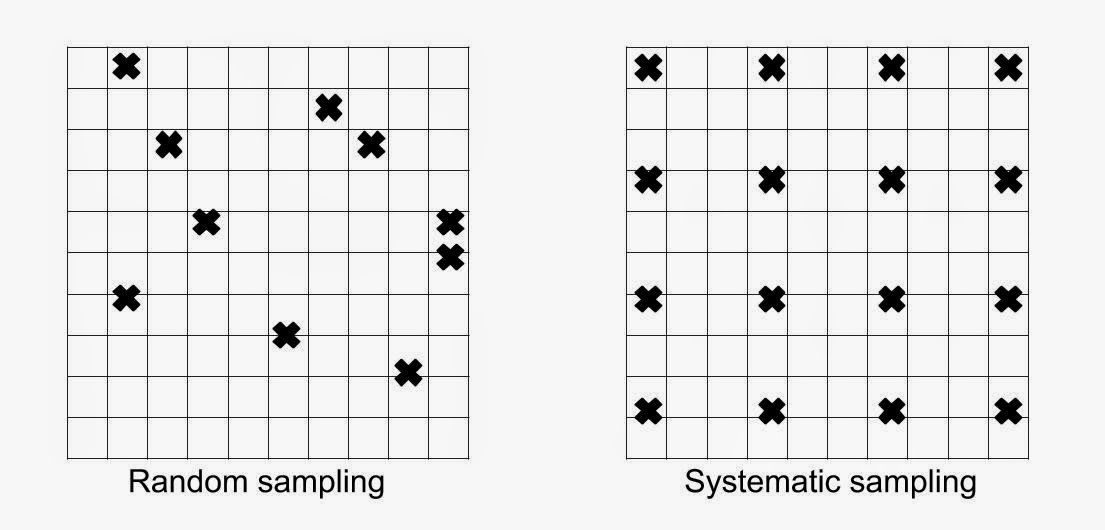
Quadrat sampling
is a method by which organisms in a certain proportion (sample) of the habitat are counted directly.
4
New cards
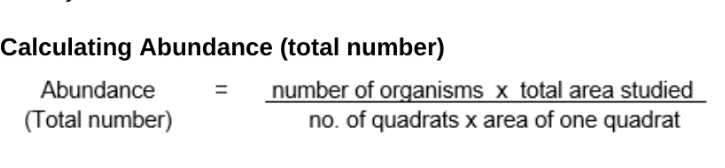
Calculating Abundance (total number) - formula
5
New cards
Calculating Estimated Average Density - formula
6
New cards
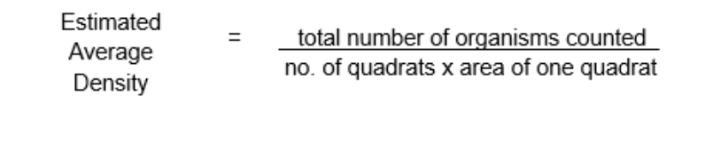
What are the three types of transect sampling?
- Point sampling
- Continuous belt transect
- Interrupted belt transect
- Continuous belt transect
- Interrupted belt transect
7
New cards
Zonation
changes in community composition along
an environmental gradient.
an environmental gradient.
8
New cards
Pros/Cons of transect sampling
(Recognition)
(Recognition)
Advantages
Good for showing zonation
Disadvantages
Low density organisms may not be sampled
Larger organisms have a greater chance of
being sampled by a line transect
Good for showing zonation
Disadvantages
Low density organisms may not be sampled
Larger organisms have a greater chance of
being sampled by a line transect
9
New cards
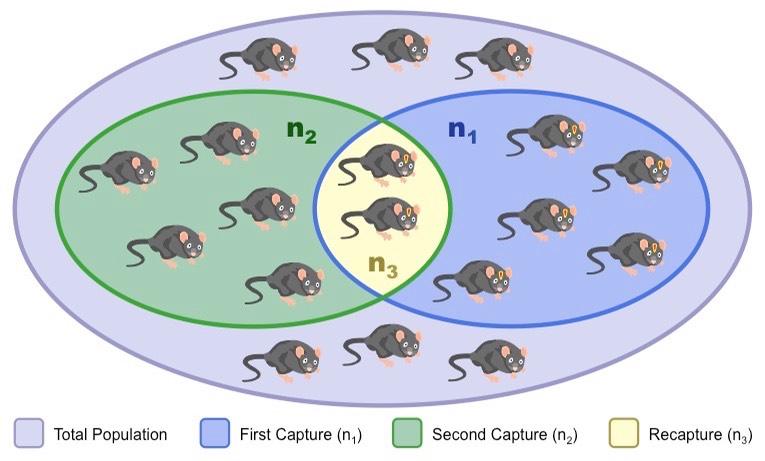
Capture Recapture method
Used for counting organisms that move, or
for monitoring populations over time.
A sample of organisms are captured,
marked and released. At a later point in
time, another sample is captured, and the
number of marked organisms in the
second sample is counted and recorded.
for monitoring populations over time.
A sample of organisms are captured,
marked and released. At a later point in
time, another sample is captured, and the
number of marked organisms in the
second sample is counted and recorded.
10
New cards
Capture recapture cons (Recognitions)
Accuracy depends on capturing a fairly large proportion of the population. ...
Many study populations are not geographically closed because only a part of a population's range is included in the study area.
Many study populations are not geographically closed because only a part of a population's range is included in the study area.
11
New cards
Lincoln index
Total population = (# of marked in 1st sample X total # in 2nd sample)/# of marked in 2nd sample
or
N = (n1 x n2)/n3
or
N = (n1 x n2)/n3
12
New cards
Indirect sampling - Advantages and disadvantage
(Recognition
(Recognition
Trails, droppings, burrows etc
Camera traps
Advantages
Good for individuals that are difficult to physically
count
Doesn’t harm organism
Disadvantages
You have to know a relatively large amount of
background information. E.g. how many individuals
per burrow
Less accurate
Camera traps
Advantages
Good for individuals that are difficult to physically
count
Doesn’t harm organism
Disadvantages
You have to know a relatively large amount of
background information. E.g. how many individuals
per burrow
Less accurate
13
New cards
Species richness
is a measure of the number
of different species found in a sample.
of different species found in a sample.
14
New cards
Species evenness
a measure of the relative
abundance of the different species making
up the richness of an area.
abundance of the different species making
up the richness of an area.
15
New cards
Species diversity
takes into account both the numbers
of species present and the dominance or
evenness of species in relation to one another.
of species present and the dominance or
evenness of species in relation to one another.
16
New cards
Diversity Index - Simpson's diversity index - formula
A diversity index is a measure of the number
of different organisms in an ecosystem.
DI = (N(N-1))/(Σn(n-1))
DI=Diversity Index
N=total number of individuals from all species
n=number of individuals of each species
of different organisms in an ecosystem.
DI = (N(N-1))/(Σn(n-1))
DI=Diversity Index
N=total number of individuals from all species
n=number of individuals of each species
17
New cards
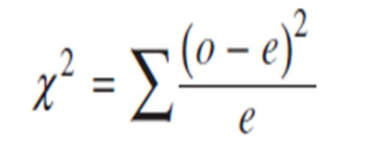
Chi squared analysis - formula
X2 = is the Chi value
∑ = sum
o = observed value
e = expected value
∑ = sum
o = observed value
e = expected value
18
New cards
Degrees of freedom - formula
DF = (Column - 1)(Row - 1)
19
New cards
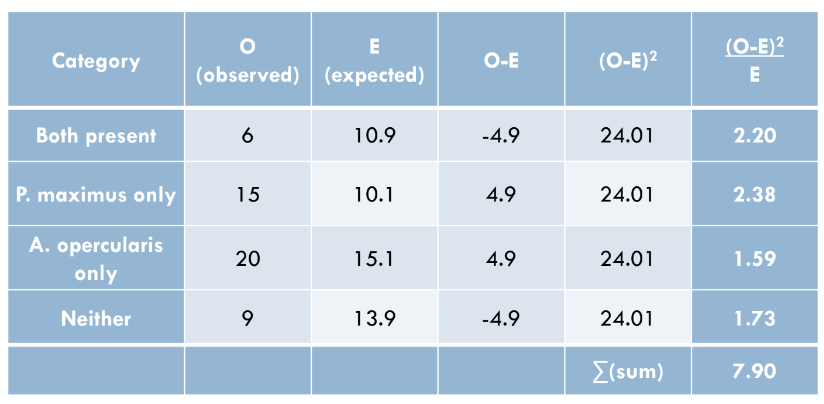
Testing for independence/ Association - method
1) Determine null hypothesis
2) Enter observed results in a contingency table
3) Calculate the expected values
For each category divide the row total by the
grand total and multiply by the column total.
4) Calculate Chi-value
5) Calculate the degrees of freedom and look
up the chi-value on a probability table, and accept
or reject the null hypothesis.
20
New cards
Population
the number of inhabitants in a given place
21
New cards
Community
All populations of different species living in an
area
area
22
New cards
Ecosystem
All of the biotic (living) and abiotic (non-living)
factors in an area.
factors in an area.
23
New cards
Population distribution + Abundance
Density - number/area or number/volume
Distribution - location within area
Size/abundance - total number of
individuals
Distribution - location within area
Size/abundance - total number of
individuals
24
New cards
Name and describe the 3 types of distribution
[Random distribution]
The spacing between individuals is irregular. The
presence of one individual does not directly affect the
location of any other individual. Commonly seen in
plants.
[Clumped distribution]
Individuals are grouped together in certain areas, often
around a resource. e.g. a waterhole.
Also when living in large groups is beneficial.
[Uniform distribution] individuals are evenly and
regularly spaced in an area.
![[Random distribution]
The spacing between individuals is irregular. The
presence of one individual does not directly affect the
location of any other individual. Commonly seen in
plants.
[Clumped distribution]
Individuals are grouped together in certain areas, often
around a resource. e.g. a waterhole.
Also when living in large groups is beneficial.
[Uniform distribution] individuals are evenly and
regularly spaced in an area.](https://knowt-user-attachments.s3.amazonaws.com/a9a7d34cbe4840c7b4337a4e72eaee17.jpeg)
25
New cards
Explain what population density tells us about the species
Low density - only a few individuals per
unit area. Often highly territorial, solitary
mammalian species such as tigers.
High density - individuals are crowded
together, many individuals per unit area.
Often colonial organisms, such as corals
or insects.
unit area. Often highly territorial, solitary
mammalian species such as tigers.
High density - individuals are crowded
together, many individuals per unit area.
Often colonial organisms, such as corals
or insects.
26
New cards
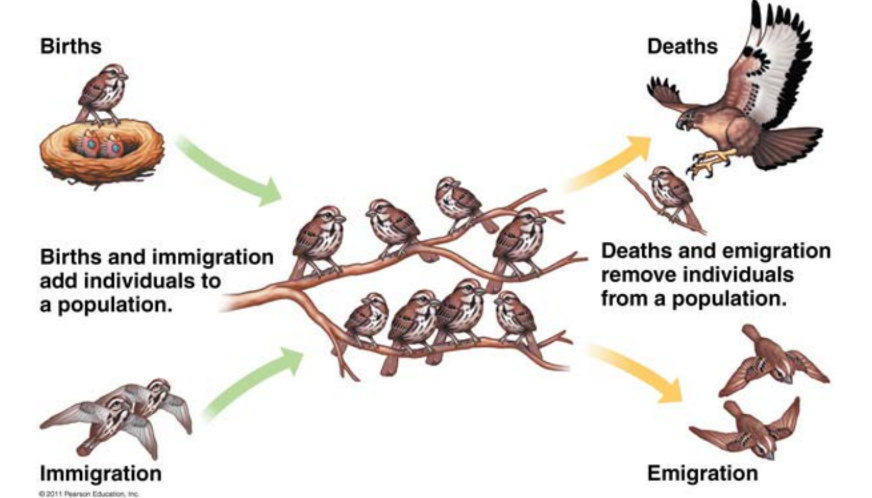
Population growth - formula
PG = (births – deaths) + (immigration – emigration)
Birth rate= births per 1000 per year
Death rate= deaths per 1000 per year
Immigration= movement of individuals into the
population
Emigration= movement of individuals out of the
population
Birth rate= births per 1000 per year
Death rate= deaths per 1000 per year
Immigration= movement of individuals into the
population
Emigration= movement of individuals out of the
population
27
New cards
Population composition
- Sex Ratios: Ratio between male and female
- Population fertility: Reproductive capacity
- Age structure: Number of organisms of different ages
- Population fertility: Reproductive capacity
- Age structure: Number of organisms of different ages
28
New cards
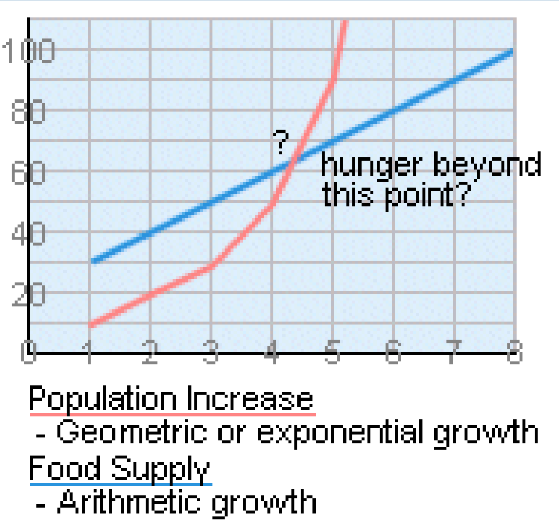
Malthus’s Theory of Population Growth
(recognition)
(recognition)
Populations increase exponentially, while food
production increases arithmetically.
Hence population growth easily outstrips
resource production.
Thus, populations increase quickly, until
competition for resources occur and the
carrying capacity is reached.
production increases arithmetically.
Hence population growth easily outstrips
resource production.
Thus, populations increase quickly, until
competition for resources occur and the
carrying capacity is reached.
29
New cards
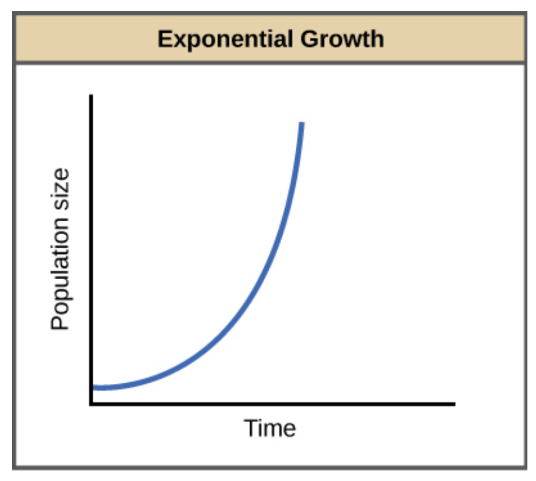
Exponential growth
J- Shaped curve of population growth
30
New cards
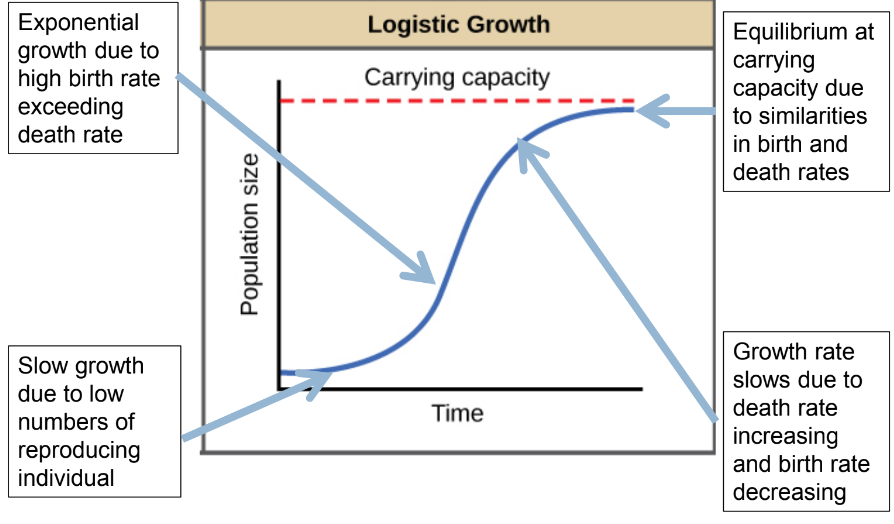
Logistic growth
S - Shaped curve of population growth
31
New cards
Carrying capacity (K)
The carrying capacity is the maximum
number of individuals an area can
support on a sustained basis given the
prevailing resources.
number of individuals an area can
support on a sustained basis given the
prevailing resources.
32
New cards
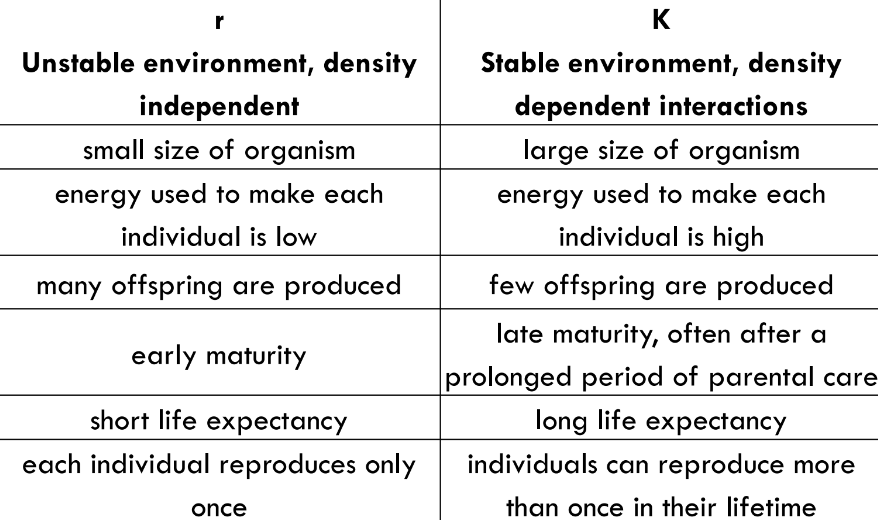
r and K selection
Many organisms fall under two main
reproductive strategies, r strategists or K
strategists.
- r strategists often follow a J-shaped
growth curve
- K strategists often follow a S-shaped
growth curve
reproductive strategies, r strategists or K
strategists.
- r strategists often follow a J-shaped
growth curve
- K strategists often follow a S-shaped
growth curve
33
New cards
Density independent factors
Abiotic factors:
- Rainfall
- Temperature
- Salinity
- Terrain
- Natural disasters etc
- Rainfall
- Temperature
- Salinity
- Terrain
- Natural disasters etc
34
New cards
Density dependent factors
Biotic factors:
Food supply
Parasites
Disease
Competition
Predation
Food supply
Parasites
Disease
Competition
Predation
35
New cards
Nutrient cycling
a system where energy and matter are transferred between living organisms and non-living parts of the environment.
36
New cards
Role of each in nutrient cycling:
- Bacteria
- Fungi
- Plants
- Animals
- Bacteria
- Fungi
- Plants
- Animals
- Bacteria: Act as decomposers and convert nutrients into forms that can be used by plants and animals
- Fungi: Saprophytes and decompose nutrients into forms accessible by plants and animals
- Plants: Absorb nutrients from the soil to make them available for animals and contribute their decaying matter to solids. Additionally, plants can also consume nutrients via cellular respiration.
- Animals: Consume and break down materials from plants, bacteria and fungi and return the nutrients after they die
37
New cards
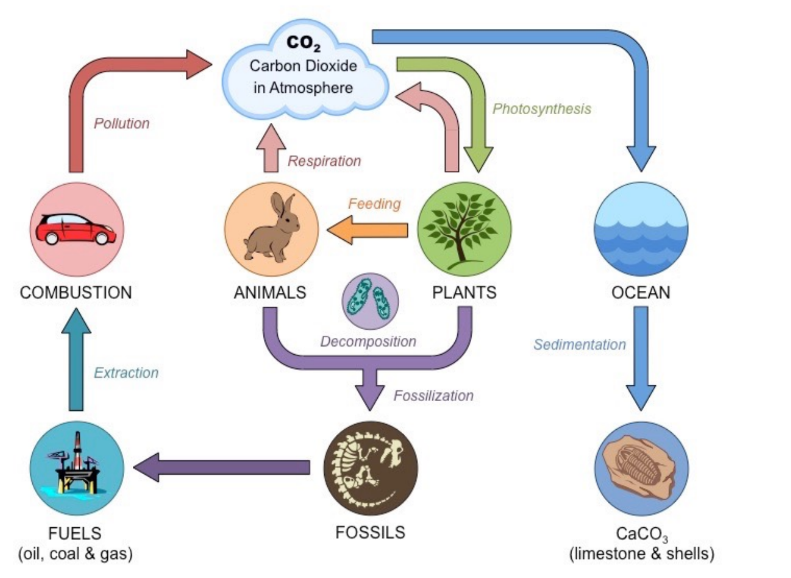
The carbon cycle
cycling of carbon in an ecosystem
38
New cards
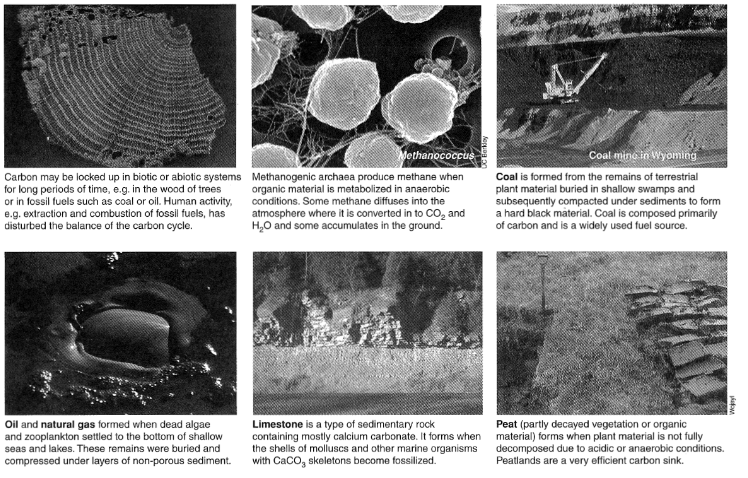
Methanogens
Methanogenic bacteria (archaeans) release
carbon in the form of methane (CH4).
This process usually occurs in anaerobic conditions
such as swamps and bogs and can cause dead
organic matter to not be fully decomposed by
saprotrophs.
It can also occur in the digestive bacteria of
ruminant mammals.
Methane is usually taken up by methane sinks such
as soil or can be oxidised to CO2 in the
atmosphere
39
New cards
Sink
Storage unit for large quantities of carbon ie the atmosphere/ the ocean
40
New cards
What affects the speed of nutrient cycling?
- Environment (ie forest disturbances by rainfall/ weather patterns)
- Ecosystem - Competition for resources, community interactions etc
- Ecosystem - Competition for resources, community interactions etc
41
New cards
Name the processes that release carbon into the atmosphere
- Combustion
- Oxidation
- Respiration
- Decomposition
- Oxidation
- Respiration
- Decomposition
42
New cards
Name the processes that absorb carbon into sinks
- Photosynthesis
- Fossilisation
- Sedimentation
- Dissolving (of CO2 into the ocean)
- Fossilisation
- Sedimentation
- Dissolving (of CO2 into the ocean)
43
New cards
Describe the biological origin of:
- Coal
- Oil and natural gas
- Limestone
- Peat
- Coal
- Oil and natural gas
- Limestone
- Peat
Due to acidic and anaerobic conditions in some wetlands/swamps, saprotrophs are unable to fully break down organic matter so overtime it forms thick deposits called peat. Layers on top of the peat plus time, pressure and heat and it forms coal.
Silt, sediment and organic matter can be deposited in shallow seas but again, the anaerobic conditions can prevent the organic matter from being fully decomposed.
The silt converts to rock and organic matter forms coal, oil or gas deposits
Silt, sediment and organic matter can be deposited in shallow seas but again, the anaerobic conditions can prevent the organic matter from being fully decomposed.
The silt converts to rock and organic matter forms coal, oil or gas deposits
44
New cards
Carbon flux
describe the rate of exchange
of carbon between the various carbon sinks /
reservoirs.
of carbon between the various carbon sinks /
reservoirs.
45
New cards
How is carbon stored? (name 4 sinks)
Atmosphere: Atmosphere - Carbon dioxide
Hydrosphere: Ocean - Carbonate and bicarbonate
Lithosphere: earths crust - Rocks and limestone
Biosphere: organisms - methane or hydrocarbons
Hydrosphere: Ocean - Carbonate and bicarbonate
Lithosphere: earths crust - Rocks and limestone
Biosphere: organisms - methane or hydrocarbons
46
New cards
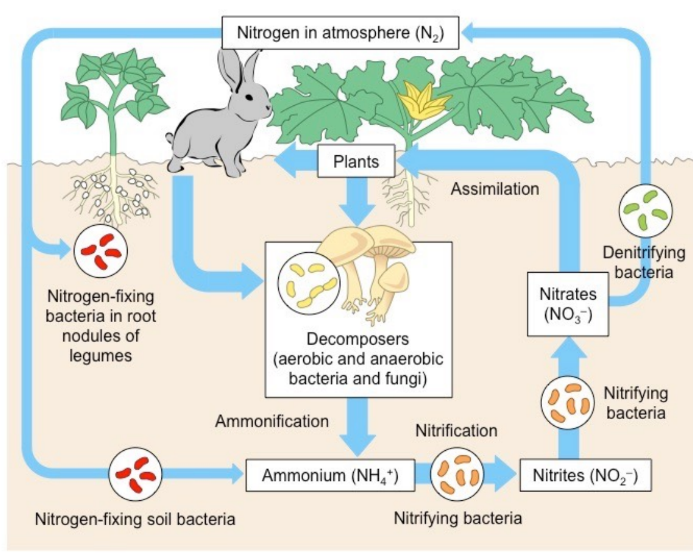
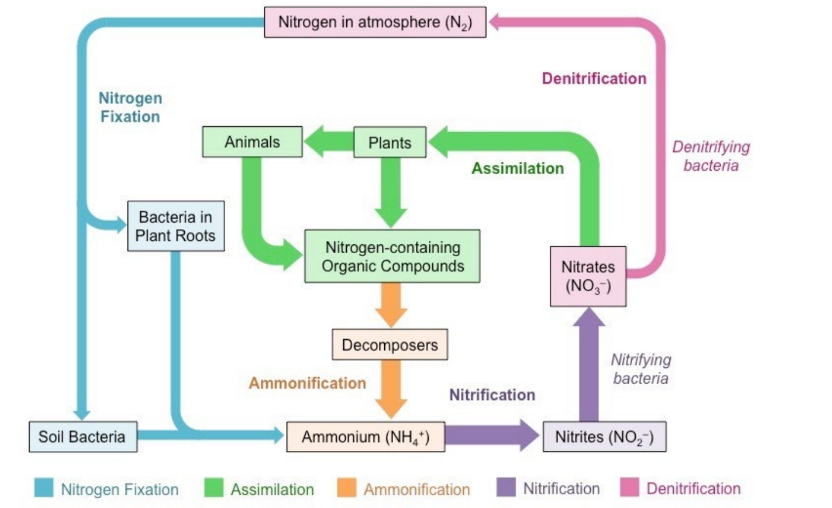
The nitrogen cycle
47
New cards
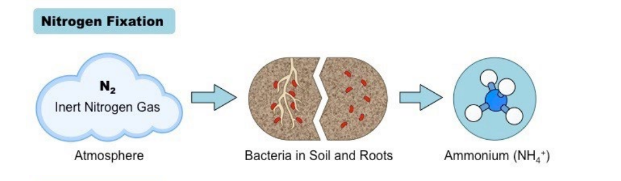
Nitrogen fixation
48
New cards
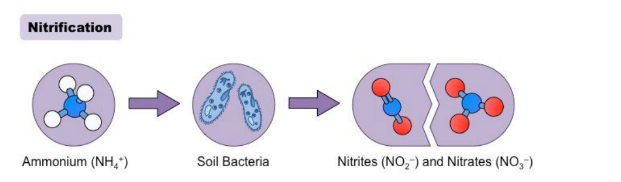
Nitrification
Nitrification is the conversion of ammonia to
nitrate.
Two types of soil bacteria are involved:
Nitrosomonas convert ammonia to nitrite (NO2-)
Nitrobacter convert nitrite to nitrate (NO3)
nitrate.
Two types of soil bacteria are involved:
Nitrosomonas convert ammonia to nitrite (NO2-)
Nitrobacter convert nitrite to nitrate (NO3)
49
New cards
Denitrification
Denitrification is the conversion of nitrate into
nitrogen.
This process only occurs in the absence of
oxygen in the soil by denitrifying bacteria
(Pseudomonas).
nitrogen.
This process only occurs in the absence of
oxygen in the soil by denitrifying bacteria
(Pseudomonas).
50
New cards
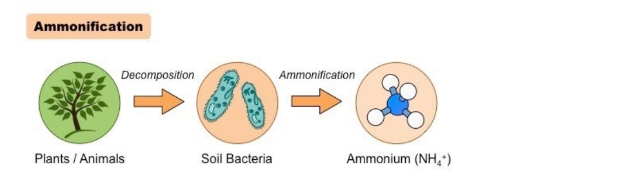
Ammonification
51
New cards
The nitrogen cycle - processes involved
52
New cards
4 Groups of bacteria involved in the nitrogen cycle and their function
Rhizobium - nitrogen fixation, fix nitrogen (N2) as ammonium (NH4)
Nitrosomonas - nitrification, convert ammonium (NH4) to nitrite (NO2-)
Nitrobacter - nitrification, convert nitrite (NO2-) to nitrate (NO3-)
Pseudomonas - denitrification, convert nitrate (NO3-) back to nitrogen (N2)
Nitrosomonas - nitrification, convert ammonium (NH4) to nitrite (NO2-)
Nitrobacter - nitrification, convert nitrite (NO2-) to nitrate (NO3-)
Pseudomonas - denitrification, convert nitrate (NO3-) back to nitrogen (N2)
53
New cards
Sources of water pollution
- sediment
- sewage
- infectious particles
- organic compounds (oil spills)
- thermal changes
- radioactive pollution
- inorganic chemicals
- Plastic waste
- inorganic plant nutrients
- sewage
- infectious particles
- organic compounds (oil spills)
- thermal changes
- radioactive pollution
- inorganic chemicals
- Plastic waste
- inorganic plant nutrients
54
New cards
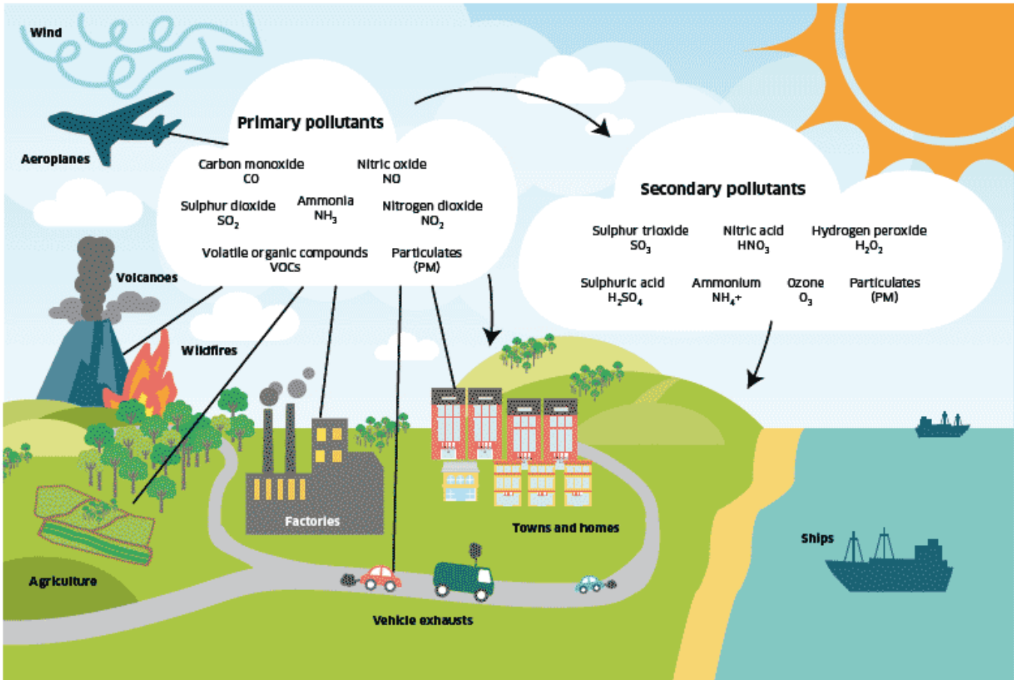
Sources of air pollution
Forest fires, volcanic activity, burning of fossil fuels, industry and vehicles all can produce air pollution.
In the presence of sunlight, the mixture of pollutants from industry and vehicles reacts to form smog (e.g. ozone, nitric acid, formaldehyde).
In the presence of sunlight, the mixture of pollutants from industry and vehicles reacts to form smog (e.g. ozone, nitric acid, formaldehyde).
55
New cards
Eutrophication
Eutrophication is the enrichment of an ecosystem (typically aquatic) with chemical nutrients (nitrates, phosphates, etc.)
The nutrients can be introduced via leaching from soil by rainfall or released as part of sewage
The nutrients can be introduced via leaching from soil by rainfall or released as part of sewage
56
New cards
Indicator species - name examples
A species whose presence, absence or abundance
reflects a specific environmental condition, habitat or
community.
Air pollution:
- Clean air: lichen and black spot fungus (roses go brr)
Water pollution:
clean water
- mussels
- mayfly
low pollution - shrimp
high pollution - water louse
very high - sludge worms and bloodworm
reflects a specific environmental condition, habitat or
community.
Air pollution:
- Clean air: lichen and black spot fungus (roses go brr)
Water pollution:
clean water
- mussels
- mayfly
low pollution - shrimp
high pollution - water louse
very high - sludge worms and bloodworm
57
New cards
EPT% +
Percent EPT is short for the total number of Ephemeroptera (mayflies), Plecoptera (stoneflies), and Trichoptera (caddisflies). Many species within these three groups are sensitive to changes in water quality.
58
New cards
Biomagnification
Biomagnification refers to a pollutants ability to increase in concentration as it moves from one trophic level to the next. It involves an increase in concentration from one link in a food chain to another due to
the relative amount each organism in the chain consumes.
the relative amount each organism in the chain consumes.
59
New cards
Bioaccumulation
Bioaccumulation refers to how pollutants enter
a food chain or food web. It involves an increase in concentration of a pollutant from the environment to the tissues of an organism. Smaller, simpler organisms towards the bottom of a food chain will often absorb these pollutants more easily.
a food chain or food web. It involves an increase in concentration of a pollutant from the environment to the tissues of an organism. Smaller, simpler organisms towards the bottom of a food chain will often absorb these pollutants more easily.
60
New cards
Ecological disturbance
Ecosystems change from disturbance
Land clearing or conversion of ecosystems for urban
development, agriculture/farming/plantations, or
industry (mining, manufacturing etc)
Dam creation (for water catchment or electricity
generation)
The introduction of introduced invasive species
Land clearing or conversion of ecosystems for urban
development, agriculture/farming/plantations, or
industry (mining, manufacturing etc)
Dam creation (for water catchment or electricity
generation)
The introduction of introduced invasive species
61
New cards
HIPPO
H - Habitat loss
I - Invasive species
P - Pollution
P - Population
O - Overuse
I - Invasive species
P - Pollution
P - Population
O - Overuse
62
New cards
Alien / invasive species
An alien species is an organism introduced
either intentionally or accidentally by humans
to an area where it does not usually occur.
either intentionally or accidentally by humans
to an area where it does not usually occur.
63
New cards
Endemic species
An endemic species naturally occurs in a
particular habitat or ecosystem.
particular habitat or ecosystem.
64
New cards
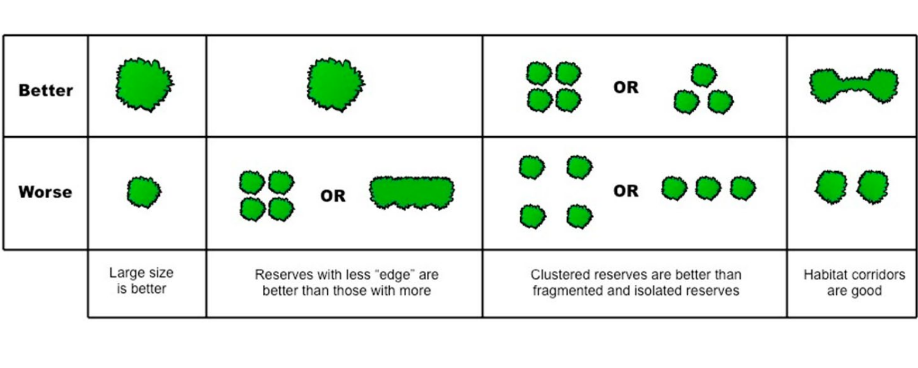
Island geography and Nature Reserves - How do we minimise damage to an ecosystem?
Large habitats are better
More resources, niches, nesting sites etc
Some migration can occur
Greater biodiversity
Corridor effect
Joining regions allows for more migration, foraging, dispersal etc
Edge effect
Boundaries are not “walls” and there is habitat disturbance
that extends into the area, particularly in forests.
If the forest is more fragmented and has more edges, more
of the area will be disturbed.
65
New cards
In situ conservation
In situ conservation involve the species
remaining in their natural habitat. Often active
management is still necessary such as:
Control of alien/invasive species
Reintroduction of natives species
Limiting predators
Feeding programs
Limiting access
remaining in their natural habitat. Often active
management is still necessary such as:
Control of alien/invasive species
Reintroduction of natives species
Limiting predators
Feeding programs
Limiting access
66
New cards
Ex situ conservation
Ex situ conservation involve the removal of species
from their natural habitat.
This can include botanic gardens, captive breeding
programs and zoos.
from their natural habitat.
This can include botanic gardens, captive breeding
programs and zoos.
67
New cards
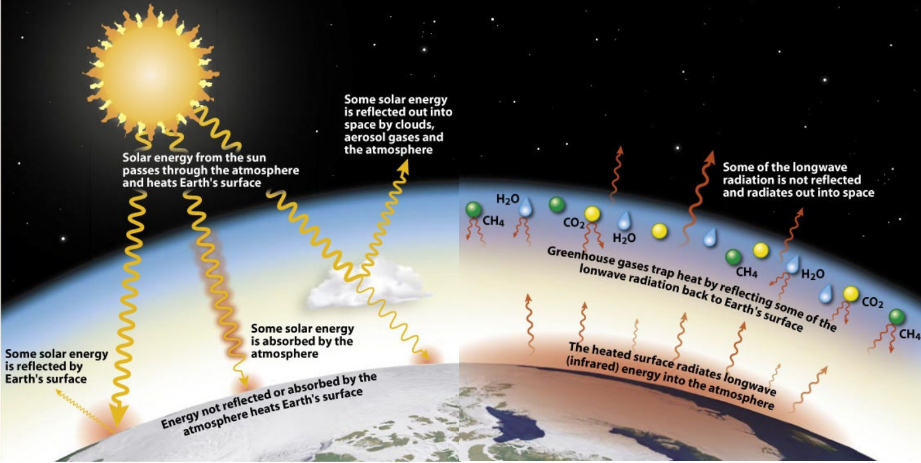
Greenhouse gas
Gases which contribute to the greenhouse
- Water vapour
- CO2
- Methane
- Fluorinated gases
- Nitrous Oxides NO2
- Water vapour
- CO2
- Methane
- Fluorinated gases
- Nitrous Oxides NO2
68
New cards
Greenhouse effect
The greenhouse effect is the way in which heat is trapped close to Earth's surface by “greenhouse gases.”
69
New cards
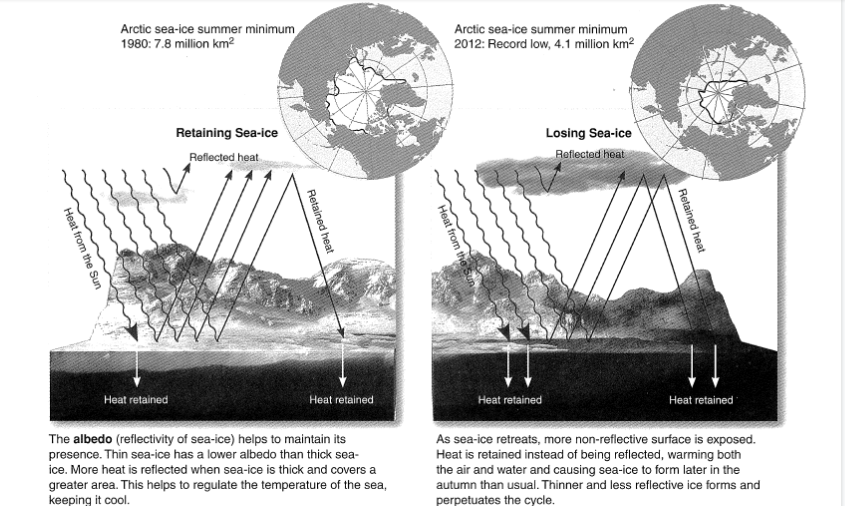
Albedo
70
New cards
Why would you use a biotic index regarding pollution?
To compare the relative frequency of indicator species and provide an overall environmental assessment of an ecosystem.