Macro Units 1-2
1/77
Earn XP
Description and Tags
JNSOIDU)(HIWBU)FDHIOBFU)IJONKD
Name | Mastery | Learn | Test | Matching | Spaced | Call with Kai |
|---|
No analytics yet
Send a link to your students to track their progress
78 Terms
scarcity
Reflects the limited availability of resources that occurs because human wants are
infinite and require choices to be made.
economic resources
the resources that are needed to produce goods and provide services. These resources include capital, labor, land, and technology/entrepreneurship.
Capital
Refers to the productive inputs needed to produce other goods
labor
the workers that are required to produce goods or provide services.
land
the physical land that is necessary
entrepreneurship
the scientific knowledge, techniques, or technical concepts needed to produce goods or provide services.
opportunity cost
Reflects the value of the best alternative to any choice that you make, in
other words, the value of what you lose relative to the choice you make.
ex: if you could make 40 trucks or 800 cars, opp cost of 1 truck = 20 cars
use dimensional analysis: opp cost of object a = 1 object a (object b/object a) = # object b
^^^DIFF equation used if measured in time and not objects
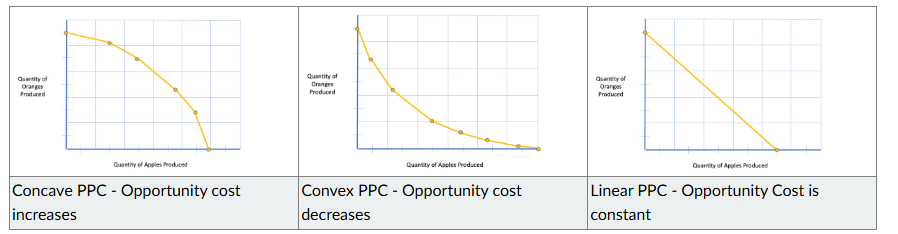
Production Possibilities Curve (PPC)
A graphical representation of the trade-offs that are
made in the production of two goods when resources are used as efficiently as possible
each axis is one good
graph if opp cost is increasing , decreasing, or constant
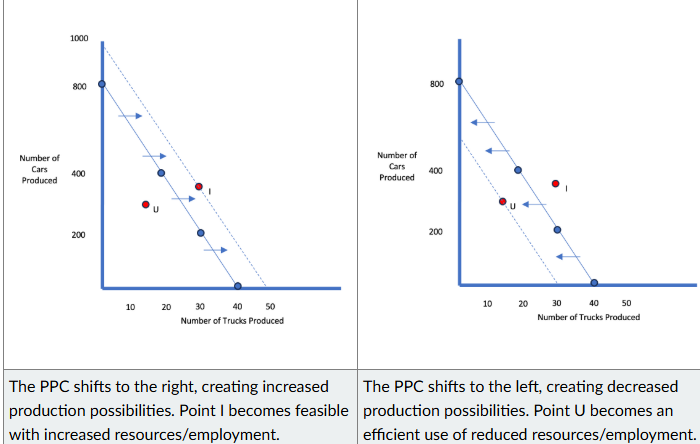
point below ppc curve
an INEFFICIENT use of resources and/or a product of unemployment.
point above PPC curve
represents an INFEASIBLE level of production with current resources. Any combination produced that is outside of the PPC is not sustainable.
If more resources become available/technology advances... | If resources become more scarce/loss of technology... |
Absolute Advantage
Occurs when a country can produce more of a good than a rival using the
same resources
ex: A makes it in 4 mins, B in 5 = A has abs adv
ex2: A makes 3 in one hr, B makes 2 in one hr = A has abs adv
Comparative Advantage
Occurs when a country can produce a good at the lowest opportunity
cost compared to a rival.
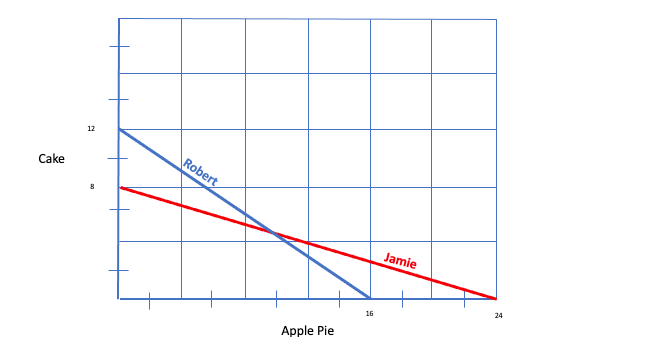
its possible to have absolute advantage but NOT comparative advantage or vice versa. idk abt this image tho
trading price of good A and B
Good A
person with comparative advantage in good A sets min trade price > their opportunity cost of good A in terms of good B (etc, 2 B for 1 A)
person with comp adv in good B sets max price < their opp cost of good A in terms of good B (etc, 4 B for 1 A)
Trading price of Good A is between 2B-4B
same method but reverse for good b
ARGH EEK UGH ACKLSPKDNIHPOFWEKN
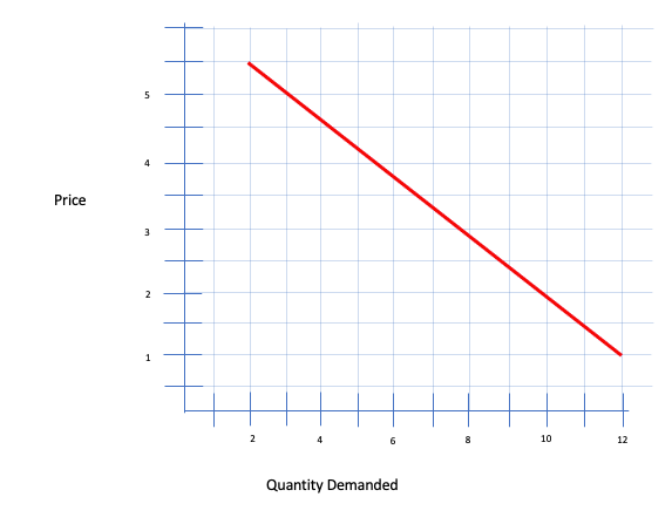
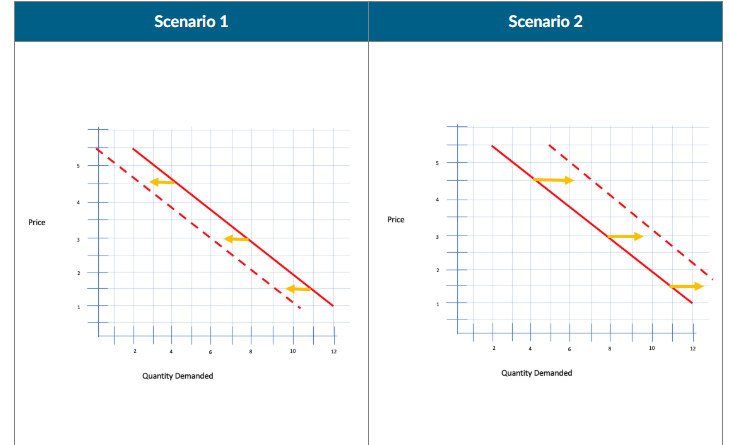
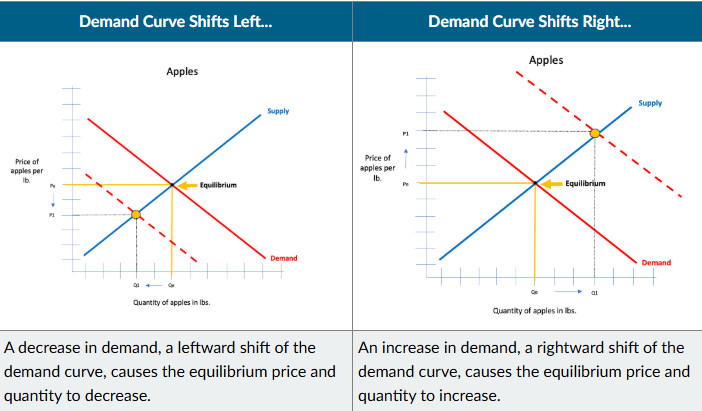
Law of Demand
The inverse relationship between price and quantity demanded, as price
increases, the quantity demanded decreases and vice versa.
*changes in price do not change demand, only the quantity of a good or service demanded
determinants of demand (shift ENTIRE demand curve at every price point)
Changes in Price of Related Goods (Substitute and Complimentary) |
Changes in Population |
Price Expectations |
Income |
Consumer Preferences |
Factors that have the ability to shift the entire demand curve either to
the left or to the right, includes consumer tastes, price of complementary goods, the number of
buyers, income level, and expectation of future prices.
Changes in Price of Related Goods (Substitute and Complimentary)
Increase substite price = inc demand curve
ex: pepsi (ew) becomes more expensive = inc demand for coke
increase compliementary price = dec demand curve
ex: if you need batteries for flashlights, if price of batter inc demand for flashlight dec
changes in population
inc population = more consumers = demand increases
and vice versa
price expectations
If consumers expect prices to increase in the future, they buy more now.
→ Current demand increases → Demand curve shifts right.If they expect prices to fall in the future, they wait to buy.
→ Current demand decreases → Demand curve shifts left.Example: If people expect gas prices to go up next week, they fill their tanks today → demand shifts right now.
income
Depends on whether the good is normal or inferior.
Normal goods (like new clothes, cars, phones):
If income increases, demand for normal goods increases.
→ Demand curve shifts right.If income falls, demand decreases.
→ Demand curve shifts left.
Inferior goods (like instant noodles, used clothes):
If income increases, demand for inferior goods falls.
→ Demand curve shifts left.If income falls, demand for inferior goods increases.
→ Demand curve shifts right.
consumer preferences
This refers to how popular or desirable a product is.
If a good becomes more popular, trendy, or favored by advertising/media → demand increases → shift right.
If tastes change away from a product (e.g., health concerns, bad press) → demand decreases → shift left.
Example: If a celebrity promotes a new sneaker brand, demand for that brand might shift right.
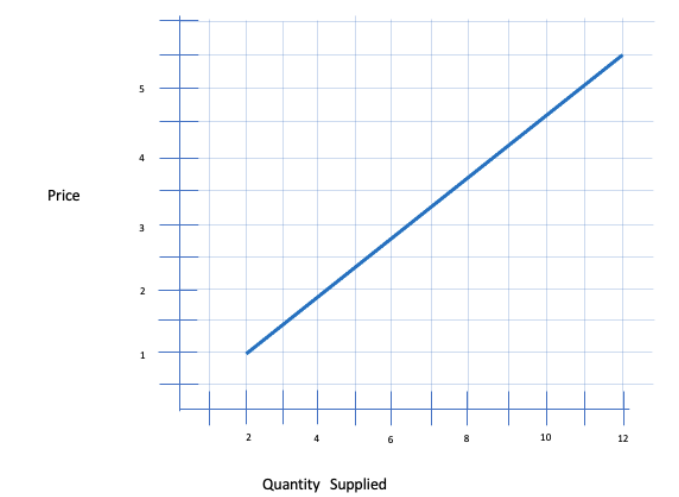
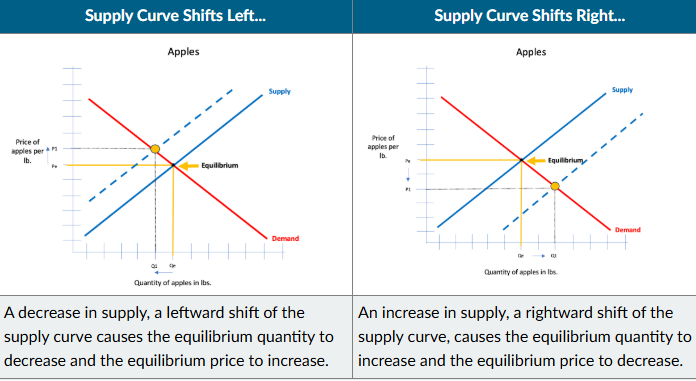
law of supply
The direct relationship between price and quantity supplied, as price increases,
the quantity supplied increases and vice versa.
As the price of a good or service increases, suppliers are incentivized to produce more in order to make more money. However, if the price of a good or service decreases, suppliers are less motivated to produce.
Similarly, changing prices does not alter supply, only the quantity of a good or service supplied
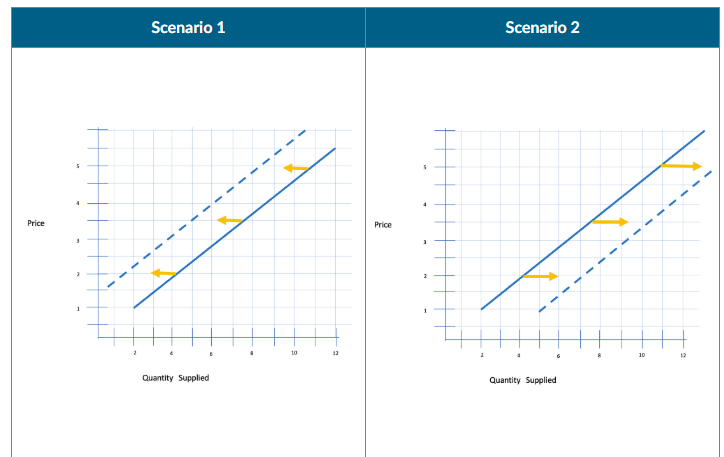
determinants of supply
Price of Inputs (costs) |
Price of Related Goods |
Number of Suppliers |
Technological Innovation/Increased Efficiency |
Expected Future Prices |
Factors that have the ability to shift the entire supply curve either to
the left or to the right, includes number of sellers or suppliers, level of technology used to
produce, price of production inputs, level of government regulation, price of other goods sellers
could produce, and the expectations among producers regarding future prices.
price of inputs
These are things like wages, raw materials, rent, etc.
If input prices increase → it becomes more expensive to produce the good
→ Supply decreases → Supply curve shifts left.If input prices fall → production is cheaper
→ Supply increases → Supply curve shifts right.
Example: If steel prices rise, car production costs increase → supply of cars decreases.
Price of Related Goods (in Production)
This applies especially to producers who can produce multiple goods using similar resources.
If the price of an alternative (substitute-in-production) good rises, firms might switch to producing that instead.
→ Supply of the original good decreases → Supply curve shifts left.If the price of a complement in production rises, producers may produce more of both.
→ Supply of original good increases → Supply curve shifts right.
Example: A farm produces both corn and soy. If corn becomes more profitable, the farmer might grow less soy → soy supply shifts left.
Number of Suppliers (or Producers)
If more firms enter the market, there’s more supply.
→ Supply curve shifts right.If firms exit (e.g., due to bankruptcy), supply decreases.
→ Supply curve shifts left.
Example: New solar panel companies enter the market → supply of solar panels shifts right.
Technological Innovation / Increased Efficiency
Better tech means you can produce more with the same inputs.
When technology improves, supply increases.
→ Supply curve shifts right.
Example: A new machine increases candy production speed → supply of candy increases.
Expected Future Prices (for producers)
This is about what producers expect prices to be in the future:
If producers expect prices to rise in the future, they may hold back supply now to sell later at a higher price.
→ Current supply decreases → Supply curve shifts left.If they expect prices to fall, they sell more now.
→ Current supply increases → Supply curve shifts right.
Example: If oil producers expect prices to rise next month, they reduce supply today → today's supply shifts left.
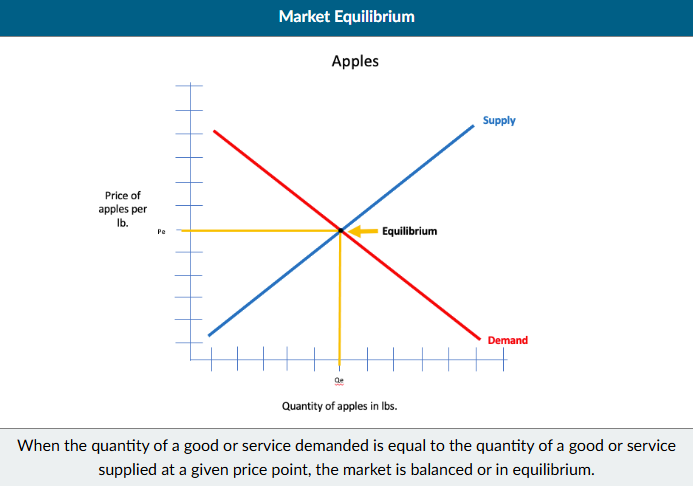
Market Equilibrium
Occurs at a price where the quantity demanded of a good is equal to the
quantity supplied, also known as the “market clearing price”
Market Disequilibrium
Occurs when the price of a good is either above or below the
equilibrium market price, leading to either a market shortage or market surplus.
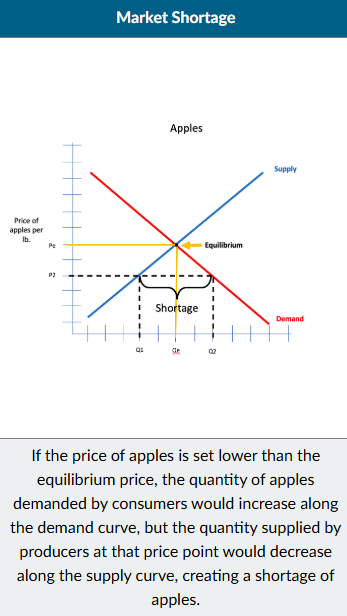
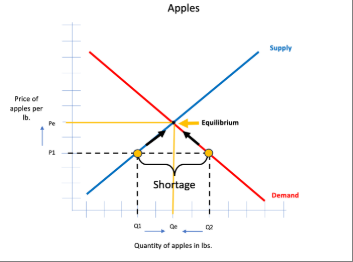
Market Shortage
Occurs when the quantity demanded of a good is higher than the quantity
supplied.
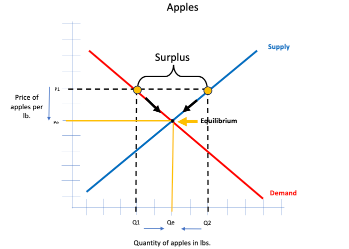
Market surplus
Occurs when the quantity supplied of a good is higher than the quantity
demanded.
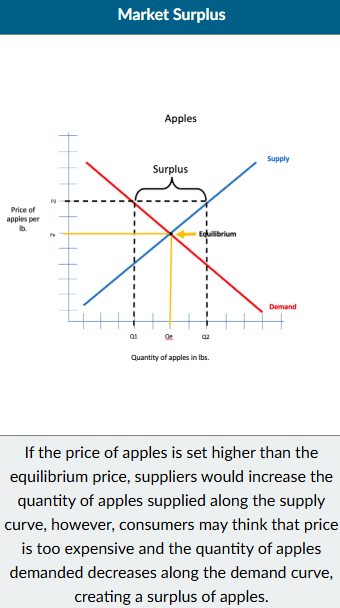
overcoming market surplus
When the quantity supplied is greater than the quantity demanded, producers lower prices which decreases the quantity supplied along the supply curve and increases the quantity demanded along the demand curve to establish an equilibrium price and quantity.
overcoming market shortage
When the quantity supplied is lower than the quantity demanded, producers raise prices which increases the quantity supplied along the supply curve and decreases the quantity demanded along the demand curve to establish an equilibrium price and quantity.
demand curve shifts left/right
supply curve shifts left / right
Business Cycle:
The fluctuations, expansion and contraction, in aggregate output or Real GDP
of an economy that occur over time, often in a cyclical pattern.
the fluctuations that occur over time in aggregate output, or the total amount of output produced by an economy, and employment due to changes in aggregate supply and/or aggregate demand. Another way to understand the business cycle is that it is relative to the growth rate of an economy (measured in GDP) over time. The trend line represents the potential GDP when at full employment.
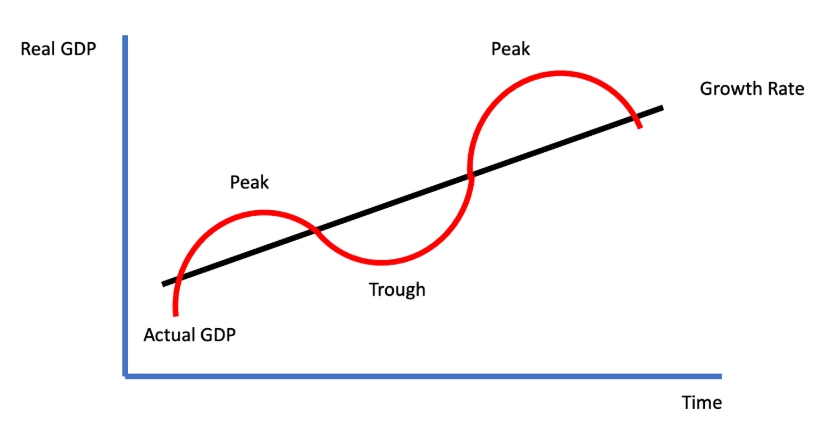
peak
The highest point of economic output following a period of economic expansion that leads
to the start of the contractionary phase of the business cycle.
trough
The lowest point of economic output following a period of economic contraction that
leads to the start of the expansionary phase of the business cycle.
expansion
The phase of the business cycle where economic activity is increasing which is
reflected by increasing output, increasing consumer spending, and decreasing unemployment.
recession
The phase of the business cycle where economic activity is decreasing which
reflected by decreasing output, decreasing consumer spending, and increasing unemployment.
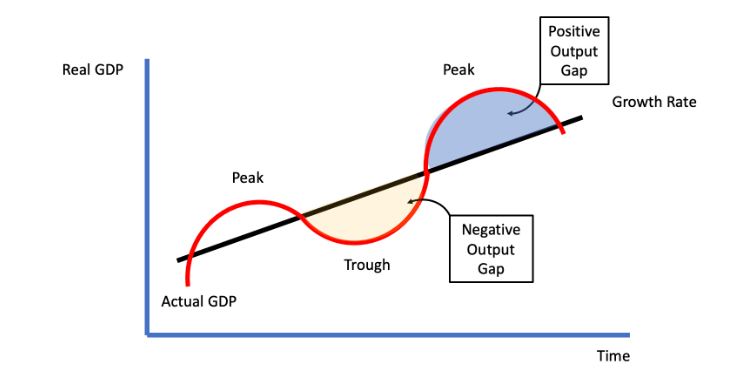
positive output gap
Occurs when the actual output (actual real GDP) of an economy exceeds
potential or full-capacity output (potential real GDP).
occurs which means the economy is producing at a level beyond its potential at full-employment. This would be the equivalent of the economy briefly producing beyond the production possibilities curve, which we've seen is unsustainable and is followed by economic contraction.

negative output gap
Occurs when the actual output (actual real GDP) of and economy is below the potential or full-capacity output (potential real GDP).
occurs and the economy is producing below its potential at full-employment. This would be reflected by a point within the production possibilities curve. In the next lesson on unemployment, we will see that individuals that lose their jobs due to economic contraction related to the business cycle are known as cyclically unemployed.
nominal GDP
Refers to the gross domestic product of an economy based on current market
prices which reflects the total dollar value of goods and services consumed, investment by firms,
government expenditures, and net exports.
Because current market prices are used as part of the calculation, nominal GDP can increase because of an increase in productivity as well as an increase in prices.
(We will see later in the unit that to determine the 'real' GDP, prices will need to be held constant to see how much of the increase in GDP is due to changes in productivity alone.
intermediate goods + what IS NOT included in GDP
if a good is purchased in order to be used to make something else, this is not included in calculating GDP. This type of good is known as an intermediate good.
Similarly, used goods, financial transactions, and transfer payments (i.e., a social security check from the government) are not included in GDP. also no stocks/bonds
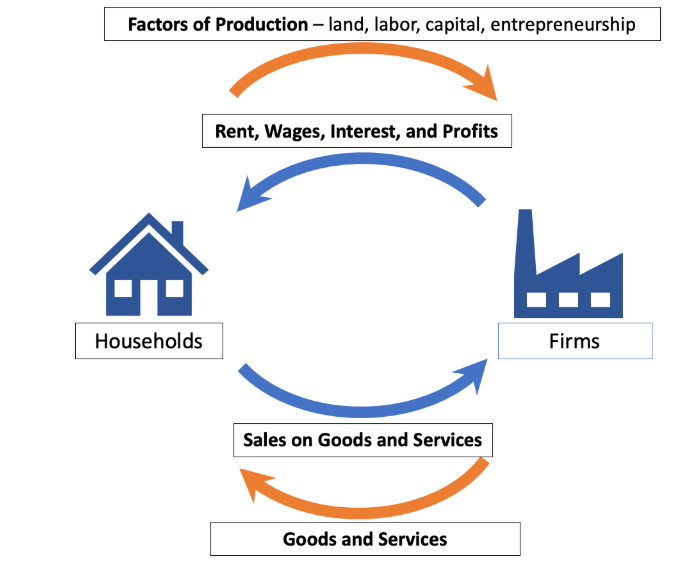
Circular Flow Model,
households provide firms, or businesses, the factors of production necessary to make goods and services. In exchange, firms provide households rent, wages, interest, and profits. Once the goods and services are produced, they are supplied to households in exchange for payment, or sales, of those goods and services.
A model that illustrates how money flows through a society via
interactions between households and firms which is reflected in the product market and the factor
(resource) market.
3 approaches to calculating GDP
Expenditure, Income, Value added
Expenditure
Focuses on the total amount of spending or all of the purchases of goods and services made in a country in one year.
income
focuses on all of the income earned from all of the purchases of goods and services made in a country in one year
value added
focuses on adding up all of the value that is generated at each stage of the production process of goods and services made in a country in one year.
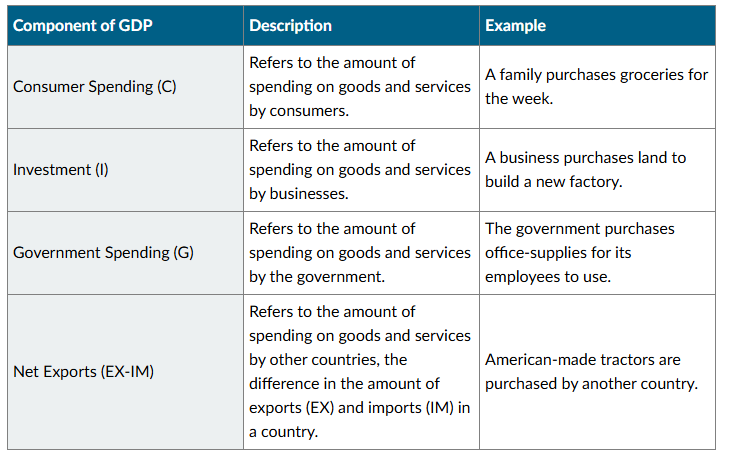
GDP EQUATION!!!
GDP = C + I + G + (EX - IM)
(gov spending NOT including transfer payments)
limitations of GDP
GDP doesn't factor in the following:
Non-market transactions (black market or illegal transactions)
Income inequality
Costs imposed on human health and the environment due to production or consumption related to a nation's output
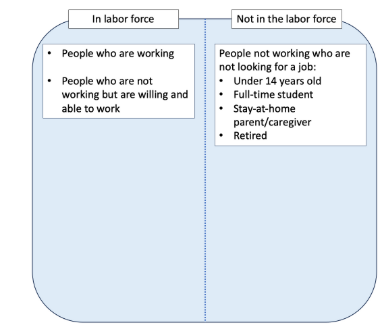
labor force
All members of a society or population who are eligible and able to work or the
total number of individuals that are employed or who are currently looking for employment.
labor force participation rate
(# of people in the labor force/# of people in the population) X 100 = labor force participation rate
Refers to the percentage that is calculated when dividing the number of individuals in the labor force by the total population of a society and multiplying by 100.
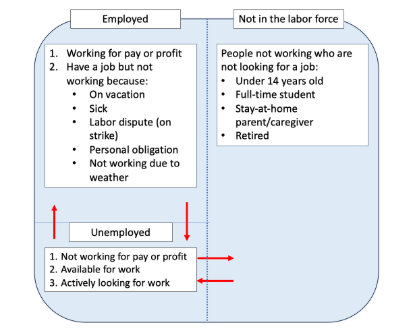
unemployment
Refers to the number of individuals within the labor force that are not working
but seeking employment.
you must not be working for pay or profit, you must be available for work, and, most importantly, actively looking for work during the previous 4 weeks. To actively look for work includes submitting resumes, filling out applications, interviewing for a job, contacting employers about job opportunities, etc.
unemployment rate
# of unemployed people/# of people in the labor force X 100 = unemployment rate
discouraged workers
Unemployed workers are said to be 'discouraged' when they stop looking for work, which removes them from the labor force.
NOT IN LABOR FORCE OR UNEMPLOYMENT RATE
limitations of unemployment rate
The measured unemployment rate is often criticized for understating the level of joblessness because it excludes groups such as discouraged workers and part-time workers.
absence of discouraged workers may make unemployment rate falsely lower
part time workers considered FULLY EMPLOYED even if they r seeking full time employment
Frictional Unemployment + how to reduce it
Frictional Unemployment: Refers to those individuals who voluntarily leave one job and are
currently searching for another job.
Frictional unemployment is reduced by helping individuals find jobs more quickly. For example, on-line job search tools help connect the structurally unemployed find potential employers.
Structural Unemployment + how to reduce
Structural Unemployment: Refers to those individuals who no longer have the knowledge or
skills that their employer demands or whose job is replaced by technology
Structural unemployment is reduced through the use of job training to help the structurally unemployed acquire new skills demanded by employers.
Cyclical Unemployment
Cyclical Unemployment: Refers to those individuals who are unemployed due to fluctuations in
the business cycle.
gov policies (fiscal or monetary)
Natural Rate of Unemployment (Full Employment)
Natural Rate of Unemployment (Full Employment): Refers to the point when there is only
frictional and structural unemployment or there is no cyclical unemployment.
the lowest unemployment (or highest employment) we can reasonably expect in an economy. Any increase in unemployment above the natural rate of unemployment is due to cyclical unemployment or changes in the business cycle.
Inflation
The broad increase in prices across an economy over time.
When prices increase for everything, purchasing power for both producers and consumers decreases
Inflation rate definition
Refers to the percentage change in the aggregate price level from one year to the
next across an economy.
the percentage of price increase over time that diminishes wage increases or rates of return. While you may receive a nominal wage increase or a nominal interest rate of return, your real wage increase or real interest rate of return includes the inflation rate. I
real variables
like real wages, real interest rates, and real GDP, are adjusted to take increased prices into consideration.
deflation
the broad decrease in prices across an economy over time.
deflation is often an indicator of an economic downturn, signaling a recession or a depression.
Disinflation
Disinflation: The general slowing of, or decrease in, the rate of inflation in an economy in the
short term
Rate of inflation could still be positive, but less that it was before (think concavity)
Consumer price index CPI definition
An index used to track inflation in an economy over time, based on tracking the price of a fixed number, basket, of consumer goods and services.
At the heart of CPI is what is known as the 'basket of goods' or the fixed goods and services that economist use to track prices over time. The 'basket' is meant to represent the prices of items on which Americans spend their money. Included in the 'basket' are things such as housing, transportation, food, etc.
CPI EQUATION!!!
(Cost of Basket of Goods and Services in Current Year / Cost of Basket of Goods and Services in Base Year) X 100
*whole value, not percent or dollar
INFLATION RATE EQUATION using CPI !!!!
[(Current Year CPI - Previous Year CPI) / Previous Year CPI] X 100
basically: percent change in CPI from last year x 100
![<p>[(Current Year CPI - Previous Year CPI) / Previous Year CPI] X 100</p><p><br>basically: percent change in CPI from last year x 100</p>](https://knowt-user-attachments.s3.amazonaws.com/02ff3fe8-abea-482d-ae86-bc876eb6da10.png)
limitiations of CPI
substitution bias - or the likelihood that consumers will opt to purchase less expensive substitute goods and services when prices increase.
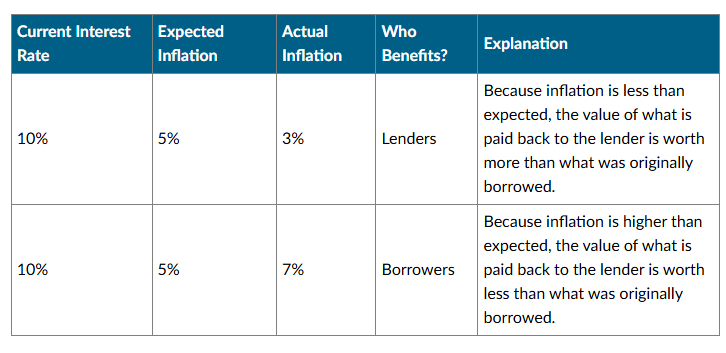
who benefits when
actual inflation > expected inflation
actual inflation < expected inflation
Real GDP
Measures economic growth or output that is adjusted to account for inflation.
measuring how much is produced in a given year by using constant prices which removes the effect on GDP due to changes in overall price level. A common way to measure real GDP is to weigh final goods and services by their prices in a base year.
GDP DEFLATOR EQUATION
A price index that is used show the relative impact of inflation on GDP over time.
GDP Deflator = Nominal GDP / Real GDP X 100
Having a nominal GDP that is higher than real GDP is an indication of inflation. Conversely, deflation occurs when nominal GDP is lower than real GDP.
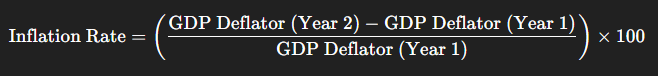
Inflation Rate using GDP DEFLATOR equation!!!
Inflation Rate = GDP Deflator (Year 2) - GDP Deflator (Year 1) / GDP Deflator (Year 1) * 100
GDP deflator vs CPI
The CPI focuses on tracking inflation on consumer spending while the GDP deflator more broadly tracks inflation for all the components of GDP.
The inflation rate that is calculated using the GDP deflator includes all elements of spending (consumer, investment, government, and net exports), while the inflation rate that is calculated using the CPI only reflects the increase in prices of consumer goods.