OMIS 1050 WEEK 4
1/101
There's no tags or description
Looks like no tags are added yet.
Name | Mastery | Learn | Test | Matching | Spaced |
|---|
No study sessions yet.
102 Terms
What are descriptive statistics?
stat technique & number measure foundation
What are descriptive statistics’ use?
initial data understanding in business analytics to understand meaning / relationship
What are the centre & location measures?
mean
median
mode
weighted mean
geometric mean
What are the rank measures?
percentile
quartile
box plot
What are the variation measures?
range
mean absolute deviation
variance
standard deviation
coefficient of variation
covariance
coefficient of correlation
What denotes paramaters?
Greek letter
What denotes statistics?
Roman letter
Greek letter with carat
What denotes a population mean?
μ
What denotes a sample mean?
x̄
Do outliers affect the mean?
yes
Do outliers affect the median?
slightly
What is the mode’s main use?
nominal data
Do outliers affect the mode?
no
What denotes a weighted mean?
x̄w
What is the weighted mean formula?
(sum of values * weights) / sum of weights
What does the mean describe?
interval data central location
What does the median describe?
interval / ordinal data central location
What does the mode describe?
nominal data
What does the geometric mean describe?
growth rate interval data
What is the mean & median & mode relationship in a symmetrical distribution?
all =
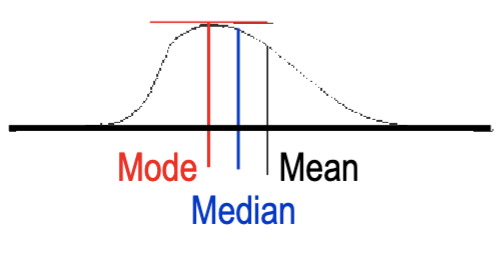
What is the mean & median & mode relationship in a distribution skewed right?
mode < median < mean
What is a skewed right synonym?
positively skewed
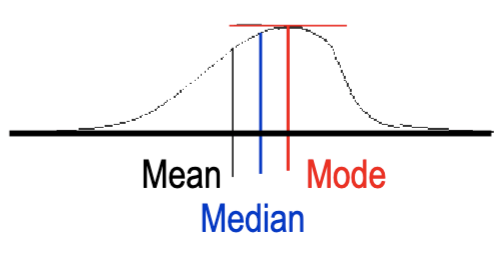
What is the mean & median & mode relationship in a distribution skewed left?
mean < median < mode
What is a skewed left synonym?
negatively skewed
What does a positively skewed distribution look like?
What does a negatively skewed distribution look like?
What’s an advantage of the range?
compute ease
What’s a disadvantage of the range?
dispersion info absence
What is the deviation?
value & mean difference
What is the deviation formula?
value - mean
What is the average deviation value?
0
What does MAD stand for?
Mean Absolute Deviation
What’s the MAD’s use?
forecast model
What is the MAD formula?
(sum of absolute deviations) / item number
What are the most important descriptive statistics?
variance
standard deviation
What denotes population variance?
σ²
What denotes sample variance?
s²
What is the variance calculation numerator?
sum of squared deviation
What is the population variance formula?
sum of squared deviation / population size
What is the sample variance formula?
sum of squared deviation / (sample size - 1)
What is the sample variance shortcut formula?
(sum of squared values - [square of summed values] / sample size) / (sample size - 1)
What denotes population standard deviation?
σ
What denotes sample standard deviation?
s
What is the standard deviation’s use?
compare distribution variability
make distribution shape statement
What is a relative position measure?
z-score
What is the z-score?
standard deviation number from mean
What is a z-score synonym?
standardized data
What is the z-score formula?
(value - mean) / standard deviation
What is the z-score Excel formula?
=STANDARDIZE
What are the linear relationship measures?
covariance
coefficient of correlation
What is covariance?
2 variable pattern
What is coefficient of correlation?
2 variable pattern strength
What are rank measures’ use?
compare
valuerank
What is a percentile?
value dividing data in 100 equal parts
What is a quartile?
value dividing data in 4 equal parts
What is the percentile position formula?
(item element + 1)(percentile / 100)
What denotes the percentile position?
LP
What is the percentile formula if the position is not whole?
lower rounded value + percentile position * (upper rounded value - lower rounded value)
What is the percentile Excel formula?
=PERCENTILE.EXC
What does IQR stand for?
InterQuartile Range
What is the IQR?
3rd & 1st quartile differenceWh
What is the IQR formula?
Q3 - Q1
What is the IQR’s use?
middle 50% range
What is a box plot synonym?
box & whisker plot
What does the box plot show?
Q1, Q2, Q3 using box & range using whisker
What is the max whisker length past the box?
1.5 * IQR
How do you plot outliers beyond the whisker?
individual point
When can you use the empirical rule?
normal distribution
What’s the empirical rule’s use?
approximate value percent within standard deviation number
What total percent of items fall within 1 standard deviation?
34% + 34% = 68%
What percent of items fall within 2 standard deviations?
13.5% + 13.5% = 27%
What total percent of items fall within 2 standard deviations?
68% + 27% = 95%
What percent of items fall within 3 standard deviations?
2.35% + 2.35% = 4.7%
What total percent of items fall within 3 standard deviations?
95% + 4.7% = 99.7%
What is the coefficient of variation’s use?
express standard deviation relative to mean with different data means
What is a coefficient of variation application?
finance
risk to return
What is said about larger coefficients of variation?
greater relative spread
What is the coefficient of variation formula?
standard deviation / mean * 100%
What is the population covariance formula?
sum of deviation products / population size
What is the sample covariance formula?
sum of deviation products / (sample size - 1)
What is the sample covariance shortcut formula?
(1 / sample size - 1)(sum of variable products - [sum of variable 1 * sum of variable 2 / sample size)
What will the covariance value be if 2 variables move the same direction?
large + value
What will the covariance value be if 2 variables move the opposite direction?
large - value
What will the covariance value be if there is no 2 variable pattern?
value close to 0
What is the coefficient of correlation formula?
covariance / (standard deviation 1 * standard deviation 2)
What denotes the population coefficient of correlation?
p
What is the coefficient of correlation range?
-1 - 1
What will the coefficient of correlation value be if the 2 values have a strong positive linear relationship?
value close to 1
What will the coefficient of correlation value be if the 2 values have a strong negative linear relationship?
value close to -1
What will the coefficient of correlation value be if the 2 values have no straight linear relationship?
value close to 0
What is the coefficient of correlation Excel formula?
=CORREL
Data → Data Analysis → Correlation
What is the sample covariance Excel formula?
=COVARIANCE.S
What is the population covariance Excel formula?
Data → Data Analysis → Covariance
What table should you create when calculating the covariance, variance, standard deviation, and coefficient of correlation?
sum of & X | sum of & Y | sum of & X*Y | sum of & X2 | sum of & Y2 |
* covariance * variance | * covariance * variance | * covariance | * variance | * variance |
What are the geometric mean’s uses?
multiplicative values
wide range
compare changes over time
What is the geometric mean formula?
(product of 1 + growth rate)^1/size - 1
What function returns the cell number matching criteria?
=COUNTIF
What function sums numbers?
=SUM
Home → Σ
What function returns the population variance?
=VAR.P
What function returns the sample variance?
VAR.S
Data → Data Analytics → Descriptive Statics → toggle “Summary statistics”