ECON 102 - Exam 1
 Call Kai
 Learn
Learn Practice Test
 Spaced Repetition
 Match
Match Flashcards
 Knowt Play
1/101

There's no tags or description
Looks like no tags are added yet.
Name | Mastery | Learn | Test | Matching | Spaced | Call with Kai | Chat |
|---|
No analytics yet
Send a link to your students to track their progress
102 Terms
Chapter 1: The Scope and Method of Economics
…
What is economics?
the study of choices that people, firms, and societies make with their limited resources (scarcity)
Scarcity
availability is limited in some way
poverty
an income level below with people cannot afford basic means
Microeconomics:
individual decisions
how firms compete
individual market
how groups of consumers make decisions
Macroeconomics:
how government decisions impact economics
multiple markets
interactions between multiple economies
_________ is limited (scarce) in some way.
EVERYTHING
5 Foundations of Economics:
Incentives
Life is about tradeoffs
Opportunity Cost
Marginal Thinking
Trade
5 Foundations of Economics: Incentives
People are motivated by both positive and negative incentives
incentives can have unintended consequences
5 Foundations of Economics: Life is about tradeoffs
Ex: Cost of a heavy-duty bomber something —> Could have been 2 power plants, or 2 hospitals, or 50 miles of concrete highway, etc.
for 1 new bomber that is constructed, there is another things that could have been built
5 Foundations of Economics: Opportunity Cost
The highest value alternative that must be given up to engage in an activity
recognizing the best thing that you could have been doing
5 Foundations of Economics: Marginal Thinking
Evaluating whether the benefit of acquiring one more unit of something is greater than the cost
Marginal = The nest unit of something
5 Foundations of Economics: Trade
Trade and specialization are the cornerstones of economics
All parties involved are better off through specialization and trade
To build models we use the ___________________
scientific method
4 steps of building models:
Observe a phenomenon —> observations in economics are decisions that people make under scarcity
Based on observations, we develop a hypothesis —> which is a proposed explanation of that phenomenon
Construct a model to test the hypothesis
Design experiments that test how well the model works —> after data collection, scientists can revise, verify, or refute the hypothesis
Experimental Economics
economists collect data by looking at real world events or designing lab experiments to test them directly using human subjects
Models can _______________ but are meant to illustrate key concepts
oversimplify
Economists test models by changing one ___________ at a time __________________
Variable
Ceteris paribas
Variable
factor that could be in a model
ceteris paribas
holding all other things constant
Endogenous variable
it is controlled for in a model
a variable within the model
Exogenous variable
it is outside the model
BEWARE of faulty assumptions
Economists focus of _________________
positive analysis
Positive statement
a statement that is testable and verified
CAN be incorrect (EX: the sky is purple)
Normative statement
a statement that cannot be tested or verified
an OPINION
Chapter 2: Scarcity and Choice
…
Opportunity cost
the highest values next-best alternative that must be sacrificed to attain something
LOOK AT THE MATH
…
Production Possibility Curve/Frontier (PPC or PPF)
shows the maximum amount of any 2 products that can be produced by a society/firm/person from a fixed amount of resources if all resources are used
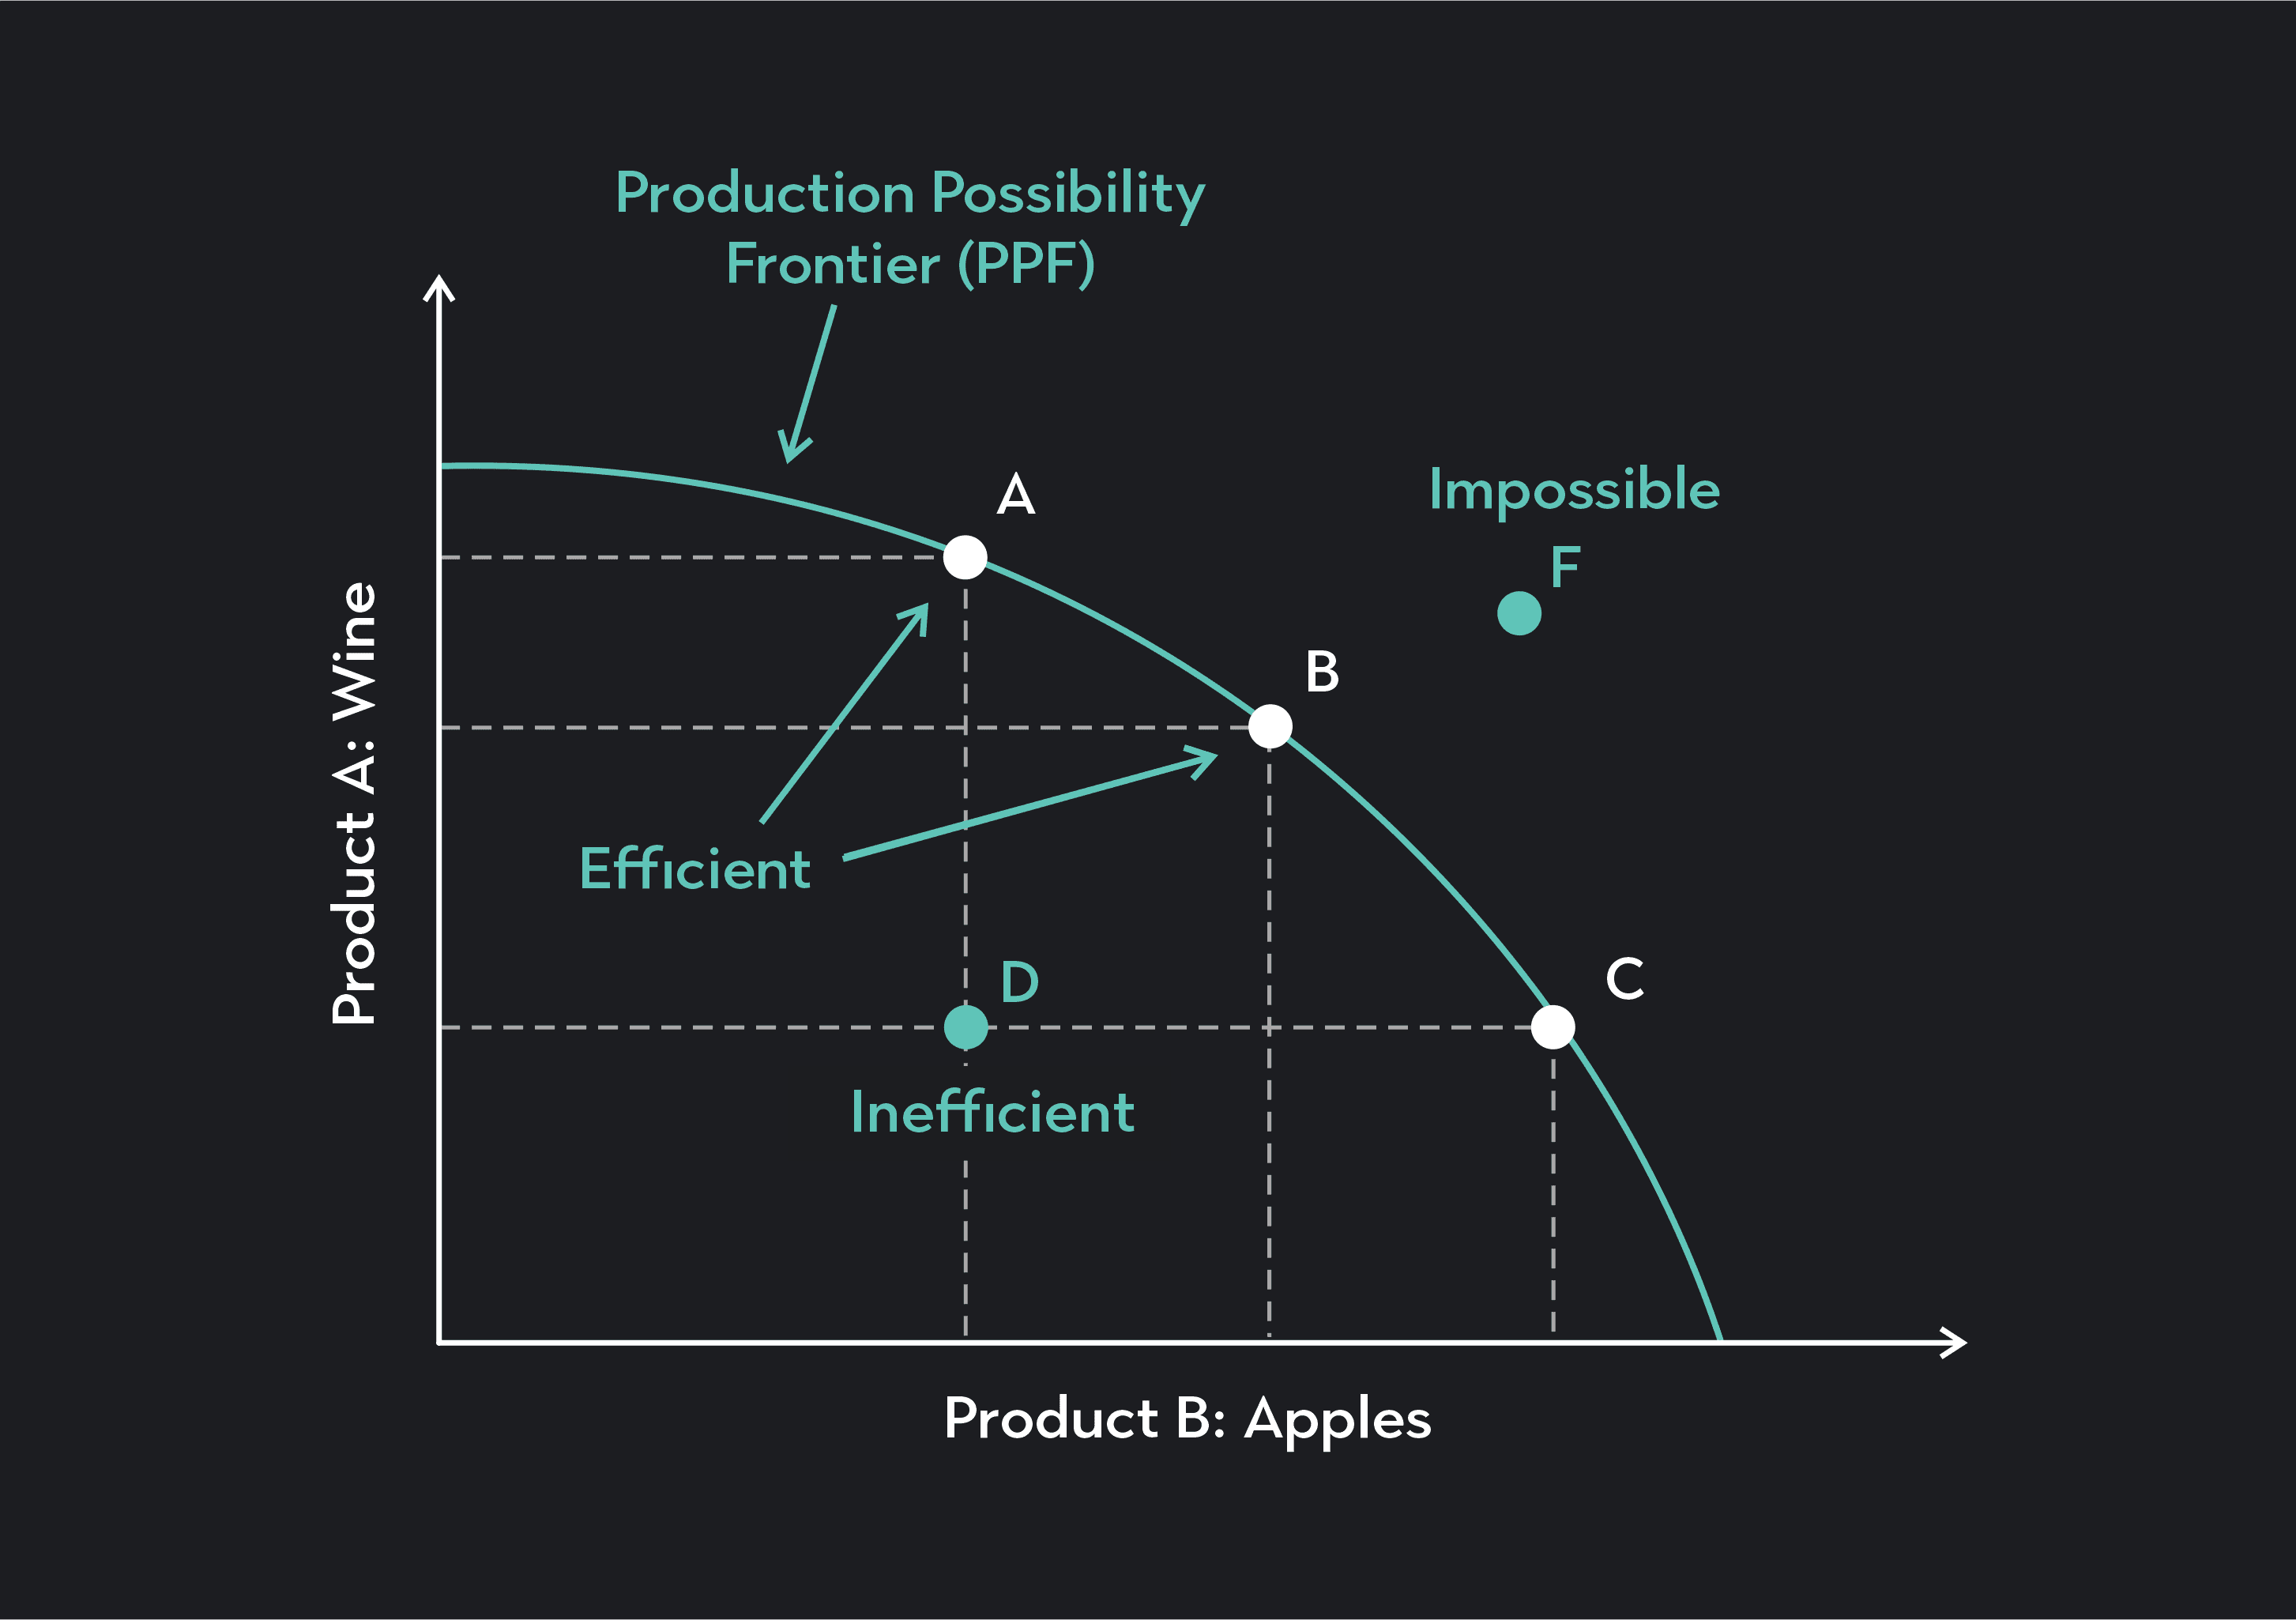
The Production Possibility Curve (PPC) is generally ___________. This is due to ______________________
non-linear
increasing relative cost —> means the opportunity cost of producing a good rises as society/firms/people produce more of it
A linear Production Possibility Curve (PPC) has a _____________ opportunity cost
constant
The Production Possibility Curve (PPC) will:
Shrink if…
Expand if…
resources are destroyed
builds more factories for both products
Comparative advantage
a person/firm/country has a comparative advantage over another person/firm/country in producing a good if they can produce that good at a lower opportunity cost
Lower opportunity cost means that a person producing a different good is ______________
more costly
Means that their “next best thing” is NOT worth that much, so they should stick to producing what they are producing and specialize/trade
Comparative advantage is DIFFERENT from Absolute advantage
when a person/country/firm produces at a lower cost
LOOK AT THE MATH
…
Chapter 3: Demand and Supply
…
Law of Demand
there exists an inverse relationship between the price of a good and the amount of it buyers are willing to purchase
means demand will always be negative
Movement along the demand curve (A —> B) is a result of price/quantity change alone. This is known as a __________________.
Change is quantity demanded (QD)
comes from changing variables in the model
A shift in the entire curve (D1 —> D2) occurs when something other than P or Q changes. This is called a ___________________________.
change in demand
Demand curve shifts when ________________ is violated.
ceteris paribas (holding all else constant)
this is when we change a variable outside the model
Law of supply
there exists a direct relationship between the price of a good and the amount of it offered for sale
means supply will always be positive
Movement along the supply curve (A —> B) is a result of price/quantity change alone. This is known as _____________________
a change in quantity supplied (QS)
A shift in the entire curve (S1 —> S2) occurs when something other than price/quantity changes. This is know as ___________________________
a change in supply
The supply curve shifts whenever _________________ is violated
ceteris paribas
________________________ pushes the market to equilibrium where QS=QD
Adam Smith’s “invisible hand of the marketplace”
LOOK AT THE MATH
…
Chapter 5: Elasticity
…
Elasticity
measures the % change in one variable with respect to a % change in another variable
Elastic = ?
Inelastic = ?
Flexible
Inflexible
LOOK AT THE MATH
…
Determinants of Price Elasticity of Demand:
Substitutes —> more substitutes = more elasticity
Bigger % of budget —> more elastic demand (not willing to spend any more)
More time allowed for something —> more elastic because mor substitutes are available over time
What are the 2 methods for calculating Price Elasticity of Demand?
% Formula
Midpoint Formula
LOOK AT THE MATH
…
Revenue
amount of $ made
P x Q
For Price Elasticity of Demand:
0>ED>-1 —>
ED<-1 —>
—> Relatively inelastic
—> Relatively elastic
According to the Law of Demand, ED should always be _________
negative
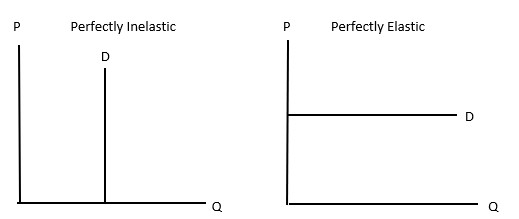
Perfectly inelastic graph:
ED=0
Ex: emergency hospital care, insulin, etc.
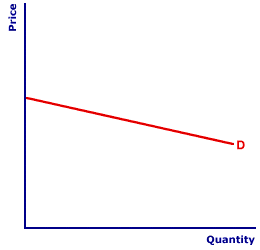
Relatively inelastic graph:
-1<ED<0
Ex: gas, electricity, etc.

Relatively elastic graph:
-infinity<ED<-1
Ex: apples, etc.
Perfectly elastic graph:
ED= -infinity
Ex: money

Unitary elasticity
ED=1
NOT a 45% line
Income elasticity of demand
measures how a change in income affects quantity demanded
Unlike before where ED had to be negative, EI can be _______________________
positive or negative
What the different values of EI mean:
EI>0 = Normal
0<EI<1 = Necessity
EI>1 = Luxury
EI<0 = Inferior
Cross price elasticity of demand
measures the responsiveness of the quantity demanded of one good to the change in price of another good
EC can be _____________________
positive or negative
What the different values of EC mean:
EC>0 = Substitute good
EC<0 = Complementary goods
Price elasticity of supply
measures how QS changes with respect to a change in P
According to the Law of Supply, ES must be_______________
greater than or equal to 0
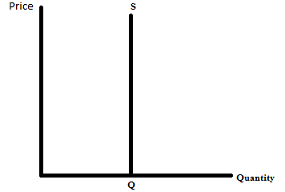
Perfectly inelastic supply graph:
ES=0
Ex: ocean front land, etc.
Relatively inelastic supply graph:
0<ES<1
Ex: cell phone towers, etc.

Relatively elastic supply graph:
ES>1
Ex: hot dog vendor, etc.

Perfectly elastic supply curve does _______ exist because of _________
NOT
scarcity
Chapter 4: Demand and Supply Application
…
LOOK ST THE MATH
…
Consumer surplus (CS)
difference between willingness to pay and the amount paid for a good across all consumers
willingness to pay = most a buyer is willing to pay

Producer surplus (PS)
difference between price sellers are paid and willingness to sell a good
willingness to sell = least amount necessary for a seller to sell a good
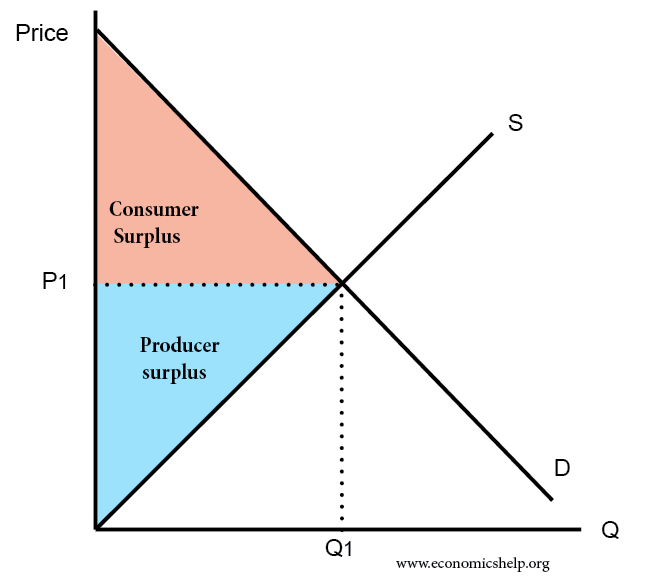
Total surplus (TS)
Consumer surplus + producer surplus + tax revenue
The outcome is _________ when an allocation of resources maximizes __________________
efficient
total surplus
The _____________________________ is efficient!
Adam Smith’s Invisible Hand of the marketplace
Economists sometimes care about ___________
equity
fair distribution of goods
hard to measure
Levy
who is legally responsible (supply or demand) for paying the tax
Incidence
who actually pays the tax (both parties pay some % of the tax as a result of market adjustment)
Deadweight loss (DWL)
decline in economic activity, and the lost surplus from that decline
taxes cause inefficiency
Taxes in competitive markets causes DWL, so there needs to be other incentives such as:
raise $ for the government
stop/decline economic activity intentionally
Tax revenue
collected by the government and are counted in total surplus

Calculating % tax incidence for consumers and suppliers
(difference in what they pay)/(tax)
tax incidence does NOT depend on which side the tax was _________ on
levied
Tax incidence depends on ___________________
relative elasticity
the more INELASTIC side pays a higher % of tax
Price controls
price ceilings and floors
Price ceiling
a legally imposed maximum price on a good
shortage
too little supplied and too much demanded
surplus
too little demanded and too much supplies
A price ceiling is binding if it is set __________ the equilibrium price because…
below
because the invisible hand of the market wants to push the market to equilibrium but it cannot
nonbinding price ceiling is set __________ the equilibrium price
above
no impact on the market
a binding price ceiling can lead to ____________
black markets
Price gouging
when a seller increases the price of goods in response to a demand shock in an emergency
Price gouging is illegal following a declared state of emergency
Acts as a price ceiling!
Price floor
legally mandated minimum price of a good
main example is minimum wage
Minimum wages are binding if the minimum wage is __________ than wage at equilibrium
greater