diverse places
1/119
There's no tags or description
Looks like no tags are added yet.
Name | Mastery | Learn | Test | Matching | Spaced |
|---|
No study sessions yet.
120 Terms
how has uk population changed over time
in 1960s population grew rapidly due to baby boom after ww2
in 1970s and 80s population grew slowly which coincided with deindustrialisation cause by the global shift
between 2005 and 2020 the population grew between 3.5% and 4% every 5 years due to increased immigration due to joining the EU which allowed free movement
where UK population growth is concentrated and definition of north south drift
growth is concentrated un the south of England, due to rising prosperity of London and SE England as a global centre of business, finance and a hub for services. By comparison the north of England has experienced little growth and is still recovering from the global shift
north-south drift - the redistribution of population resulting from the spatial pattern of growth and decline
burgess model and population density
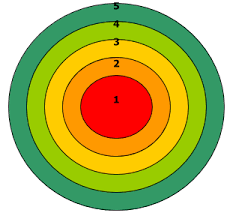
CBD
inner city
inner suburbs
outer suburbs
rural-urban fringe
highest pop density is in inner city, lowest is in rural urban fringe.
pop density does generally decrease with increased distance from CBD however there are exceptions
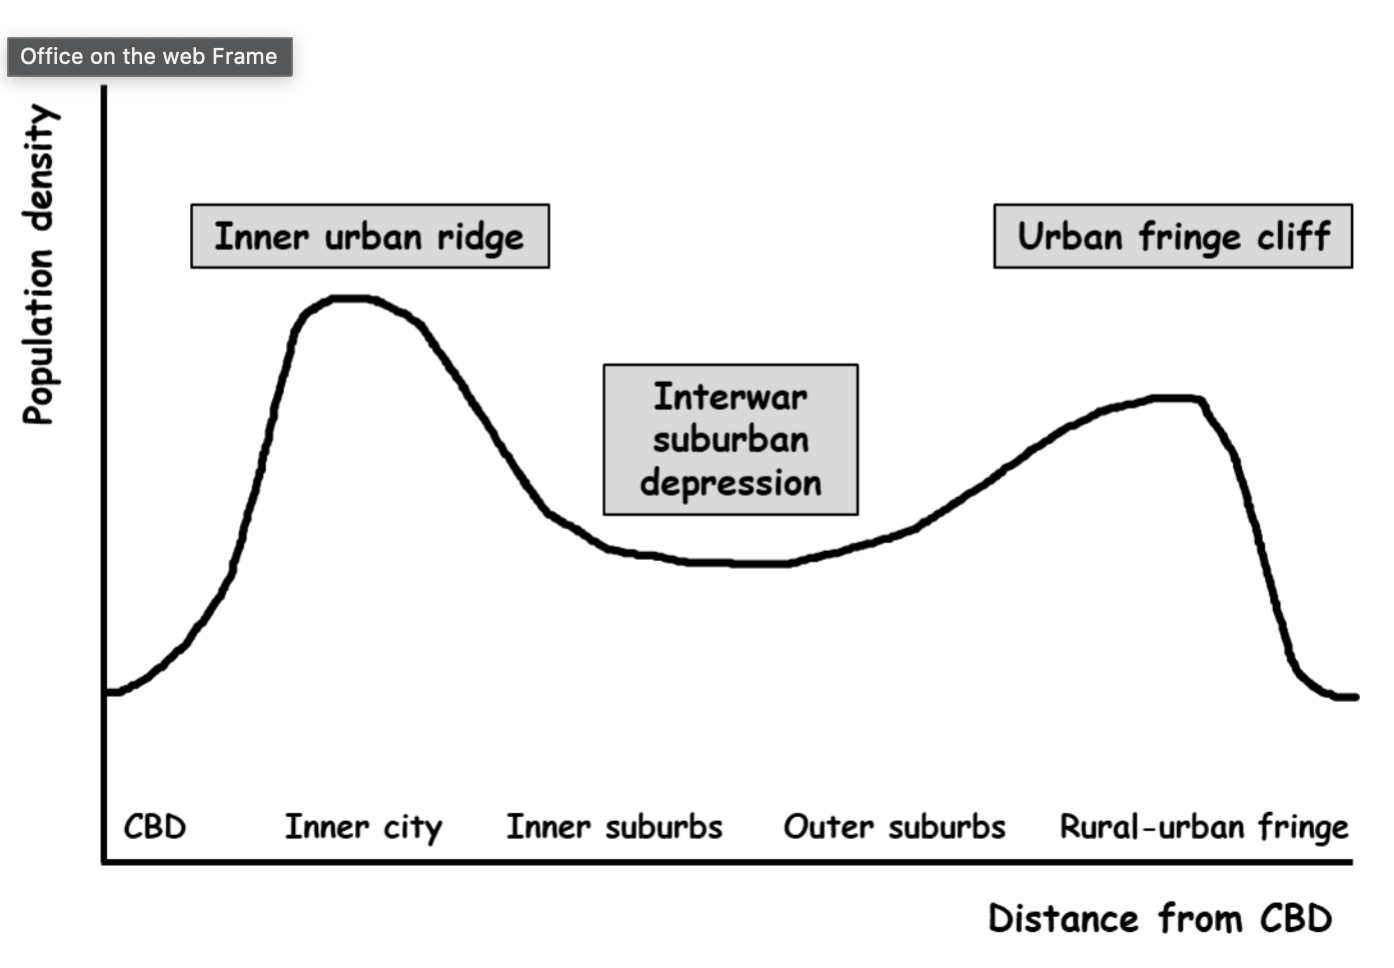
rural urban continuum graph and explanation
CBD - residential pop squeezed out by commercial activities and the concentration of many public buildings
inner-urban ridge - initially densely packed terraced buildings associated with industrial workers. many of these areas have been replaced with high rise blocks of flats. many of the high rise blocks have been replaced with modern housing. both redevelopments are unlikely to have eroded high pop density rim around CBD
interwar suburban depression - low density house building prevailed throughout the interwar period
urban fringe cliff - at the end of ww2 planning controls were relaxed at the edge of settlements. this increased pop density in the outskirts of urban areas as massive house building took place. many social housing estates are located at the urban fringe. the fringe burn areas has been firmed up and controlled by the creation of greenbelts, policies designed to stop urban sprawl into the countryside
why has pop changed within urban areas
the population varies within burned areas as in the CBD there are less people due to the cost of living in the inner city. whereas in the outer city there are more people due to the fact that commuting is now an option and also it is cheaper to live there.
natural change definition
the outmode of the balance between birth rates and death rates
different types of migration definitions
migration - the movement of people within a country
international migration - movement of people between countries
immigration - arrival of people from other countries
emigration - the act of leaving one country or an area to settle in another
net migration - total immigration - total emigration
long term immigration statistics in UK
of the 12 million people who came to live in the uk in June 2024
86% were non-uk
10% were EU nationals
5% were British nationals
the demographic transition model
It shows how birth rate and death rate have influenced the total population of a place and changed over the years as industrialisation occurs
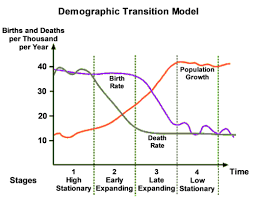
limitations of demographic transition model
doesn’t show
government policies and legislations e.g one child policy
disease e.g covid
migration - population and birth rate increase
war - would lea to increased death rate and decreased birth rate
what is the dependancy ratio
the balance between economically independent people and economically dependent people
dependant - under 15 and over 65
independent - 15-64
other factors that affect pop density with increased distance from urban centre
physical environment - fairly flat areas lend themselves to residential development, building on slopes or flood plains is more expensive
dwelling type and household size - both influence density
socio-economic status - more wealthy members of society live in the most expensive housing. will also want to be furthest away from pollution
functions - housing is mixed with non-residential activities which will decrease pop density
planning - urban planners control the population density of all residential development, also dictates how many dwelling units should be built per hectare, green belt land is usually on the edge of urban areas and is protected from development
how does population vary in urban areas
tend to have a younger and more ethnically diverse population
higher proportion of young adults
higher fertility rate
high rates of international migration
high internal migration from rural
how does population vary in rural areas
varies between a commuter town and remote rural settlement
older, less diverse population
higher proportion of older adults
lower fertility rates
lower rate of international migration
what are population characteristics
deprivation
educational attainment
pop change
total pop
pop density
pop structure
what does ethnicity mean
cultural heritage shared by a group pf people that sets them apart from others
3 causes of different levels of cultural diversity
social clustering - generally inside cities diversity is higher. minority ethnic groups have become concentrated in cities due to pre-established ethnic communities, specialist services and availability of housing
accessibility - major role in immigrant settlement patterns. remote/ rural offers fewer opportunities
government policy - after ww2 it was encouraged to fill job vacancies especially to fill labour shortages in northern textiles factories
what causes cultural change
can be caused by a changing mix of ethnic groups. initially caused by immigration. cultural change is deepened if immigrants become concentrated in particular places or if rates of natural increase are higher than average. as second and third generations of immigrants move out to a new place, culture continues to change
dissemination (spread) of a new cultural by mass media. modern communications are promoting and spreading an international culture or lifestyle. media are exploiting western culture rooted in Europe and north America, focussed on consumerism, democracy snd technology (westernisation)
2 process of cultural change leading to gradual erosion of traditional culture
immigration of various ethnic groups
concentration in particular places, mainly urban
subsequent dispersal and dilution with generational shifts
gradual cultural erosion
global culture
first roots in capital and leading cities
media responsible for rippling out to remoter places
gradual cultural erosion
what is assimilation
when people from a different cultural or ethnic group arrive in the uk they will be exposed to national core culture and they will likely assimilate and over several generations they will likely assume some of the core cultural values. cultural assimilation works both ways. the national core culture will also take in some of immigrant culture
the difference between a space and a place
a space is a geographical point on the earths surface
a place is a space with meaning and is dynamic and constantly changing and can be perched differently
how urban areas are perceived: case study London
perceptions are on a continuum and are influenced by personal experience
London
the Industrial Revolution caused major uk cities to grow. this rural urban migration was based on the perception that the good life was to be found in urban places. however this perception generally overlooked the downsides of living in victorian London, as a result other perception that urban places were dangerous and polluted soon grew.
causes of industrialisation in London
textiles, especially cotton became the main export of London
the population increased from 1 to 5 million. this rapid urbanisation produced overcrowded slums
soon the population was too large for the infrastructure London had
social impacts of industrialisation
overcrowded slums with appalling conditions
no money was directed towards helping the poor
many struggled to survive
children as young as 5 were sent to work
working conditions were dangerous and unhealthy
general health suffered and led to disease outbreaks
life expectancy was 37
high crime rates
met police was founded which improved order
built new homes for w/c
environmental impacts of industrialisation
coal fired stores and poor sanitation made the air heavy and oful smelling
raw sewage was dumped in the thames
slums had poort hygiene
constructed new sewage system to divert sewage out of the city
economic impacts of industrialisation
Industrial Revolution brought economic growth and technological advances and provided jobs
changing perceptions of London
London is perceived by many as an irresistible magnet drawing in migrants from overseas and from other parts of the uk
because of a wide range of employment opportunities, the range and quality of commercial and social services, amenities, more social security and employment rights
what is the reality of lived experience in urban areas
high living costs - wages are generally high but living costs are significantly higher
low environmental quality - unsatisfactory housing, atmospheric pollution, noise and light pollution and antisocial behaviour
crime - crime rates are higher in urban areas, ONS found that rate of violence was 9.3 per 1000 people higher in urban areas, varies with urban areas and the met police recorded knife offences as up by 16% to 12,755 year on year
social isolation - newly arrived immigrants initially have feelings of exclusion bu these feelings cn be diluted by assimilation in UK society and social clustering, and socio-economic segregation
ethnic diversity - minority ethnic groups continue to be socially clustered and residentially segregated. there is still racial discrimination. tensions can build within communities
what is the life cycle
the idea that most families or household go through a sequence of changes in their lifetime, which are particularly significant in terms of housing needs and moves. their perception of a place changes depending on what stage they are at. characterised by changes in household size, composition income and spending patterns. as households progress through the life cycle, they experience socio-economic impacts that influence their behaviour, attitudes and decisions. has four stages
formation stage
Individuals form households, either by marrying or cohabiting, or by leaving the family home to live on their own.
This stage is characterized by low income, high housing costs, and a strong desire for mobility and independence.
Young households in this stage often live in urban areas, attracted by the opportunities for employment, education, and social interaction that these areas provide.
growth stage
Households are typically established and growing, with children being born and raised.
This stage is characterized by increasing income, declining housing costs, and a growing desire for stability and security.
Households in this stage often move to the suburbs in search of larger homes and more space, as well as improved schools and safe neighbourhoods for their children.
mature stage
Households are often established and well established, with the children having grown up and left the home.
This stage is characterized by a decline in income, a return to higher housing costs, and a greater desire for convenience and accessibility.
Many households in this stage return to the city, seeking to downsize their homes and take advantage of the walkability, cultural offerings, and services that are more readily available in urban areas.
dissolution stage
Households are typically smaller and may consist of elderly individuals living alone or in nursing homes.
This stage is characterized by declining income, declining housing costs, and a growing desire for accessibility and support services.
Many households in this stage choose to remain in the city, seeking the accessibility and services that are available in urban areas.
how perceptions change with life cycle
Along the household life cycle, perceptions of urban areas change as household needs and desires change. For example, young households may view the city as an exciting and dynamic place to live, with many opportunities for employment, education, and social interaction. However, as they move into the growth stage, they may view the city as too crowded, noisy, and dangerous, and prefer the suburbs for their larger homes, improved schools, and safe neighbourhoods.
Conversely, as households move into the mature stage, they may view the city as more convenient and accessible, with a wide range of cultural offerings, walkable streets, and services. In the dissolution stage, households may view the city as a place of safety, with a higher level of support services available, such as hospitals and nursing homes, and a greater sense of community and support.
how rural areas are perceived stereotypically
rural areas are perceived as idyllic, within nature, attractive landscape and scenery, no pollution of any kind, peace and quiet, and easy access to services ‘the rural idyll’
e.g. Burley, New Forest
rural reality 1. remoteness
takes too long to travel to and from other places
too far from work and leisure opportunities
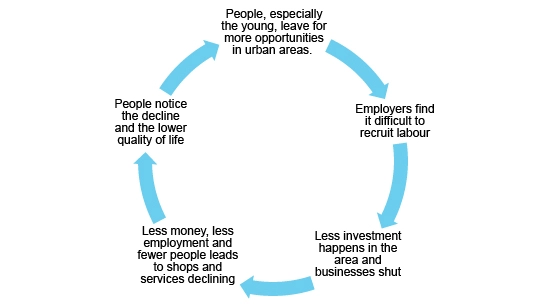
rural reality 2. limited opportunities
could trigger a cycle of decline which is self-reinforcing and difficult to reverse
rural reality 3 limited range of services
people is rural areas often travel further to access services and facilities that urban dwellers take for granted
rural services desert - areas with very low access to services
country puns are less common than they once were due to less customers which can lead to less social cohesion
rural services are more vulnerable to government cuts as it is more expensive to provide services in rural areas than in urban areas, even if they are being run efficiently. e.g youth clubs, libraries, GP surgeries and bus services
rural reality 4. housing
housing may look rustic and attractive but is often old but might not be able to be future proofed or adapted to support disabled access
high running costs - inefficient insulation and high energy costs
rural reality 5. technology
ability to access internet is increasingly important
many retired people are frightened by and have no first hand experience of this technology
patchy or non-existent phone reception
rural reality 6. social isolation
when people move for retirement it can be hard to socialise
it can be difficult for new people to break into existing rural community networks
categories of rural areas diagram

comparing different areas on diagram
commuter belt
fast rates of pop growth, partly due to the arrival of workers and their families who are keen to escapes downsides of urban areas.
high housing costs
mainly working adults and their kids
pop growth fuelled by natural increase, high fertility rates and average mortality
accessible rural
mainly retired people who either moved from the city or lived there, their whole lives
high migration rates but primarily white British however still large numbers of ethnic minorities
people are drawn there due to idealised stereotypes and recreation opportunities. this creates tourism jobs
now are being developed and expanded if not protected
remote rural
suffered from depopulation this leads to the spiral of decline
young people who are economically active and leaving for work
people may be moving to these areas due to counter-urbanisation and modern tech means people can work from home but young people are still leaving snd not being replaced
contrasting perceptions of commuter villages
youth
postives - good schools, plenty of friends
negatives - parents preoccupied with work
middle aged adult
positives - pleasant location to bring up family
negatives - rising costs of housing
elderly
positives - good access to social services
negatives - high housing costs, increasing number of commuters
contrasting perceptions of day tripper villages/accessible rural
youth
postives - casual work in leisure and tourism
negatives - difficult to socialise with friends
middle aged adult
positives - good to visit
negatives - limited employment
elderly
positives - plenty of people around
negatives - too busy in honeypot locations
contrasting perceptions of remote villages
youth
postives - good outdoor recreation
negatives - little entertainment, not cool, too quiet
middle aged adult
positives - good holiday places
negatives - poor communications, expensive accessibility
elderly
positives - quiet and peaceful
negatives - small number of friends
case study on Cornwall perceptions based on age
youth
postives - tourism provides holiday work and entertainment
negatives - very remote, no rail links, limited social opportunities, limited range of services and few permanent jobs
middle aged adult
positives - high sunshine hours and warmer lcimate, tourism provides jobs and good work life balance
negatives - lack of commuting opportunities, limited services, high transport costs, more storms which cause damages. people buying second homes will raise prices for young people, forces the out
elderly
positives - retirement villages with medical care, entertainment and flats in one place for people over 55
negatives - poor health services with limited hours, can’t get transport to hospitals due to a lack of buses, limited social opportunities and retirement villages are expensive to live in.
different representation of places influencing local tensions
change can become the generator of tension and conflict
gentrification and socio-economic change can cause tensions because of increased house prices (from DFLs)
influx of minority ethnic groups
social clustering and residential segregation
building new houses on Greenfield sites to accommodate increasing population
decline in public services, particularly in rural areas
perceptions of places are strongly conditioned by the media, are often two sides, real and imagined
London’s multiculturalism presented in the media
guardian presented minority ethnic groups as the victims and the police and racial profiling as the problem
whereas right wing media said that immigration was the problem and white working class people are the victims to a loss of a community.
general characteristics of people moving in and out of London
In - young, no children, ethnically diverse and often qualified
Out - families, older, white British retiring to other parts of the uk
what does it mean if internal migration is zero sum
any positive net migration in one area can only happen if there is negative net migration in another area
impacts of positive net migration
larger skilled workforce
multiplier effect (more spending)
more culture and entertainment
more public services
higher property prices
air pollution
congestion
more competition for jobs
overcrowding
multiculturalism
impacts of negative net migration
brain drain
closure of public services
less competition for jobs
unbalanced demographic
ageing pop
lower house prices
clearer air
less congestion
more green space
internal migration in UK: factor 1 - north south drift
movement of people form north to south east
high levels of unemployment pushed workers towards jobs in tertiary sector. increased with deindustrialisation in the north
reinforced by the perception that quality of life is better in the south
internal migration in UK: factor 2 - suburbanisation
movement from inner city to suburbs
better quality of life, more space to raise families while still be able to commute
internal migration in UK: factor 3 - counter urbanisation
movement from urban to accessible rural and remote rural
some hope it will reverse north south drift
fuelled by covid as people realised they could work from home anywhere in the country
migration to London - Wave 1
The first wave of immigration into London in the 20th century was from the British colonies and dominions. Following the First World War, many people from the Caribbean, India, and other parts of the British Empire came to London to work and study. These immigrants brought with them new cultures, traditions, and cuisines that greatly enriched the city's diverse cultural landscape.
migration to London - Wave 2
The second wave of immigration was from Eastern Europe after the Second World War. After the Second World War, there was a huge demand for labour to help repair the huge amount of bomb damage and help the economic recovery. In the UK, as in most other parts of Europe, the labour shortage was made worse by the fact that so many people, particularly men, had been killed fighting the war. Many Jews who had survived the Holocaust and other refugees from Eastern Europe came to London, seeking a new start and a better life. These immigrants brought with them their unique cultural traditions and helped to shape the city's thriving Jewish community.
migration to London - Wave 3
The third wave of immigration into London was from the Caribbean and other parts of the world in the 1950s and 1960s. This wave was prompted by Britain's need for labour after the war and the introduction of the National Health Service and other social programs. Many immigrants from the Caribbean, Africa, and Asia came to London to take advantage of these opportunities and to escape poverty and political unrest in their home countries.
migration to London - Wave 4
The fourth wave of immigration into London was from the EU, particularly after the enlargement of the EU in 2004. The collapse of communist regimes in Eastern Europe released huge numbers of people ‘hungry’ for work and a decent wage’. In 2004, eight of these former communist countries joined the EU (known as the A8 countries). Their inhabitants were then able to take advantage of one of the benefits of EU membership – the free movement of labour between member states. In 2007 EU membership increased once again with the admission of two more Eastern European countries, Bulgaria and Romania (known as the A2 countries). This wave was driven by the need for labour in the UK, as well as the desire for greater freedom and opportunities in the EU. Immigrants from Eastern Europe came to London in search of work and a better life.
positive impacts of migration
The impact of immigration on London has been both positive and negative. On the one hand, immigration has enriched the city's cultural landscape and economy, creating a vibrant and diverse community. Immigrants have brought new ideas, perspectives, and skills to the city, making it a hub for innovation and creativity. They have also helped to boost the city's economy by providing a source of labour and contributing to the growth of various industries.
negative impacts of migration
On the other hand, immigration has also brought challenges to the city, such as housing shortages, cultural tensions, and economic competition. The rapid pace of immigration has put pressure on public services, including schools, hospitals, and transportation, leading to overcrowding and limited resources. The rise of anti-immigrant sentiment and xenophobia in some quarters has also led to social tensions and discrimination against immigrants.
the 2008 financial crash led to immigrants being used as a scapegoat for the loss of jobs which worsened xenophobia
social impact of migration: impact on migrants
many migrants are subject to racial harassment and discrimination
many unskilled migrants, especially those being trafficked, quickly becoming the victims of severe discrimination and exploitation
many migrants do unpleasant jobs
often paid poorly an below minimum wage
cannot afford basic costs of living
arrival of immigrants has contribute to uk economy and has had lasting contributions to uk society and culture
pressure on services due to overpopulation
uk born workers have to compete
eu migrants contribute more in taxes than they receive in benefits
social impact of migration: political impacts
central focus of last 3 general elections
current labour government announced plans to limit migration by introducing tougher visa rules
international migrants in rural areas
some international migrants choose to live in rural areas for specific reasons. however very few immigrants actually live in rural areas but many work there. the migrants involved in rural employment often have little choice and are driven there by economic circumstances and the labour market.
case study: Boston, Lincolnshire
has the highest percentage of eastern European immigrants in the UK. In 2021 had 23.6% of people were non UK born
migrants are drawn by jobs and are attracted by the fact they can work long hours and earn more than they could in Poland
these jobs are often shunned by UK citizens
in many cases they are being exploited and have no trade union protection. local farmers like cheap labour and migrants like lower costs of living.
Boston now has specialist services like a Lithuanian supermarket, polish restaurant, polish pub and Lithuanian cake shop.
Boston demographics: young population, lower wages, higher rent, increasingly diverse, immigrants are well educated, if they can’t speak English they are exploited.
Boston has elected Reform’s Andrea Jenkins as Lincolnshire’s mayor. very anti-immigration, said they should live in tents. this reflects the viewpoints of the area
how does international migration contribute to ethnic segregation
migrants arrive in UK, immediate needs of food and shelter, initially go to places where earlier migrants from same source country live, migration to this place gathers momentum, groups of migrants come to be the predominant population in this place, this is social clustering, also known as an ethnic enclave.
London Borough’s diversity
Camden - 15% or more Asian/Asian British population
Greenwich - 15% or more Black/Black British population
Croydon - both
economic factors that lead to ethnic segregation
employment taken up by immigrants is often poorly paid
little income to spend on housing
immigrants settle in poorer areas
social clustering
internal factors causing spatial segregation
internal factors are when ethnic minorities themselves opt for spatial segregation
providing mutual support via families, welfare and community organisations/shops
encouraging friendships and marriages within ethnic groups or reducing contact with majority population that may undermine their culture
providing protection against racist abuse and attacks from members of the majority
increasing political influence and power in the area
allows more opportunities to use minority language
external factors causing spatial segregation
external factors are when the majority population take action to encourage spatial segregation
migration of majority out of area with high minority population
discrimination in the job market, more likely to be unemployed
discrimination by house sellers
social hostility/unfriendliness from majority
racially motivated violence.
elite migration in London
When USSR collapsed almost 100 Russians became billionaires, they are politically powerful people known as oligarchs
they are now buying property in London
they have invested in property to protect their wealth against their country’s crumbling economy
example of internal segregation.
oligarchs are not the only people buying property, Russian banks are not trusted so people keep their money in a haven like the UK. Most Russians do not live here but transfer the profits of their businesses in the UK
e.g two properties in London, frequently named as one of Britain’s most expensive postcodes, were bought for £16 million. but they now lie derelict because the Ukraine war means properties cannot be sold or rented or visited and as a result are in a state of disrepair which impacts the whole street.
Russians own around £1.5 billion worth of property in London
ethnic indicators in the urban landscape
businesses
shops
faith schools
places of worship
restaurants
cultural festivals
newspapers
social clubs
Southall: case study
borough in Ealing, in west London
high proportion of Asian people
more precessions, celebrations, and festivals due to size of ethnic population
settled near Heathrow for economic reasons of lower house prices because it is further out of the city
how ethnic enclaves affect perception of place
ethnic enclaves strengthen positive perceptions of place as people living in them feel belonging then as time passes migrants move out of ethnic enclave because they feel more confident in their new society and have assimilated, they move because of the perception of higher earnings elsewhere.
Jewish migration into UK
¼ million migrated in last 200 years
initial pull was a life free of discrimination and persecution, and they could earn a living from their commercial and professional skills
settled in east end due to lower cost of housing
perception of London has changed over time as new generations have developed their own hybrid cultural identity while often progressing economically, which led to them moving to wealthier suburbs and assimilating.
now are facing hostility due to Gaza war which means their perceptions of London are becoming negative due to fear of persecution.
stats about how lived experience of minority differs to majority
twice as likely to be unemployed 12% compared to 6%
half as likely to own their own home
muslim children are 3x as likely to live in a crowded home
twice as likely to have no central heating
Pakistani and Bangladesh people suffer twice as much ill health.
Central Park, Manhattan, New York
one of the highest land values per square kilometre in the world
extremely desirable so if land use changed it would cause conflict and competition for land.
competition for land
businesses want to use it for offices/shops
retail stores and offices can bid highest, recreation and housing cannot bid as high unless governments get involved through planning laws that prioritise other land uses like housing
residents and council want to use it for housing
further tensions caused by using land for housing
should it be owner-occupiers, to rent, affordable housing or social housing
types of housing
owner occupied - owners of house live there with or without a mortgage
property developers - companies that build houses
affordable housing - dwellings build by housing associates for sale at below market prices for first time buyers
social housing - dwellings often owned by local authorities built to provide accommodation at affordable rents to people on low income
gentrification
when richer people move into a low income area and drive prices up
causes of tensions within a place
changes of land use
migration
closure of independent shops and replacement by international chains - loss of economic growth and character
new housing development
gentrification
people displaced by road improvement
Pepys Estate Deptford
1869 - most important dockland, bombed badly during ww2. bulldozed and rebuilt as social houses consisting of three 24 storey tower block, ten 8 storey blocks and several 4 storey blocks. housing 1200 households.
became a popular place to move, people lived there for over 30 years due to riverside location and stunning views
however residents struggled to adjust to living in flats and the long dark corridors became crime corridors with frequent muggings and fear of crime increased and was also subject to vandalism and antisocial behaviour
in 2000 five blocks of the estate were regenerated into local new high quality home. led to rising rents which led to long term residents being priced out and replaced by affluent newcomers.
regenerating London Docklands
needed regenerating because the global shift and deindustrialisation cause the closure of the docks because containerisation meant the large ships could not longer fit in the docks. this triggered a cycle of decline
the LDDC’s main objective was to encourage economic growth
there were tensions between the LDDC and local council because the council wanted affordable housing and work for local people
LDDC thought the whole community would benefit because of trickle down economics which means the high earning jobs would create other jobs this would lead to wealth trickling down to poorer communities
Canary Wharf did grow employment however the majority of these are commuters so poverty is still present. 27% of Newham’s working population live on less than £7 a day.
Glasgow - diversity creating tension
remains a poverty hotspot despite large amounts of investment
15% of the most deprived areas in Scotland are in Glasgow
people in these areas feel they have missed out on investments have benefitted other parts of the city
this creates hostility and tension towards governments
the most deprived areas are also the most ethnically diverse
ethnic diversity has increase significantly from 2001-2011
Some white British residents feel the higher concentration of EM is due to high rates of unemployment, no investment, dilution of Scottish culture and are largely anti Islamic due to terror attacks like 9/11
These real or imagined beliefs generate social tension and many African and Asian people feel they are not wanted and this is reinforced by their poverty and sense of helplessness in trying to break out the deprivation cycle
How geographers manage ethnicity
outlawing discrimination
Assimilating minority ethnic culture
Ensuring immigrant cultures are respected
Conserving cultural heritage
How geographers manage migration
reducing tensions between newcomers and long-standing residents
Stemming unwanted flows of migration
Managing immigration
Improving border security
How geographers manage population structure
encourage a youthful population
Coping with an ageing population
Raising life expectancy
How geographers manage quality of life
improving access to housing
Improving quality of housing
Providing healthcare and education
Reduce poverty and deprivation
Improving the living environment
Steps in the management of change
Identify the issue
Forecast how the issue would change in the near future without intervention
Draw up a management plan with a strategy of specific actions to take
Implement the plan
Monitor performance
Evaluate the performance of the plan
Revise plan
Demographic indicators of social progress
total population
Migration balance
Age structure
Life expectancy
Ethnic mix
Family size
Economic indicators of social progress
type of employment
Unemployment rate
Household income
% minimum wage
% on benefits
Dwelling tenure
The index of multiple deprivation
composite measure
Look at spatial inequalities between and within urban and rural places
Looks at crime, unemployment, housing barriers, education, health and income
Measures of assimilation
Economics
mapping changing residential distributions
Amount of mixed ethnic marriages
Comparing wages of ethnic groups
Political
assessing engagement in politics
Assessing % of minority groups voting at elections
Assessing people standing for election
Social
incidence of hate crimes
Muslims in London
strong identification with religion however it is compatible with their identification as uk nationals
There was no strong desire to segregate residentially
Does not stop them from condemning attacks on civilians carried out by Islamic extremism
Integration
a midpoint between assimilation and multiculturalism which is incorporating individuals or groups while allowing them to maintain their unique cultural identities
English speaking, no discrepancy in levels of education, high rates of employment, participating in policies, celebrating national holidays with integrity
what drives the housing crisis in Oxford
limited housing supply
high student populatiomn
short term rentals for tourism (airbnb)
lack of social housing
economic inequality
how housing developers and Oxford city council responded to the crisis
housing developers
facing challenges due to the availability of land and the slow and bureaucratic local planning process
developers can capitalise of high property values and strong demand for luxury houses although they may face backlash as this limits the amount of affordable housing that can be built
Oxford city council
faced criticism for slow response and for prioritising interests of developers over local community
are under significant pressure to put regulations to ensure affordable housing is built, however, this could negatively impact the economy as there will be less availability for tourism.
social factors of Oxford housing crisis
increase in homelessness as people are unable to afford rent or mortgages
can also affect access to education as students may struggle to find affordable housing close to uni so are forced to commute long distances, affecting their academic performance and overall experience
people are forced to live in overcrowded and inadequate accommodation which can lead to poor physical and mental health
negative affect on children’s health and wellbeing
economic factors of Oxford housing crisis
has made it difficult for businesses to attract and retain staff, particularly in low paid industries as cost of living is high
rise in living cost means people cannot afford basic necessities
low income earners are forced to rely on housing benefit which can put a strain of government finances and lead to higher tax burdens for taxpayers
a rise in inequality which those on lower incomes struggling to find suitable housing and those of higher incomes able to afford expensive homes