Sound and Perception
1/16
There's no tags or description
Looks like no tags are added yet.
Name | Mastery | Learn | Test | Matching | Spaced | Call with Kai |
|---|
No analytics yet
Send a link to your students to track their progress
17 Terms
Tutorial 1
Waveform: x-axis represents time, y-axis represents amplitude Quiet sounds: everything is flat, doesn’t change much from the center line Loud sounds: the pattern moves far away from the center line (both up and down) Spectrogram: a lot more information than we can see in the waveform! We can see differences between different vowel sounds that we can’t easily see in the waveform The spectrogram has different grayscale shades from white to black Different speech sounds show different patterns of where areas of dark gray appear on the spectrogram
Psychoacoustics
Perception of objective reality is subjective
What you perceive depends on how you sense
Eg 5 five blind men might perceive an elephant as wall, ladder etc
Physical character of sound
Speech is a type of airflow
From airflow to sound
Light travels from point A to point B Sound propagates from point A to point B
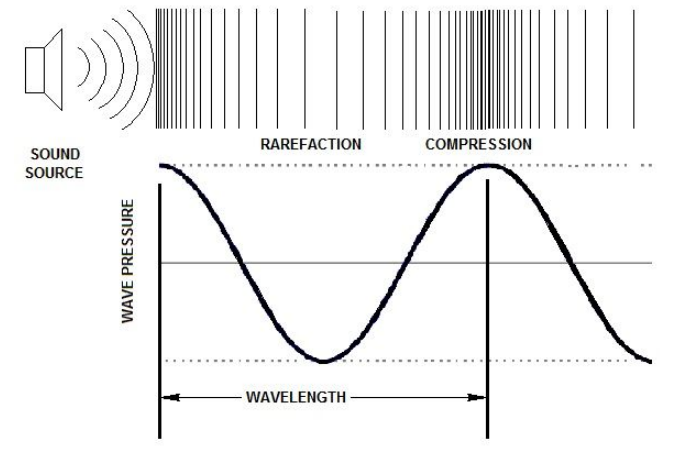
Sound: propagation of air pressure fluctuations
Air pressure fluctuations = a wave!
This pattern of compression (high pressure zones: air particles pressed together) and rarefaction (low pressure zones: air particles spread apart) can be modeled as a wave
Air pressure fluctuations propagate to your ear
Three basic dimensions of speech perception
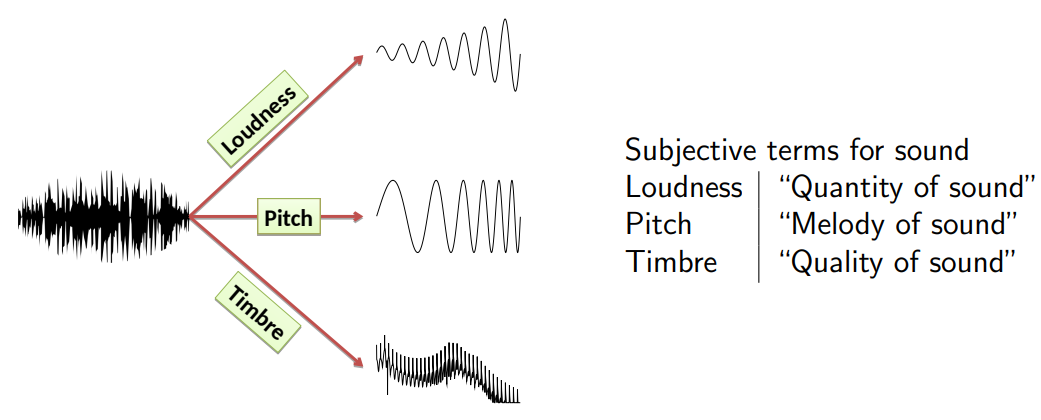
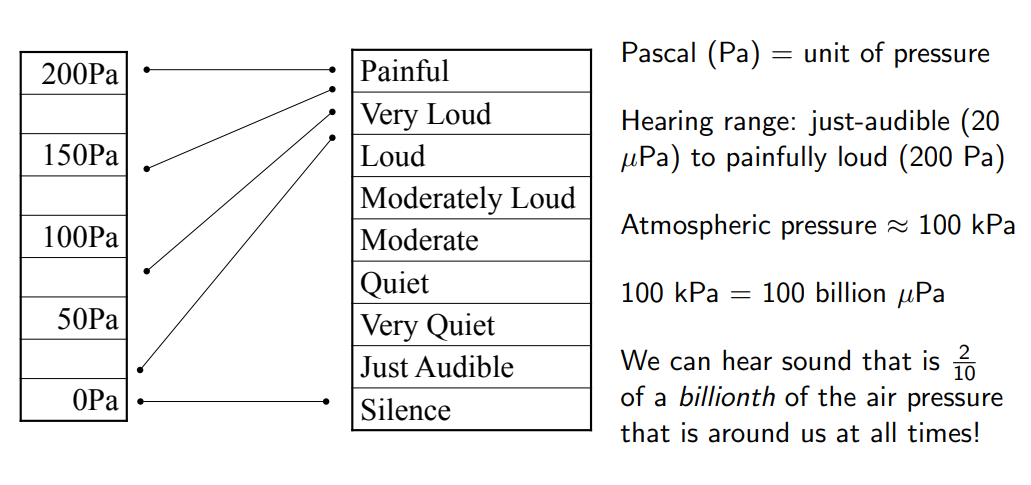
Loudness: “quantity of sound”
Relation between objective and subjective loudness
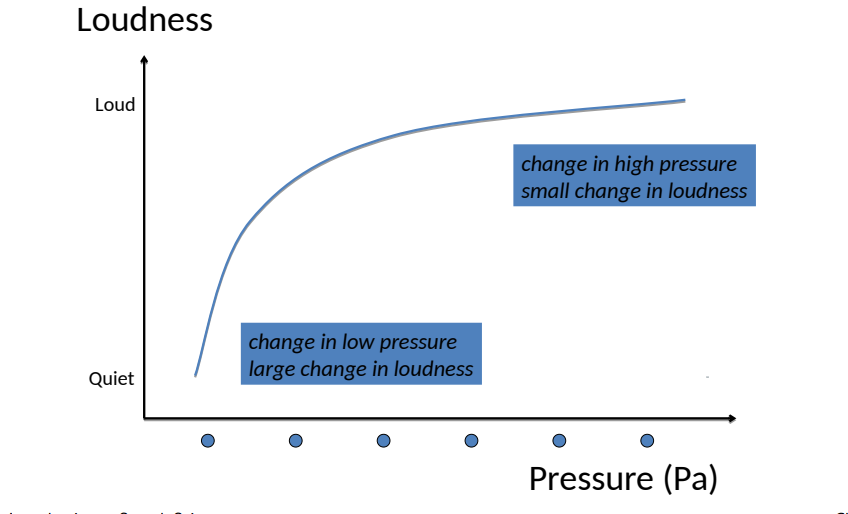
Matching pressure to loudness
Weber’s Law
The increase in stimulus size necessary to produce a just noticeable difference (JND) is a constant fraction of the stimulus size: ∆S ∝ S ∆S = k · S k = “Weber fraction” JND for perception of loudness ≈ 12%
JND= just noticeable difference
Logarithms: the decibel (dB) scale to the rescue!
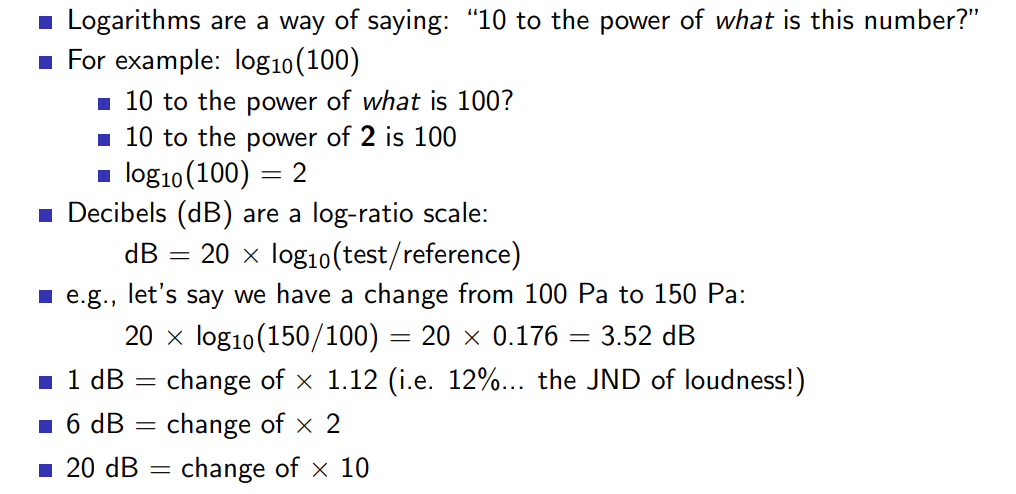
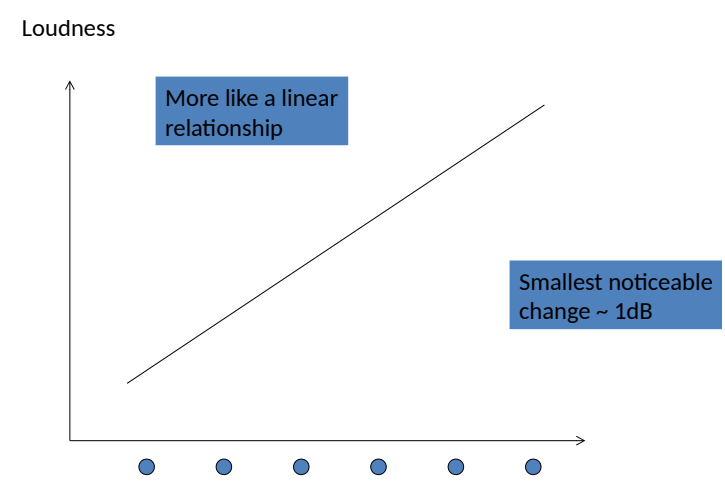
Relationship between objective loudness and dB
The goal is met: objective change = subjective change 0 db = just audible 100 db = loud 1 db change = JND for loudness
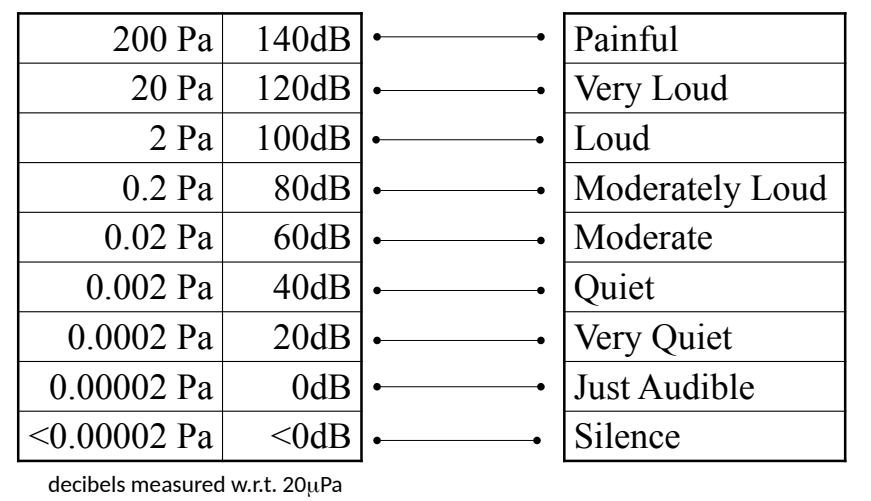
Matching dB to loudness
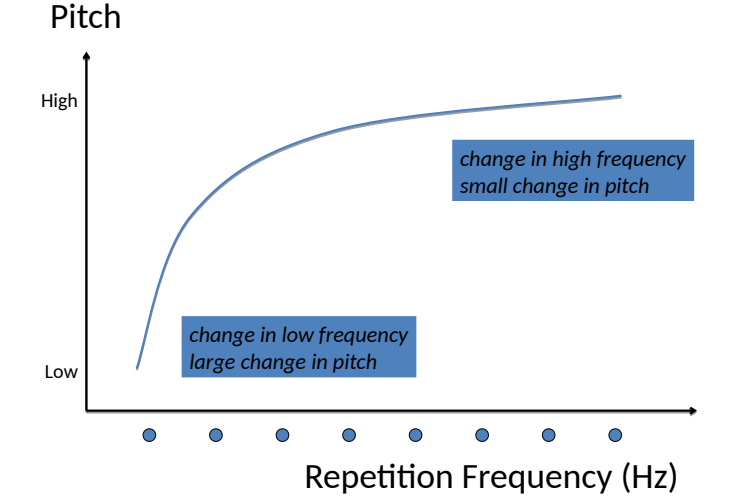
Relation between objective and subjective pitch
Timbre relationship between sound and colour
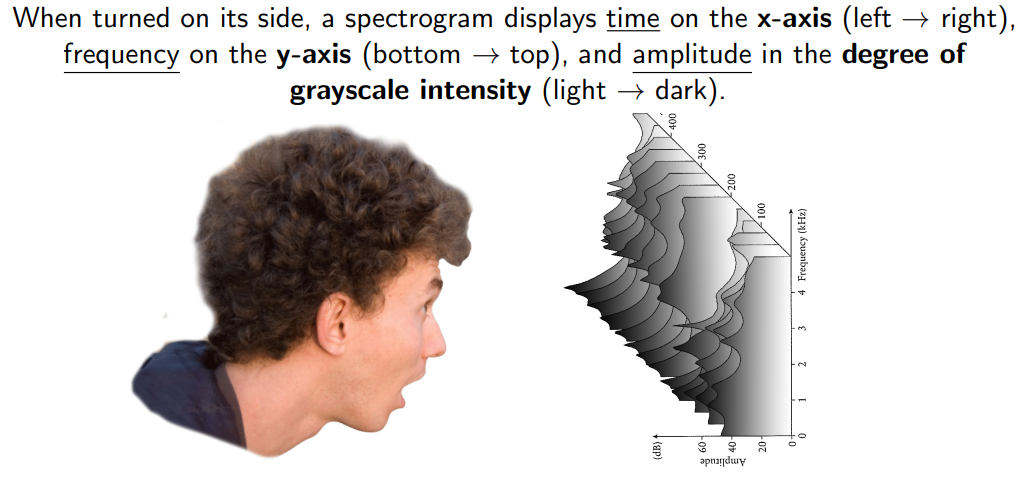
Spectrum to spectrogram
We can view speech over time (speech isn’t frozen in time, after all!) by putting spectra from different time points together in temporal order. This method of viewing speech is called a spectrogram.
A spectrogram provides three dimensions of information: time, frequency, and amplitude. Amplitude is represented by degrees of light-dark gray: the darker the peak, the greater the amplitude.
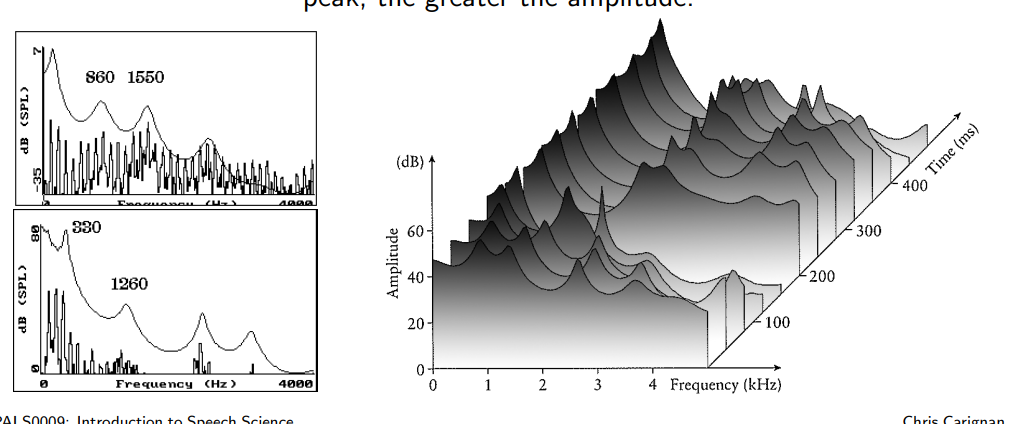
Spectrum → spectrogram (cont.)