Module 5 Textbook readings
1/16
There's no tags or description
Looks like no tags are added yet.
Name | Mastery | Learn | Test | Matching | Spaced | Call with Kai |
|---|
No analytics yet
Send a link to your students to track their progress
17 Terms
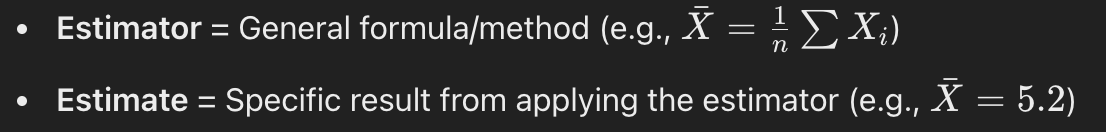
Estimator/estimate
Estimator
is a rule/function that is used to estimate a population parameter based on some sample data
the sample mean Xbar is an estimator of the population mean mu
For a way to calculate the mean weight, we intend to sum 100 almonds’ weights, divide by 100, and use this value to estimate the population mean weight
changes depending on the sample
Estimate
the actual numerical value obtained by applying an estimator to a given sample
Xbar = 5.2, then 5.2 is the estimate of mu
esitmator is formula, does not return a number.
Unbiased vs biased estimator
Unbiased estimator occurs when the expected value of the sample mean is equal to the population mean
on average, the sample MEANS will equal the population mean
Biased estimator is when the sample means is not equal to the population mean
SD in normal distribution
One SD is 68.27%
Two SD is 95.45%
3 SD is 99.7%
(LC8.4) What does the population standard deviation (σ) represent?
✅ B. It measures the average difference between each almond’s weight and the population mean weight.
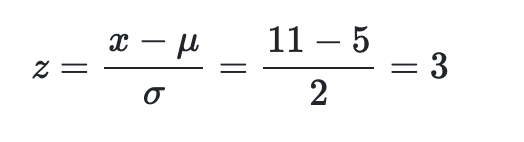
Z score and SD’s
Z score is how far a something is away from the mean in terms of SD
in the picture, if x =11, it is 3 standard deviations above the mean
68% → 1
95% → 1.96
99% → 3
So for a 95%CI, that means that the z-score distance from the sample statistic to the population parameter is less than 1.96
Point estimate vs Confidence Interval fishing example
point estimate is spear fishing
CI is like throwing a net around the ripples
(LC8.6) How is the standard error of the sample mean weight of almonds calculated?
✅ Answer: B. By dividing the population standard deviation by the square root of the sample size.
Sample mean relation to CLT facts
the sampling distribution of the sample mean is approximately normal with mean equal to the population mean and standard deviation given by standard error sigma/sqrt(n)
this is due to sufficiently large samples tending towards the normal
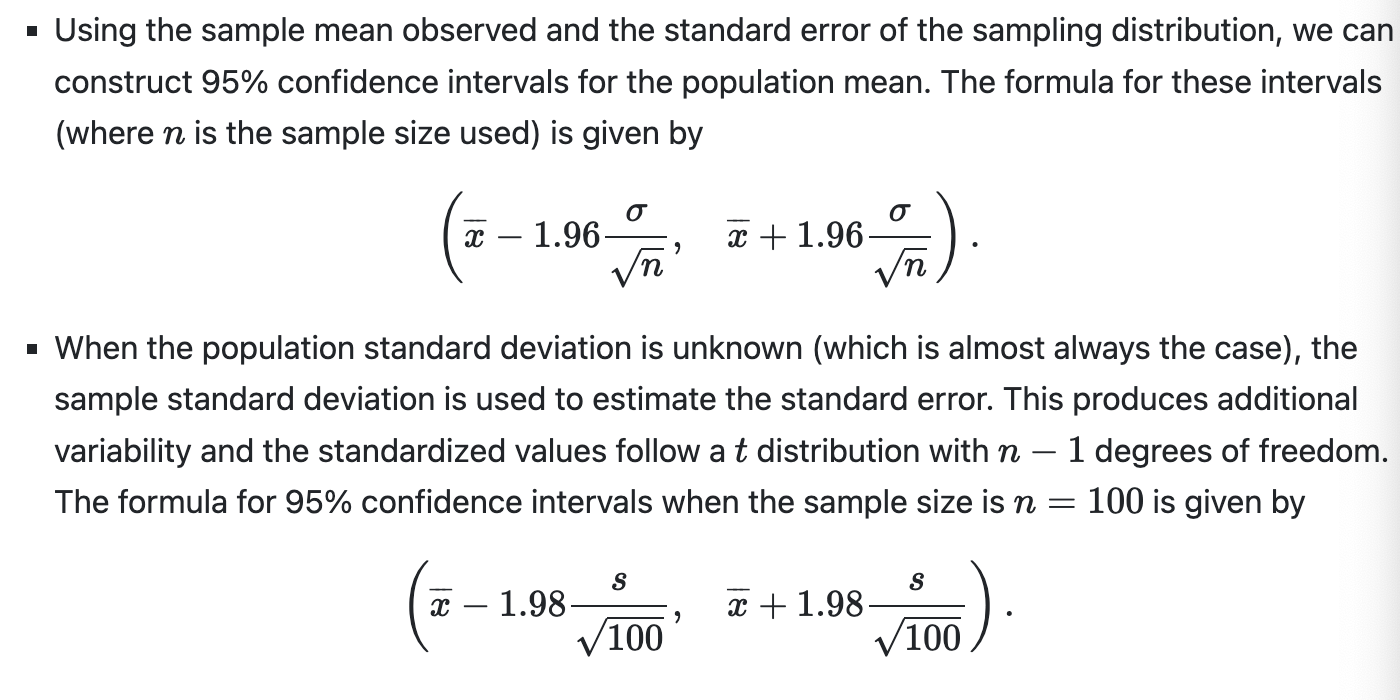
Reason for t-dist, and benefits
required since we don’t know the population SD, must use sample SD
allows us to create a 95% confidence interval based entirely on our sample information using sample mean and sample SD
(LC8.8) Why does the t distribution have thicker tails compared to the standard normal distribution?
(LC8.9) What is the effect of increasing the degrees of freedom on the tt distribution?
D. Because it accounts for the extra uncertainty that comes from using the sample standard deviation instead of the population standard deviation.
B. The tails of the distribution become thinner.
Degrees of freedom for sample mean problems
n-1
Creating a t-dist code and finding lower and upper bounds
almonds_sample_100 |>
  summarize(sample_mean = mean(weight), sample_sd = sd(weight))
almonds_sample_100 |>
summarize(sample_mean = mean(weight), sample_sd = sd(weight),
lower_bound = mean(weight) - 1.98*sd(weight)/sqrt(length(weight)),
upper_bound = mean(weight) + 1.98*sd(weight)/sqrt(length(weight)))Comparison between construction of CI with and wihtout known sigma
95% corresponds to 1.98 in a t-dist since the area becomes n-1 = 99
t_critical <- qt(0.975, df)
qnorm function
used to find the appropriate standard errors in calculations
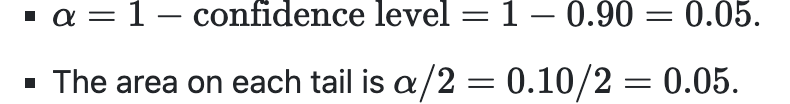
qnorm(%+remaining area of left or right)
or 1-CI for a and a/2 for second part
so for 90% it would be (0.9+0.5) = qnorm(0.95)
Relationship between margin of error and sample size
If the sample size increases, the margin of error decreases proportional to the square root of the sample size. For example, if we secure a random sample of size 25, 1/√25=0.21/25=0.2, and if we draw a sample of size 100, 1/√100=0.11/100=0.1.
increase in sample isze is decrease in margin of error
Why larger samples are better and tradeoffs
larger samples = narrower CI
However creates logistical problems w/ data collection etc.