BOSC3 RM - Demand forecasting
1/58
There's no tags or description
Looks like no tags are added yet.
Name | Mastery | Learn | Test | Matching | Spaced | Call with Kai |
|---|
No study sessions yet.
59 Terms
Common characteristics of forecasting
- Imperfection (rarely perfect, almost always subject to some error level).
- Aggregation Accuracy (forecasts more accurate for aggregated data compared to individual items).
- Time Frame (forecasts more accurate for shorter time periods than for longer ones).
Types of forecasting methods
- Subjective models
- Time series models
- Causal models
Pick up forecasting method
Widely used technique in the hotel industry to predict future demand by analysing historical booking patterns.
This method involves tracking the pace of reservations over time and using this data to project future bookings.
Subjective Model
Delphi Method
- Gathers expert opinions through multiple rounds of questionnaires
- Application: long-term strategic decisions, scarce historical data
- Advantages: Incorporate diverse insights, reduces bias through anonymity
- Disadvantages: Time-consuming, dependent on participant expertise
Time Series Models - Moving averages
Moving Average
- Calculates average of fixed number of past observations to highlight trends.
- Application: Stable data without significant trends or seasonal patterns
- Advantages: Simple to use, effective for short-term forecasting
- Disadvantages: Lags behind trends, not suitable for data with strong seasonality.
Time Series Models - Exponential Smoothing
Exponential Smoothing
- Applies decreasing weights to past observations, prioritizing recent data.
- Application: Data with consistent trends and seasonal patterns
- Advantages: Responsive to changes, adaptable to various data patterns
- Disadvantages: Requires parameter tuning, less effective for irregular patterns
Causal models
Regression model
- Explores relationships between dependent and independent variables to forecast
- Application: identifying cause-and-effect, using leading indicators
- Advantages: Insights into underlying drivers, wide range of applications
- Disadvantages: Requires statistical knowledge, dependent on data quality
Demand forecasting's purpose
To establish selling guidelines and to establish demand criteria for the revenue forecast.
Demand forecasting's strategic orientation
- Identifies excess demand
- Identifies need periods
- Facilitates development of selling guidelines
- May exceed 100%
30/60/90 days out + up to 12 months out
- Produced daily on a rolling basis
- Involves room nights only
=> Represents unconstrained demand
Occupancy forecasting's purpose
To tell operating department how busy the hotel is expected to be.
Occupancy's operational orientation
- Facilitates scheduling
- Shows arrival/ departure pattern
- Provides business mix details
- Allows departments to gage F&B/ other income volumes
- Does not exceed 100%
- 4/ 7/ 14/ 21 days out
- Produce weekly
- Involves room nights only
- Represents constrained demand
Revenue forecasting's purpose
To inform senior management & ownership of occupancy, rate & revenue estimates for the next 3 months and beyond.
Revenue forecasting's financial orientation
- Facilitates cash flow projections
- Facilitates purchasing requirements
- Facilitates mix analysis
- Established by individual market segments
- 30/60/90 days out & beyond as required
- Produced monthly
- Estimates room nights, average rate & revenues
- Represents constrained demand.
4 components of effective forecast
1) Insight
2) Historical data
3) Current data
4) Future data
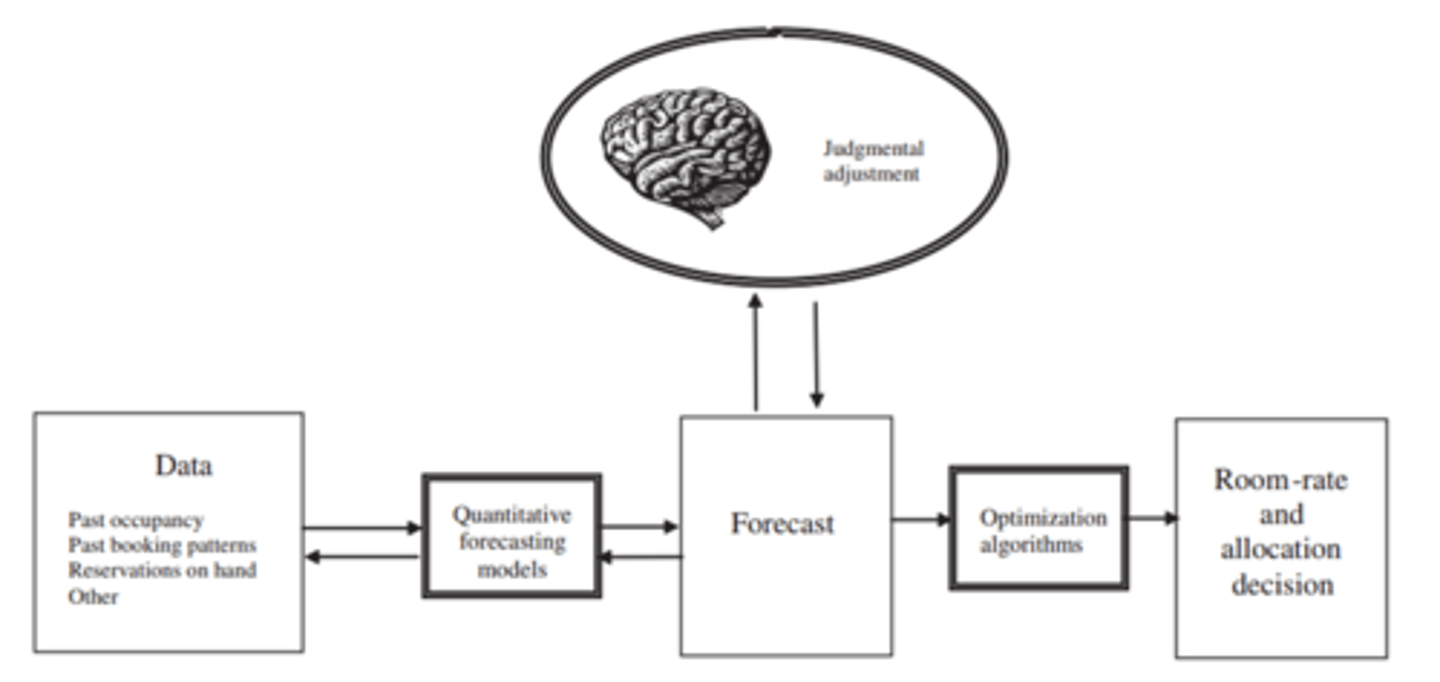
Forecasting process
Unconstrained demand
- Naturally occurring demand that occurs in the absence of restraints and restrictions.
- Level of demand that exist for a given perishable asset (hotel rooms) without reference to the price levels and stay-controls that the seller will ultimately select to constraint it.
Constrained demand
Demand that is held back or confined by rules, restrictions and availability.
Denials
The hotel refuses booking request (sold out, closed to arrival, group block not open, MLOS).
Regrets
Customer does not book (cancellation/ deposit rule too restrictive, room feature not available, rate resistence, too expensive, for information only)
Understanding future demand
- Visits on your website
- Lost Business
- Regrets & Denials
- Price elasticity & sensivity
- Future Demand
- Conversion and source markets
Total demand formula
Total demand = current + opportunity
What is opportunity ?
- Understand demand source markets and price elasticity
- Use data to maximize Revenue Opportunities
- Understand price points
- Grow direct business
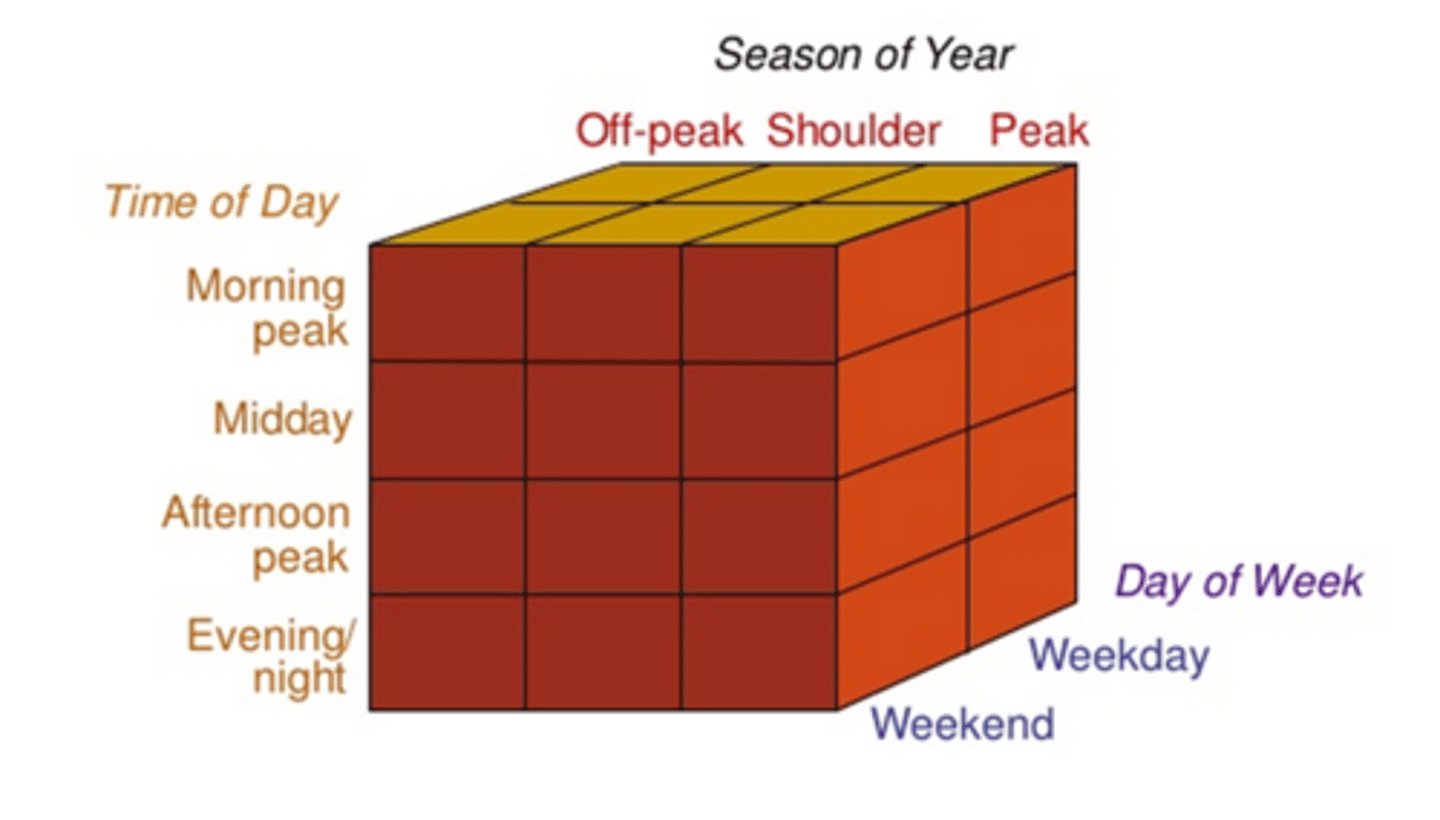
Identifying variations in demand by Time Period
Demand generator
Entity or event that produces a significant increase in business
Demand drain
Circumstance that produces a significant decrease in business
Average Booking Curve
Graphical presentation that illustrates how reservations accumulate over time.
Pickup
Average number of requests to receive between today and the day of arrival (DBA = -1)
- Calculated upon the Pickup Matrix: Average Booking Curve
- To apply when forecasting unqualified transient demand
- One of the most accurate forecasting method on the short run
DBA
Days Before Arrival
Minimum LOS
States that bookings will only be accepted for a specific date if they meet the required minimum stay duration.
- During high-demand periods
- Fill in the hotels immediately after high-demand days
- Application of packages
Maximum LOS
Imposes strict limits on the number of days per reservation for a particular date.
- Right before a high-demand period
- Avoids undesirable stay-overs
- Application of packages
Closed to Arrival (CTA)
States that no additional bookings are to be accepted for a specific arrival date. = Availability control
- Can be used during high-demand times to select reservation requests that will yield a higher average occupancy for that arrival day and surrounding days.
Mean Absolute Deviation (MAD)
Measures how large the deviations are, on average.
For a single item.
Mean Absolute Deviation (MAD) formula
MAD = Actual Arrivals - Forecasted Arrivals
Mean Squared Error (MSE)
Measures the average squares of the error = Average squared difference between the estimated values and the actual value.
More sensitive to large errors by squaring the errors.
Mean Absolute Percentage Error (MAPE)
Measures how large the deviations are on a percentage basis.
Allows to compare hotels of different sizes.
A MAPE value within 5% is considered accurate.
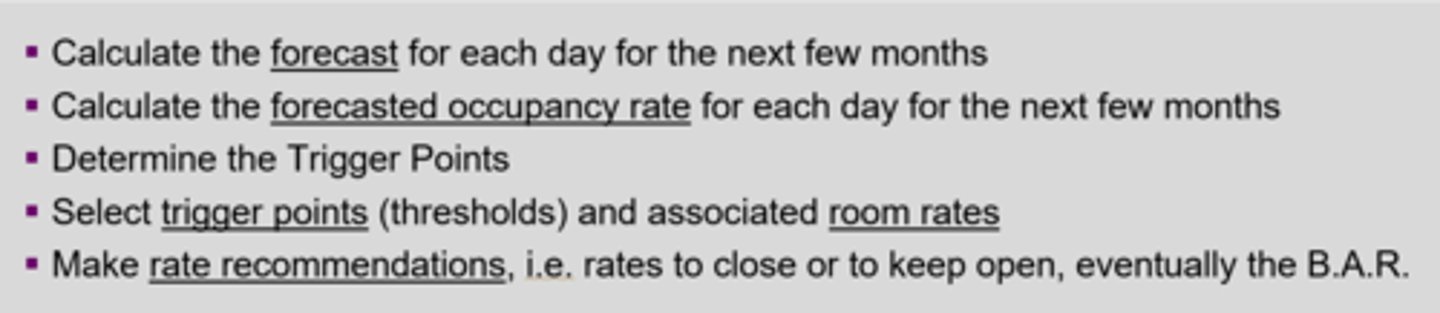
Demand-control chart
Helps decide when to change your rate based on expected demand.
When your forecast, or estimated demand is above a certain level, you will close (or raise) room rates.
Demand-control chart weaknesses
Combines all demand together.
Developing rate triggers is not easy.
8 steps to improving hotel demand forecast
1. Use the right data
2. Segment your forecasts
3. Monitor your hotel website
4. Monitor upcoming events calendar
5. Get to know your competitors
6. Partner with sales and marketing
7. Understand the impact of discounting
8. Check your forecast after the fact
What is the most important data to include to forecast ?
Booking date, rate code, arrival date, departure date and revenue by day.
What do econometrics models do ?
Econometric models try to recognize the quantitative relationship between final bookings data and reservations on hand.
What do pickup models do ?
Pickup models identify the unique features of reservation data and estimate the reservations to receive in the future by aggregating the possible additional reservations.
What is the clustering technique used for ?
It is used to discover underlying structure.
What are the three categories of forecasting models ?
1. Historical booking models
2. Advanced booking models
3. Combined models
What are historical booking models ?
Historical booking models concern only the final number of rooms occupied or arrivals for each stay day in the past.
What are advanced booking models ?
Advanced booking models reflect the pattern of reservations over a booking horizon for a target stay day in the future.
What are combined models ?
Combined models utilize both the historical and advanced booking models, applying either a weighted average or regression, to produce forecasts.
What are the methods that produce the lowest error ?
Pickup method and regression.
Machine learning article
What problem does the study address ?
Traditional hotel demand forecasting (based on past data and "same day last year" patterns) became unreliable after COVID-19. The study aims to create a more accurate and interpretable machine learning model using clusters of booking curves.
Machine learning article
What is the study's main innovation ?
It introduces a cluster-based machine learning approach that groups similar booking curves (based on real booking behavior) and applies the additive pickup model within each cluster to forecast daily hotel demand.
Machine learning article
What are booking curves and why are they important ?
A booking curve shows how reservations accumulate over time before a stay date. It reveals booking speed and behavior, which are crucial for predicting future occupancy and optimizing prices.
Machine learning article
How does clustering improve forecasting accuracy ?
By grouping stay dates with similar booking behavior, forecasts are made using only relevant past data from the same cluster - not from unrelated periods. This eliminates the bias from outdated or irrelevant historical trends.
Machine learning
What is the additive pickup model used in the study ?
It forecasts future occupancy by adding expected new bookings (based on past patterns) to the reservations already on hand. It assumes that future bookings are independent of current ones.
Machine learning article
What accuracy measures were used to compare forecasting models, and what do they mean ?
All measure the difference between actual and forecasted occupancy.
1. MSE (Mean Squared Error): The average of the squared differences between predicted and actual values.
→ Penalizes large errors more heavily.
2. MAE (Mean Absolute Error): The average of the absolute differences between predicted and actual values.
→ Shows the typical size of errors, easy to interpret.
3. RMSE (Root Mean Squared Error): The square root of the MSE.
→ Gives errors in the same unit as occupancy percentage; highlights large mistakes.
4. MAPE (Mean Absolute Percentage Error): The average of absolute percentage differences between forecasted and actual values.
→ Expresses forecast accuracy as a percentage (e.g., 5% error).
5. sMAPE (Symmetric Mean Absolute Percentage Error): A version of MAPE that prevents extreme distortion when actual values are close to zero.
→ Balances over- and under-predictions.
6. MdAPE (Median Absolute Percentage Error): The median (middle) of all absolute percentage errors instead of the mean.
→ Less sensitive to extreme outliers; shows typical error level.
Machine learning article
What did the results show about accuracy ?
Cluster-based forecasts were 8%-33% more accurate overall.
Traditional pickup models performed worse, especially when demand was unstable (e.g., during COVID-19).
Machine learning article
What are the main practical implications ?
- Use cluster-level forecasting instead of one-size-fits-all models.
- Apply this to improve pricing, inventory control, and staffing.
- Especially effective for volatile or uncertain markets like post-pandemic travel.
Machine learning article
What are the main theoretical contributions ?
- Combines machine learning clustering with additive pickup forecasting.
- Proves that disaggregating data by behavior (clusters) improves short-term forecasts.
- Provides evidence that historical similarity ≠ time proximity (similar dates matter more than same dates last year).
What problem did Red Roof Inn face and what was its goal ?
With a small ad budget and low online visibility, Red Roof Inn needed a way to reach travelers most likely to book rooms - especially those stranded after flight cancellations.
What strategy and technology did Red Roof Inn use ?
It built a real-time flight-tracking system that detected cancellations and automatically triggered geo-targeted mobile search ads near airports, showing stranded passengers nearby Red Roof Inn hotels.
What results did the campaign achieve and why was it important ?
The campaign boosted non-brand bookings by 266%, conversion rates by 375%, and CTR by 98% - proving that smart data use can outperform big budgets through precision targeting and real-time marketing.