Chapter 3: Association: Contingency, Correlation, and Regression
1/25
There's no tags or description
Looks like no tags are added yet.
Name | Mastery | Learn | Test | Matching | Spaced | Call with Kai |
|---|
No analytics yet
Send a link to your students to track their progress
26 Terms
response variable (dependent variable)
measures an outcome of a study
explanatory variable (independent variable)
may explain or influence changes in a response variable
association
particular values for one variable are more likely to occur with certain values of the other variable than with other values of that variable
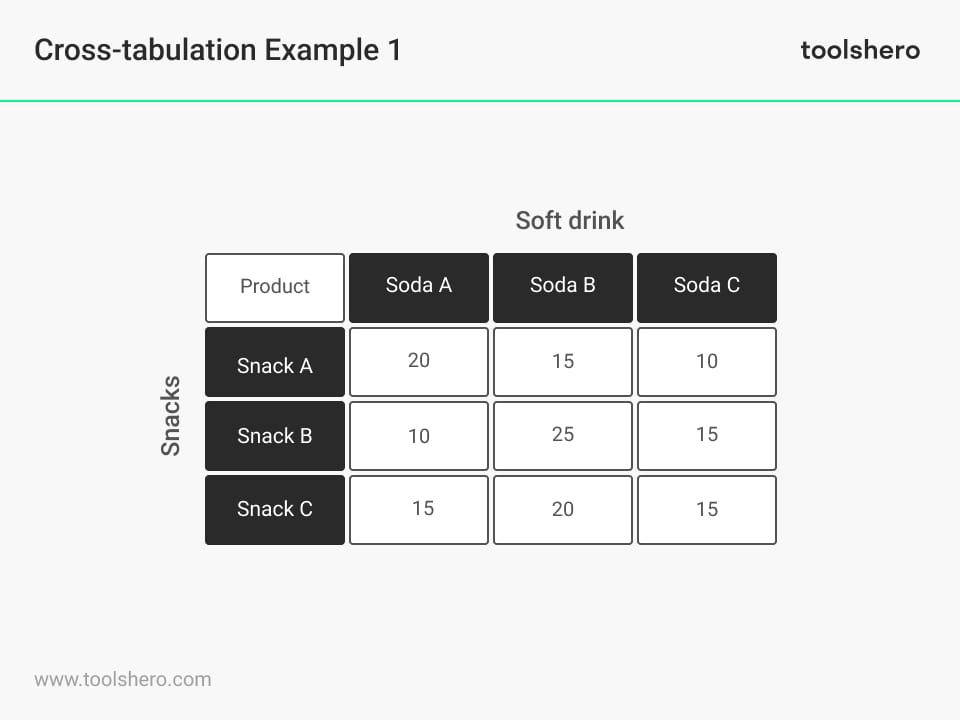
contingency table
that displays the frequency of two or more categorical variables in a matrix format to show the multivariate frequency distribution and relationships between them
marginal distribution
frequency distribution of one of the variables
cross-tabulation
the process of taking a data file and finding the frequencies of a contingency table
conditional distributions
show the distribution of one variable for just those cases that satisfy a condition on another variable
What do conditional proportions refer to?
a particular row (or column) of the contingency table
What do marginal proportions refer to?
the row (or column) SUM of the contingency table
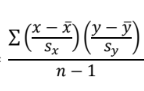
correlation (variable for correlation coefficient)
the strength and direction of a LINEAR relationship between two quantitative variables ( r )
How do you find r? What must r be between?
between -1 and 1
What are the properties of correlation?
*Positive r = positive association, negative r = negative association
*correlation coefficient is between -1 and 1
extreme values (-1 and 1) indicate perfect straight-line correlation
*r has no units
correlation ignores distinction between explanatory and response variables
*correlation only measures strength of linear association
*r is not resistant
correlation only makes sense for quantitative variables
correlation is not a complete description of bivariate data. must state the means and SDs of both x and y along w/ correlation
What does a regression line measure?
the relationship between an explanatory and response variable
regression line
predicts the value for the response variable y as a straight-line function of the value x of the explanatory variable
what is the symbol for the predicted value of y?
y-hat
What is the equation for the regression line?
y-hat = a + bx
What is the equation for error/residual?
Error=Observed-Predicted = y- y-hat
least-squares regression line
the line that makes the sum of the squares of the vertical distances of the data points from the line as small as possible (line of best fit)
slope of a regression line
rate of change, amount of change in y-hat when x increases by 1
intercept of the regression line
value of y-hat when x=0
What is r²?
the coefficient of determination
What sentence about r² did you have to know?
The square of the correlation, r², is the proportion of variation in y that can be explained by the least-squares regression of y on x.
What are the bounds of r²?
between 0 and 1
How do we know if an observation is influential?
If removing it would significantly change the result of the calculation
extrapolation
the use of a regression line for prediction far outside the range of values of the explanatory variable x that you use to obtain the line
lurking variable (extraneous variable)
a variable that has an important effect on the relationship among the variables in a study, but is not included among the variables studied