s1 mistakes + theory [IAL]

0.0(0)
Studied by 0 people
call kaiCall Kai
Locked
learnLearn
examPractice Test
spaced repetitionSpaced Repetition
heart puzzleMatch
flashcardsFlashcards
GameKnowt Play
Card Sorting

1/49

encourage image

There's no tags or description

Looks like no tags are added yet.

Last updated 9:32 AM on 7/11/26
Name
Mastery
Learn
Test
Matching
Spaced
Call with Kai
Chat

No analytics yet

Send a link to your students to track their progress

50 Terms
1
New cards
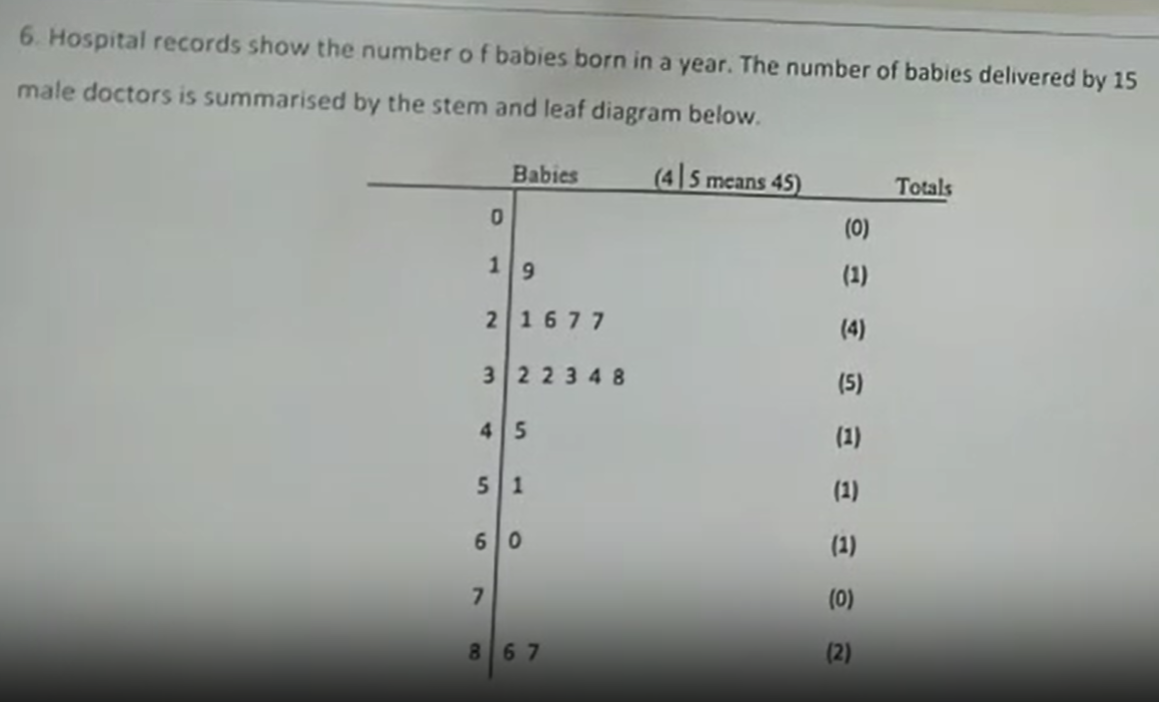
<p>Find the mean and standard deviation from this stem and leaf diagram (4marks)</p>

Find the mean and standard deviation from this stem and leaf diagram (4marks)

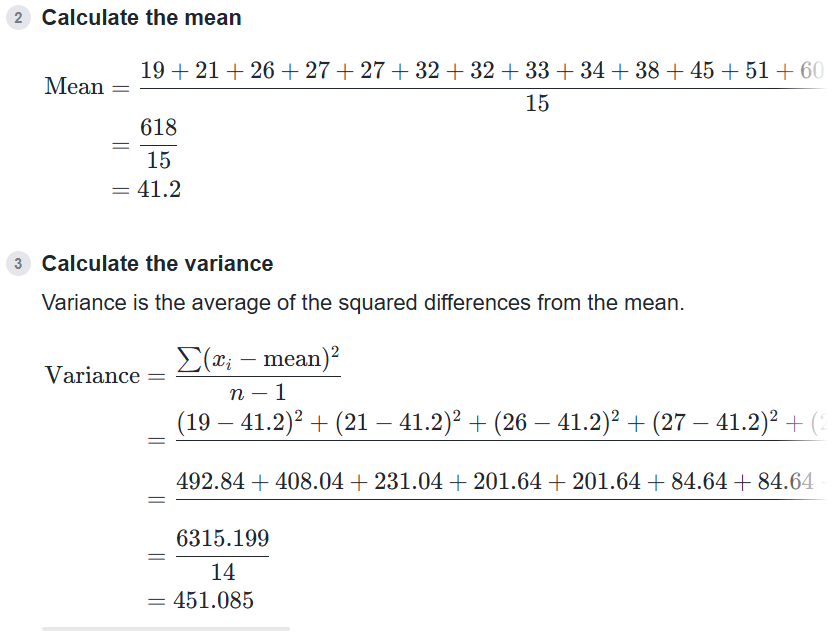
for stem and leaf, use that formula of S.D.

s.d = √451 = 21.2
<p>for stem and leaf, use that formula of S.D.<br><br>s.d = <span>√451 = 21.2 </span></p><p></p>
2
New cards

Give 2 advantages and disadvantages of using statistical models

advantage:
- it helps make predictions
- they are quick and easy to make/produce
(they can simplify a complext situtation)

disadvantage:
- simplifying a model may result in error as they only give partial description of the real situation
- the model may only work in certain conditions


(NOTE: a mathmetical model is a simplification of a real world situation)

3
New cards

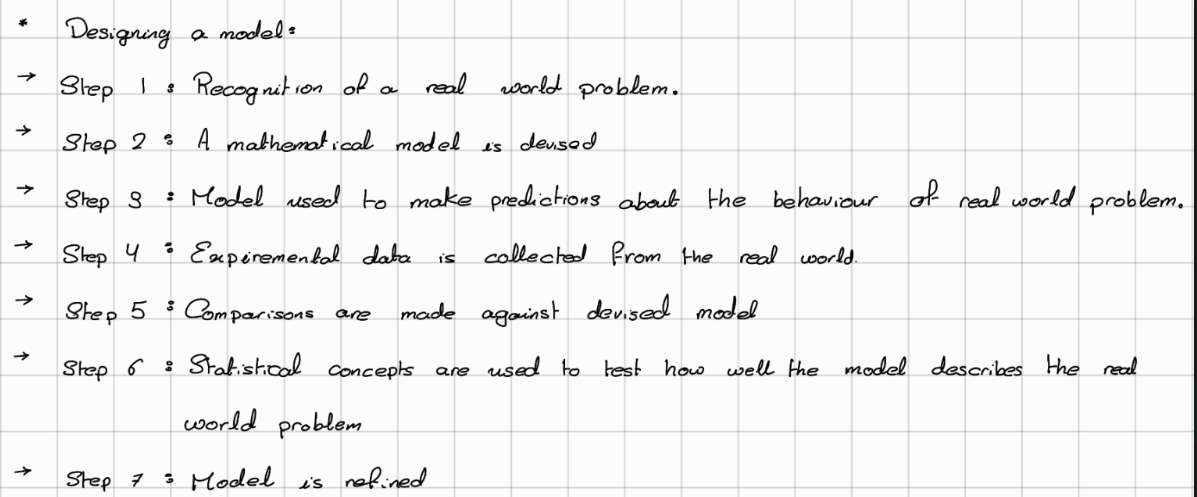
steps for designing a statistical model
knowt flashcard image
4
New cards
term image

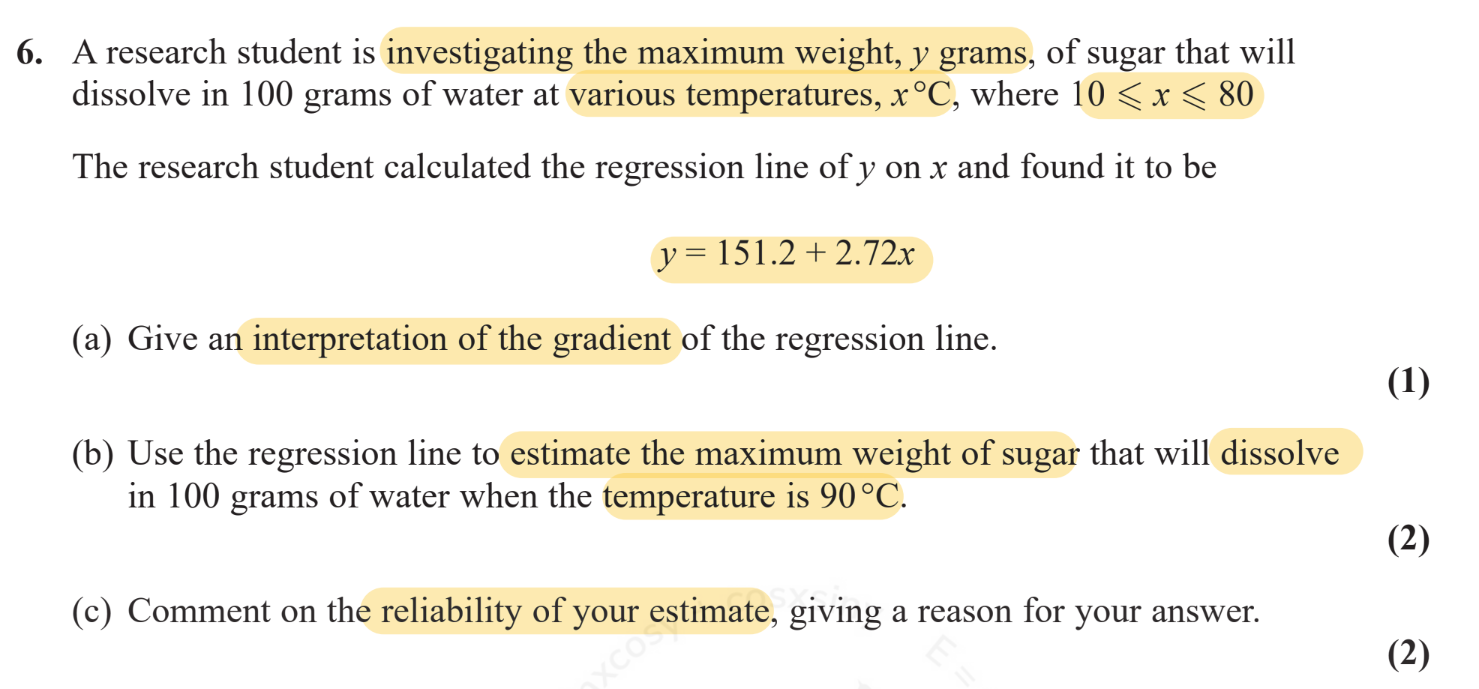
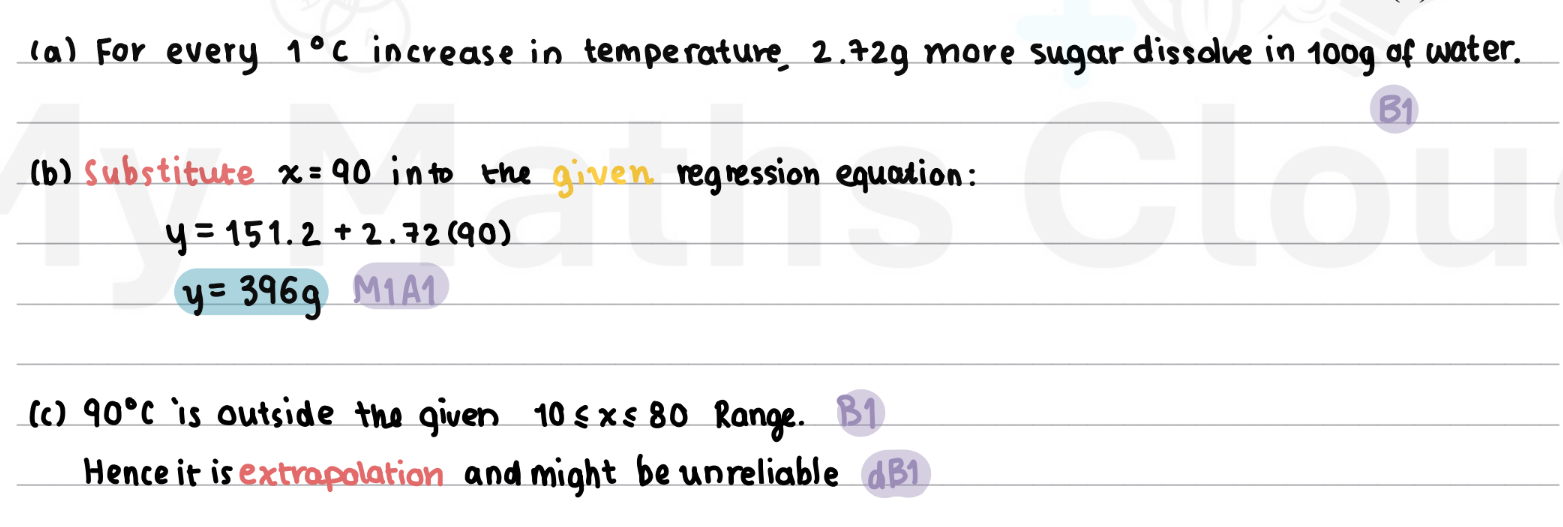
(a) interpret the (gradient of) regression line/ =
for every increase in x by 1(unit), y increases by gradient (unit)

(b) easy, got it right.

(c) ALWAYS CHECK IF VALUE INSIDE OR OUTISDE THE RANGE:
value inside range → reliable, outside range —> unreliable
<p>(a) interpret the (gradient of) regression line/ = <br><strong><mark data-color="yellow" style="background-color: yellow; color: inherit;">for every increase in x by 1(unit), y increases by gradient (unit)</mark></strong><br><br>(b) easy, got it right.<br><br>(c) ALWAYS CHECK IF VALUE INSIDE OR OUTISDE THE RANGE:<br>value inside range → reliable, outside range —&gt; unreliable</p>
5
New cards
term image

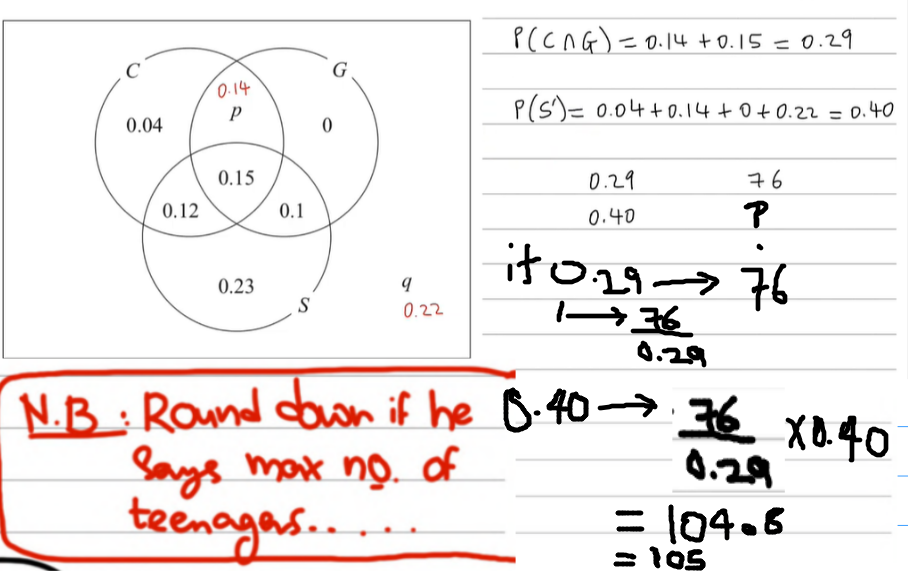
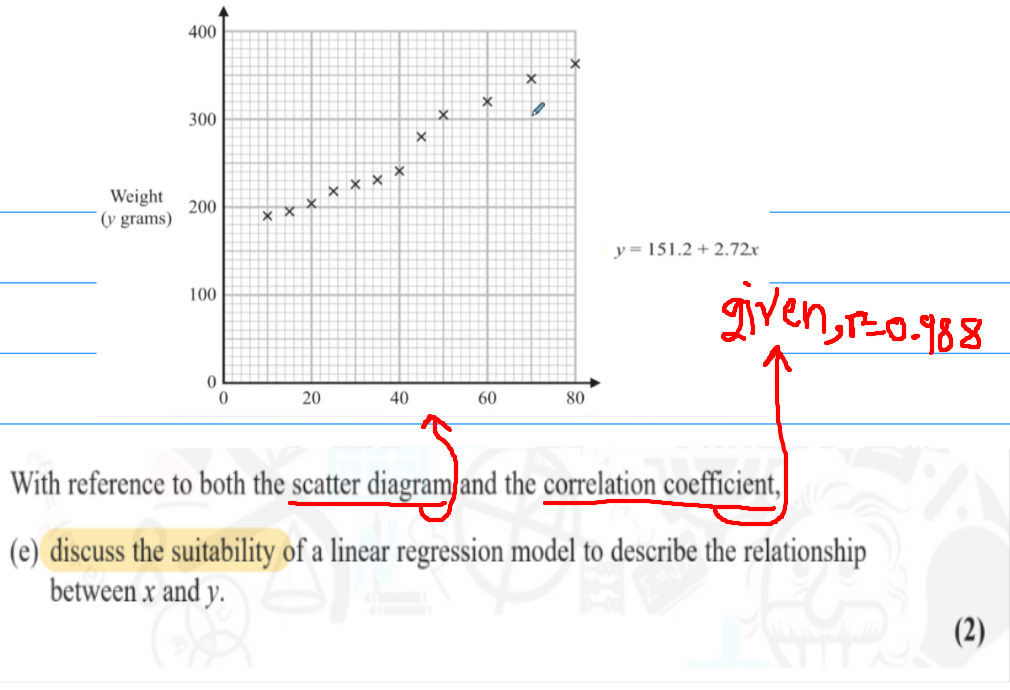
-scatter diagram shows the points lie close to a straight line

- PMCC/ r is close to 1

(therefore a a linear regression model is suitable/supported)

<p> -scatter diagram shows <strong><mark data-color="yellow" style="background-color: yellow; color: inherit;">the points lie close to a straight line</mark></strong><br><br>- PMCC/ <strong><mark data-color="yellow" style="background-color: yellow; color: inherit;">r is close to 1</mark></strong><br><br>(therefore a a linear regression model is suitable/supported)</p>
6
New cards
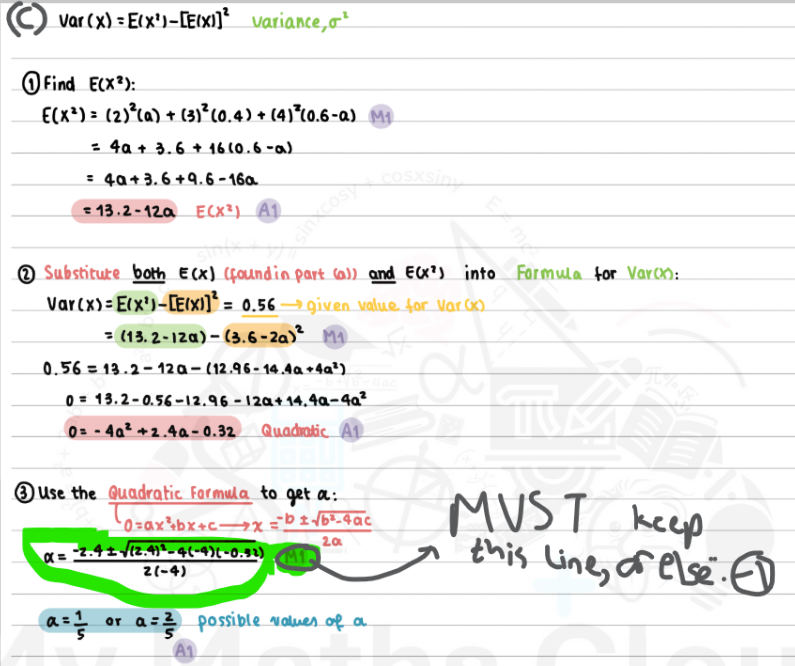
<p><u>just for concept:</u><br>do these sums carefully, easy but lengthy algebra<br><br>P.S → always include plugging in value to quadratic formula, or else -1.</p>

just for concept:
do these sums carefully, easy but lengthy algebra

P.S → always include plugging in value to quadratic formula, or else -1.
7
New cards
<p></p>

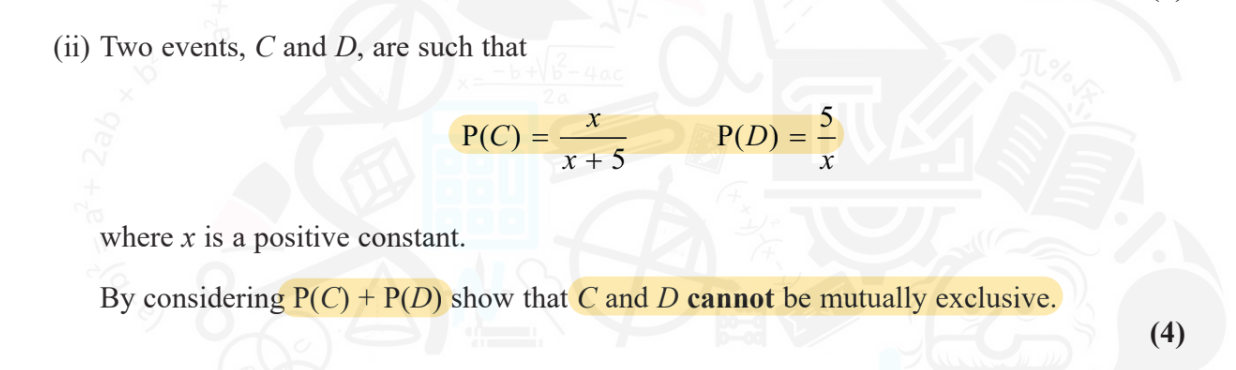
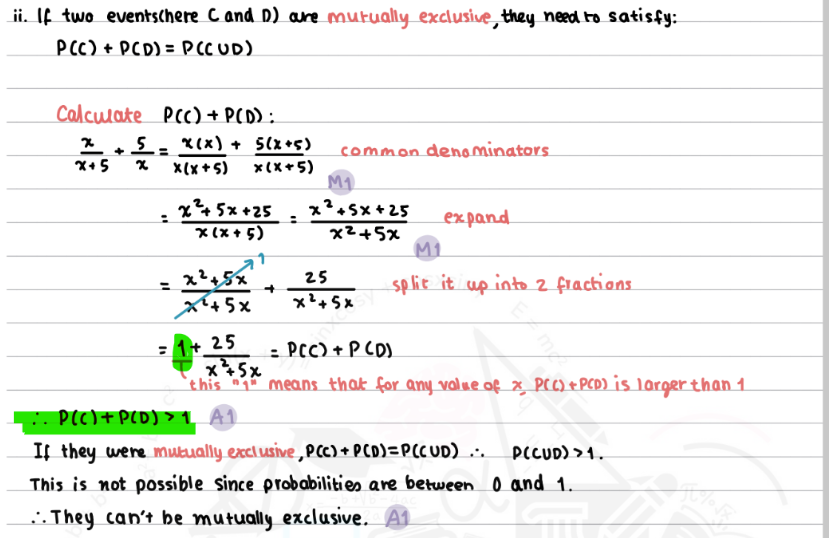
just show that P(C) + P(D) > 1

by taking 1 as common, so its in form: 1 + x……
<p>just show that P(C) + P(D) &gt; 1<br><br>by taking 1 as common, so its in form: 1 + x……</p>
8
New cards
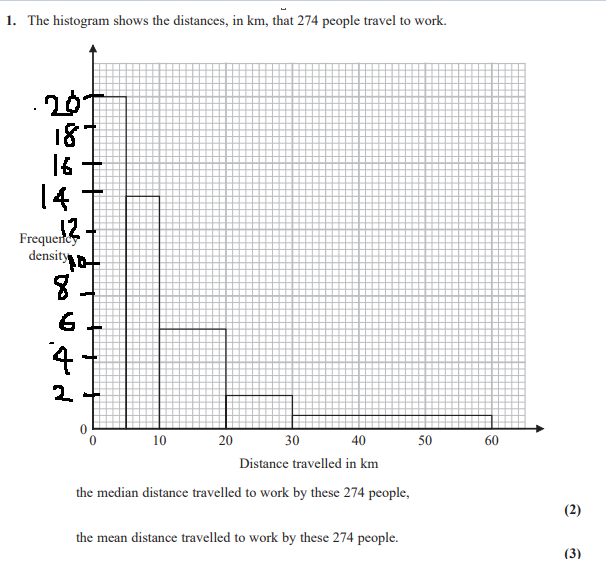
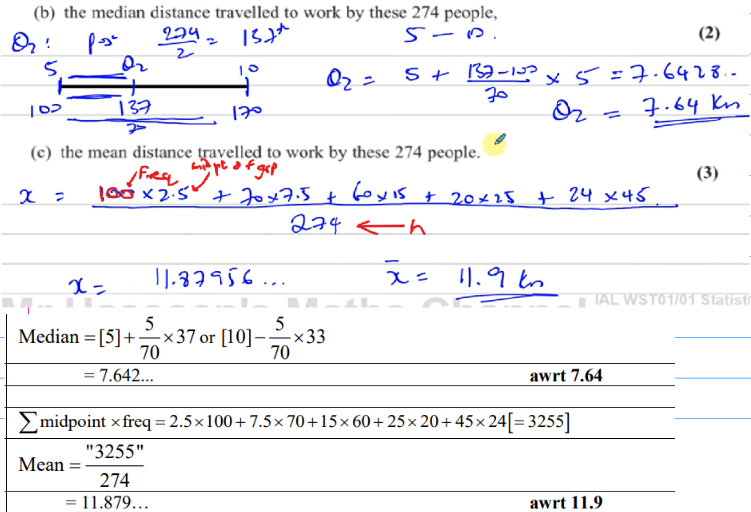
<p><strong><mark data-color="yellow" style="background-color: yellow; color: inherit;">Finding median and mean from histogram</mark></strong></p>

Finding median and mean from histogram
knowt flashcard image
9
New cards
term image

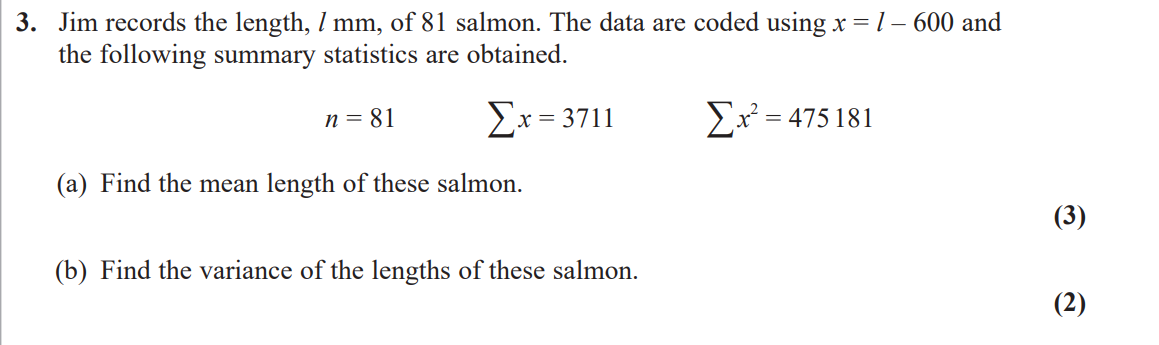
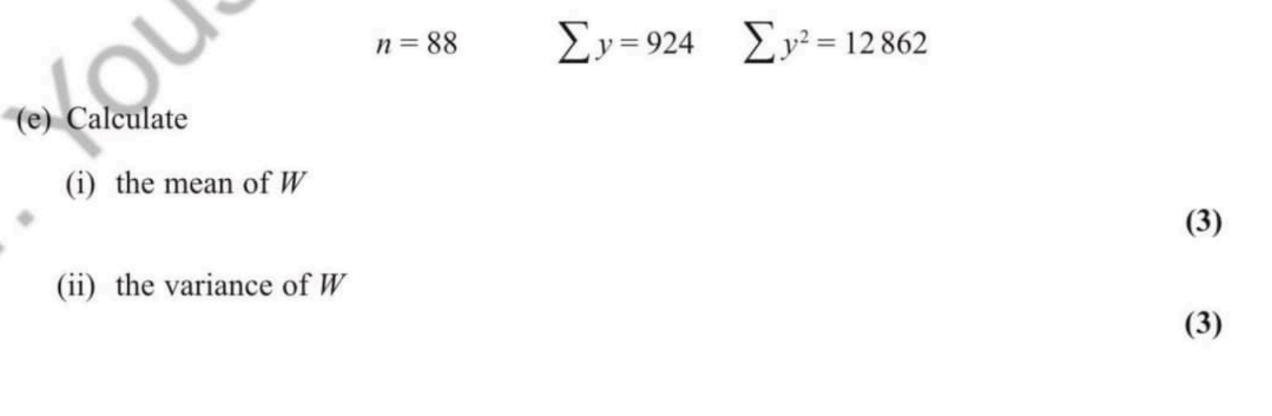
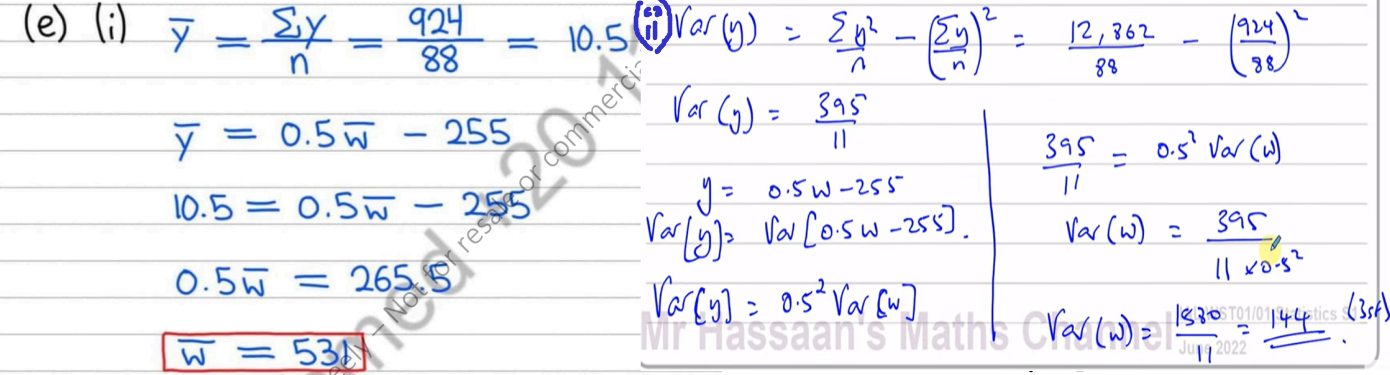
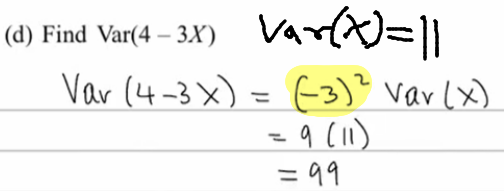
btw +- is does not have any effect on var (only multiply and divide has effect)
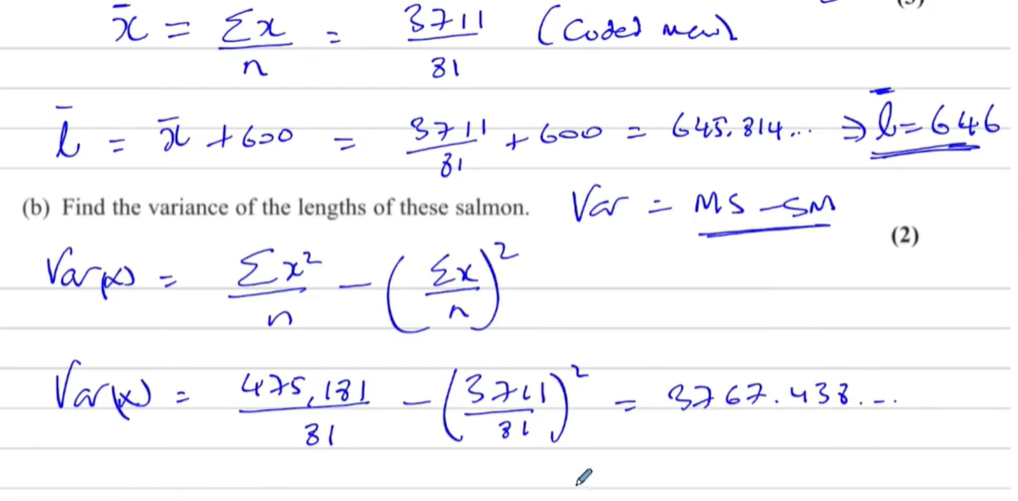
<p>btw +- is does not have any effect on var (only multiply and divide has effect)</p>
10
New cards

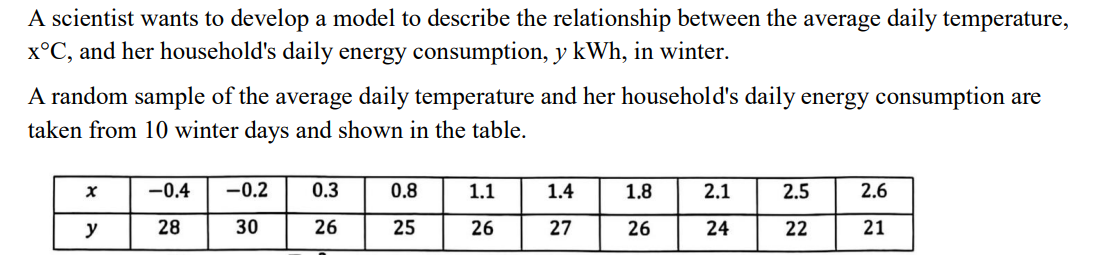
Give two other reasons why statistical models are used (2 marks)

  • To help understand real world situations

  • To simplify complex situations to make predictions
    (To make predictions)
11
New cards
<p>𝑦 = 𝑎 + 𝑏𝑥<br><br>d. Give an interpretation of the value of 𝑎<br>e. Discuss the reliability of using this model to predict her household's energy consumption in the summer.</p>

𝑦 = 𝑎 + 𝑏𝑥

d. Give an interpretation of the value of 𝑎
e. Discuss the reliability of using this model to predict her household's energy consumption in the summer.

d. The estimated daily energy consumption( y ) when the average daily temperature( x ) is 0°C

(the estimated value of y when x is 0)

e. The model may not be reliable because the data is based on winter temperatures, and extrapolating to summer temperatures may not be accurate (as temp in summer is much higher)
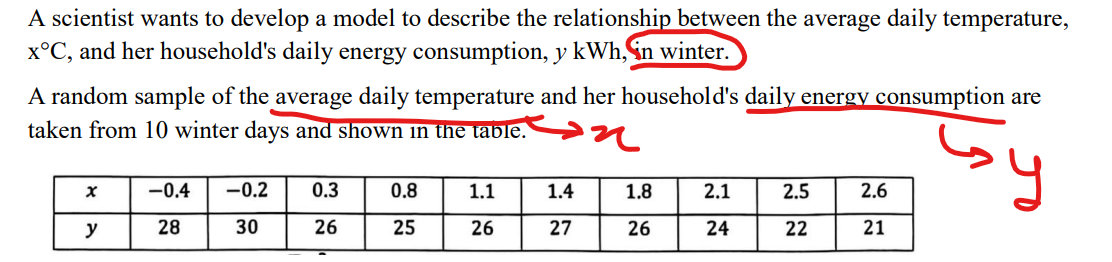
<p><strong>d. The estimated daily energy consumption<u><mark data-color="yellow" style="background-color: yellow; color: inherit;">( y )</mark></u> when the average daily temperature<u><mark data-color="yellow" style="background-color: yellow; color: inherit;">( x )</mark></u> is 0°C</strong><br><br><strong><u>(the estimated value of y when x is 0)</u></strong><br><br><strong>e. The model may not be reliable because<u><mark data-color="yellow" style="background-color: yellow; color: inherit;"> the data is based on winter</mark></u> temperatures, and <u><mark data-color="yellow" style="background-color: yellow; color: inherit;">extrapolating</mark> to summer temperatures may not be accurate</u> (as temp in summer is much higher)</strong></p>
12
New cards
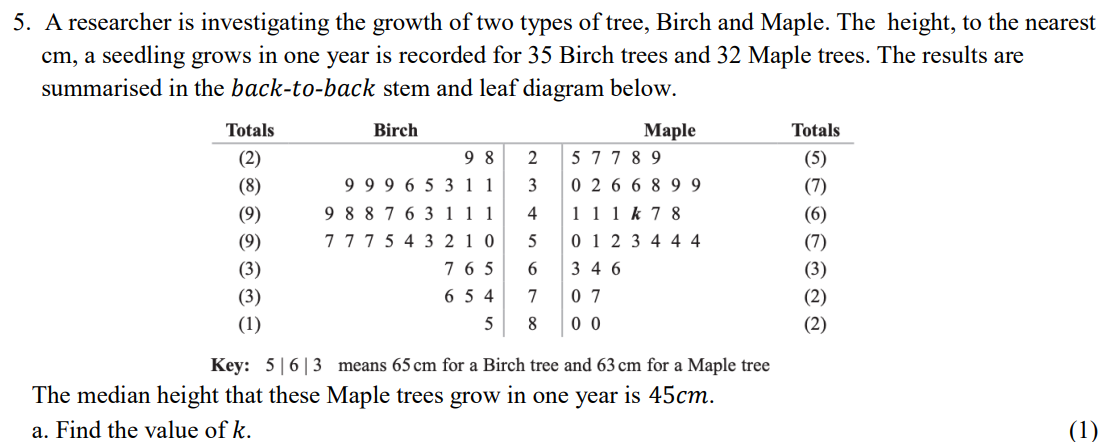
<p>given n = 32, find median</p>

given n = 32, find median

since n = 32, which is even number.

THEREFORE, median is n/2 = 32/2 = 16th value.
so median = 16th + 17th / 2
<p>since n = 32, which is <strong><u><mark data-color="yellow" style="background-color: yellow; color: inherit;">even number.</mark></u>  </strong><br><br><strong>THEREFORE, median is n/2 = 32/2 = 16th value. </strong><br><strong>so median = 16th + 17th / 2 </strong></p>
13
New cards
term image
knowt flashcard image
14
New cards
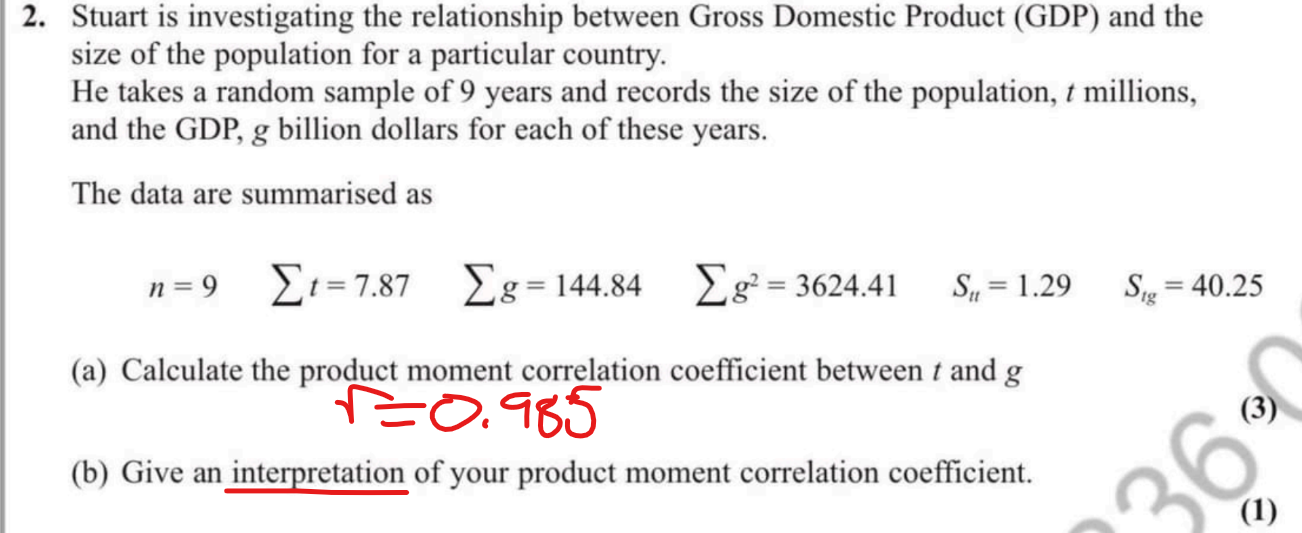
<p>Answer 2(b)</p>

Answer 2(b)


Ans: As the population/t increases, GDP/g increases (since r is close to 1 & strong +ve corelation)

(Examiner report mentions:
Candidates responses should clearly state the variables when they describe the relationship between them. Many failed to contextualise their answer by merely stating ‘positive correlation’ or ‘strong correlation’. )

for these questions, interpret, state the FINAL OUTCOME.

15
New cards
term image

If question says:

  • “increase”, “change”, “difference”
    👉(y = a +bx), IGNORE a, use only b
<p>If question says: </p><ul><li><p>“increase”, “change”, “difference”<br><span data-name="point_right" data-type="emoji">👉</span><strong>(y = a +bx),</strong> <strong>IGNORE a, use only b </strong></p></li></ul><p></p>
16
New cards
term image
knowt flashcard image
17
New cards
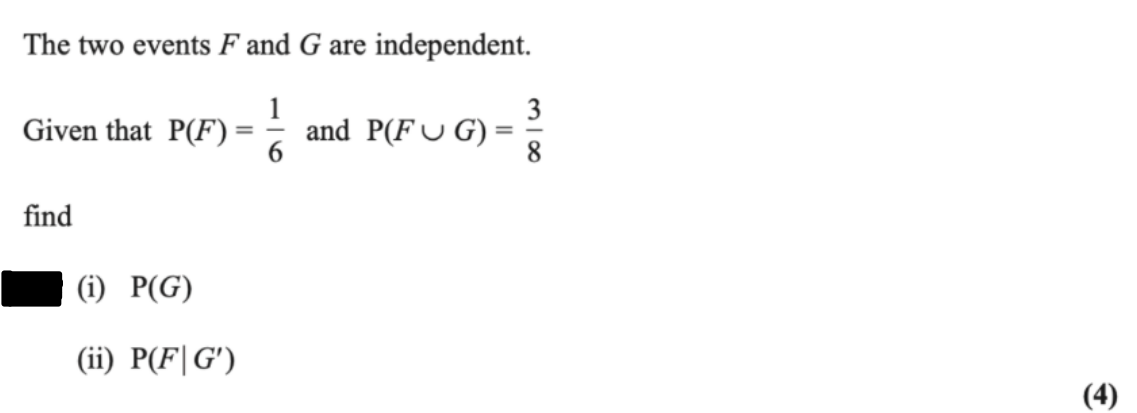
term image

NOTE:

P (A ∩ B)
P (A
| B ) = —————
P (B)
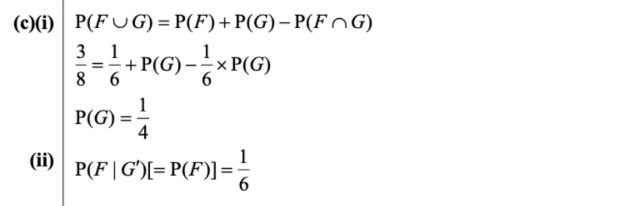
<p>NOTE: <br><br><mark data-color="yellow" style="background-color: yellow; color: inherit;">                               </mark><strong><mark data-color="yellow" style="background-color: yellow; color: inherit;"> P (A ∩ B) </mark></strong><mark data-color="yellow" style="background-color: yellow; color: inherit;"><br>P (A </mark><strong><mark data-color="yellow" style="background-color: yellow; color: inherit;">|</mark></strong><mark data-color="yellow" style="background-color: yellow; color: inherit;"> B ) </mark><strong><mark data-color="yellow" style="background-color: yellow; color: inherit;">=             —————</mark></strong><mark data-color="yellow" style="background-color: yellow; color: inherit;"><br></mark><strong><mark data-color="yellow" style="background-color: yellow; color: inherit;">                                   P (B)     </mark></strong><br></p>
18
New cards
term image

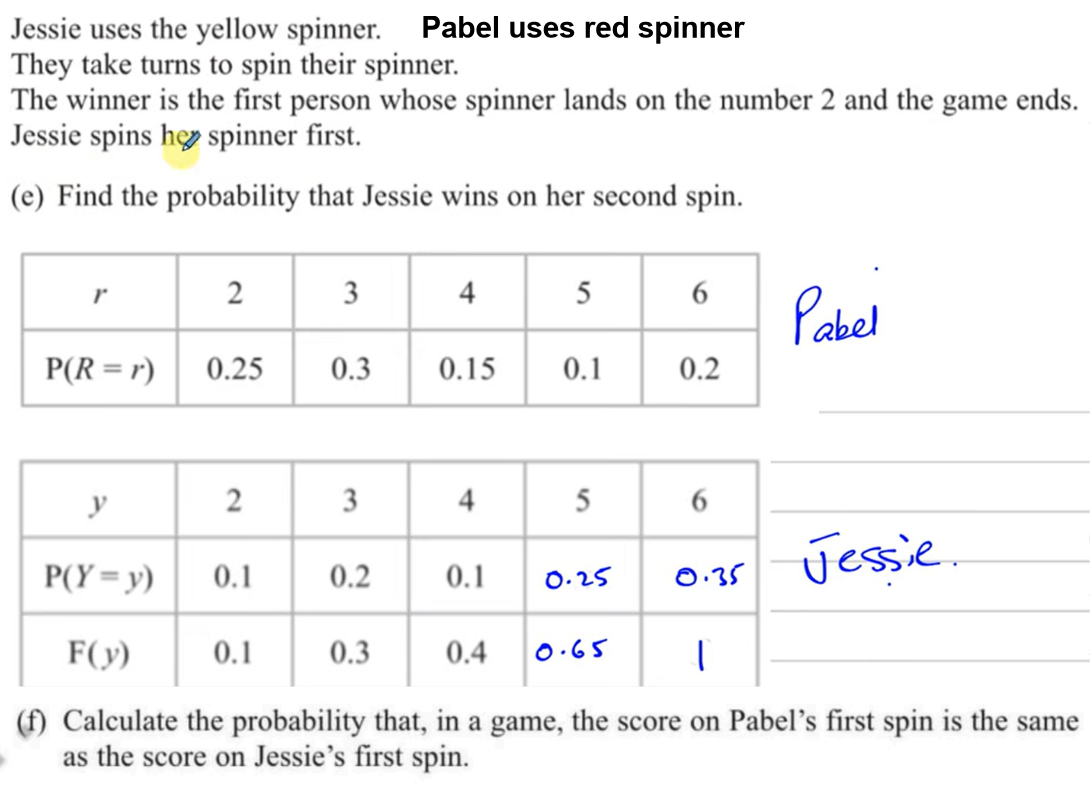
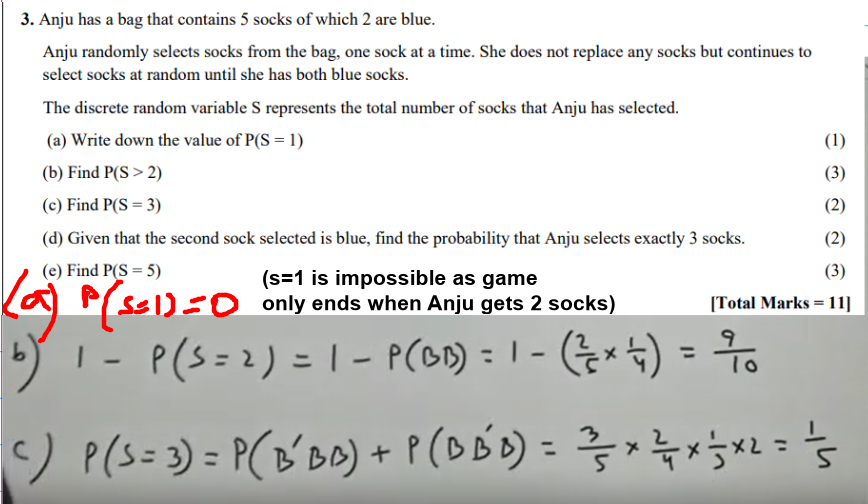
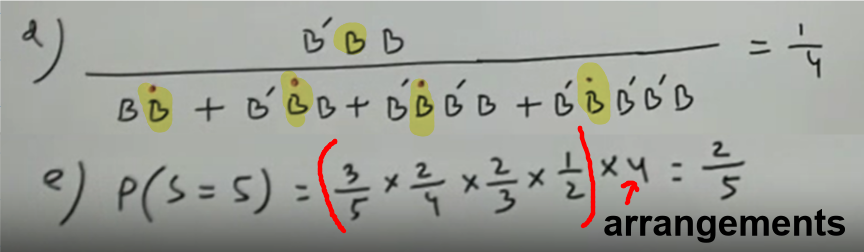
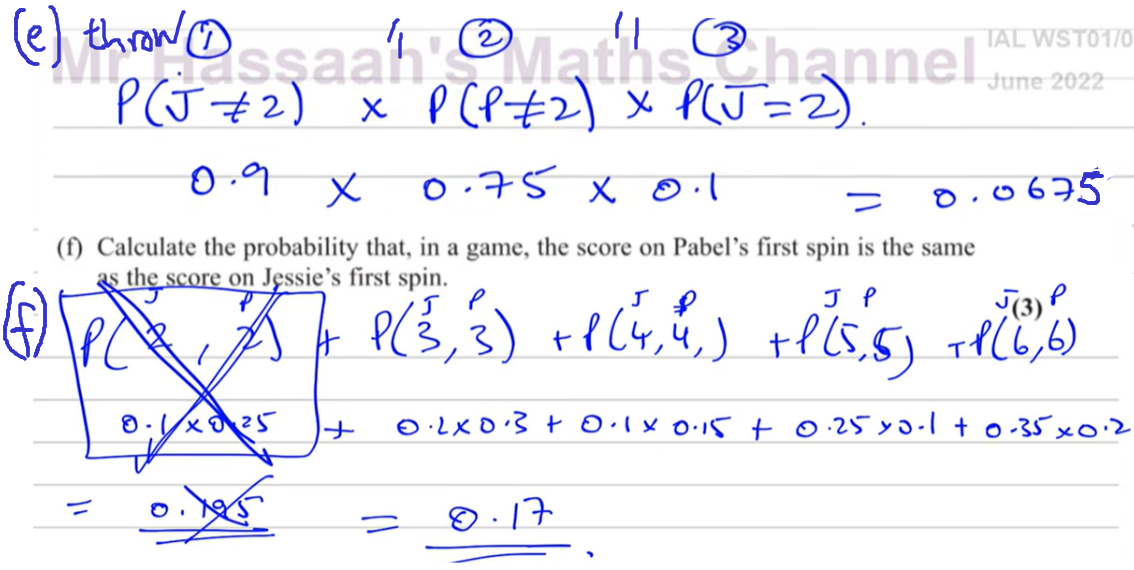
the reason we keep multiplying for (e) is because the game goes J P J ….. (given J starts)
<p>the reason we keep multiplying for (e) is because the game goes J P J ….. (given J starts)</p>
19
New cards
term image
knowt flashcard image
20
New cards
term image
knowt flashcard image
21
New cards
term image
knowt flashcard image
22
New cards
<p></p>

knowt flashcard image
23
New cards
<p>FULL theory</p>

FULL theory

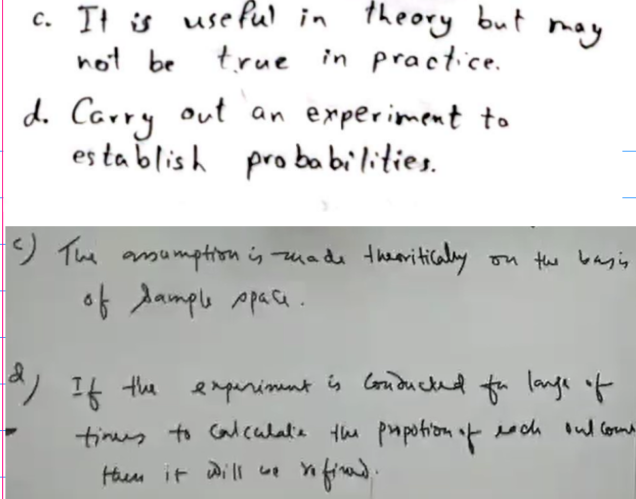
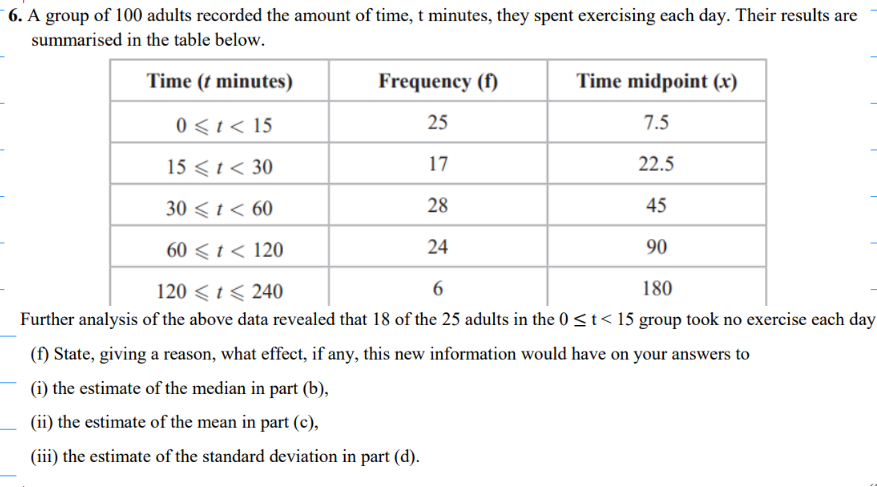
(a) discrete Uniform distribution

(b) Tossing/rolling a fair die
(where if X is the outcome of the die then X follows discrete Uniform distribution)
<p>(a) discrete Uniform distribution<br><br>(b) Tossing/rolling a fair die<br>(where if X is the outcome of the die then X follows discrete Uniform distribution)<br><br></p>
24
New cards
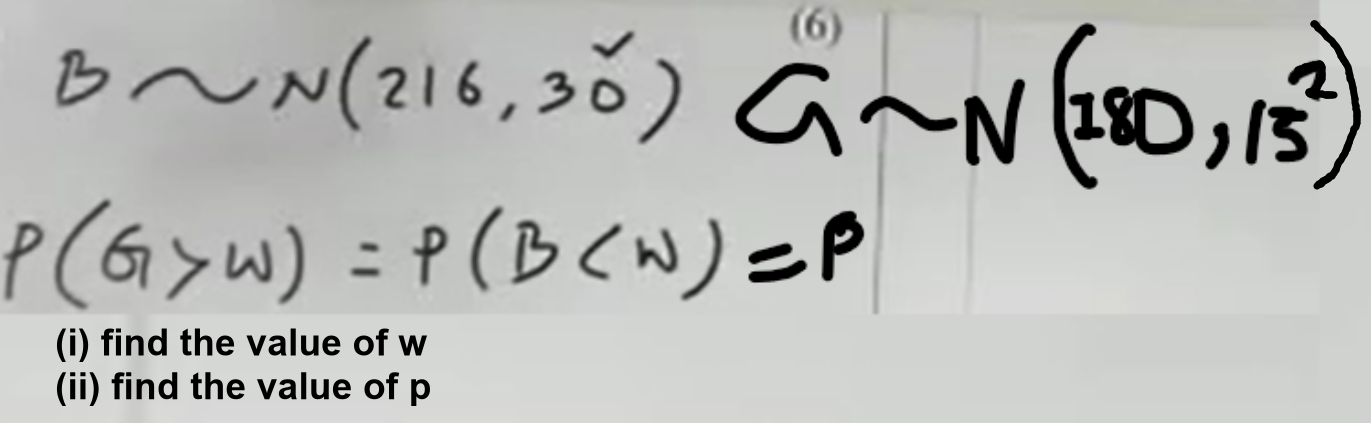
<p>theory of mean, median and S.D  from table</p>

theory of mean, median and S.D from table

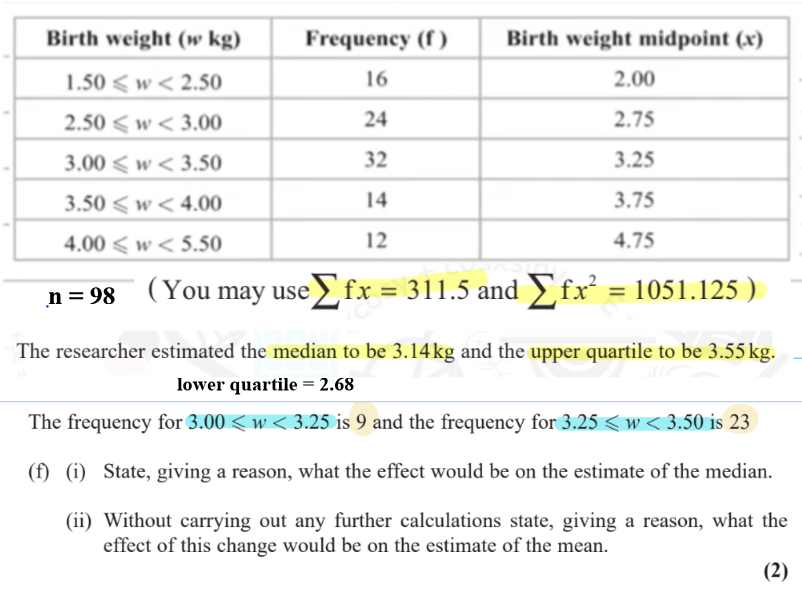
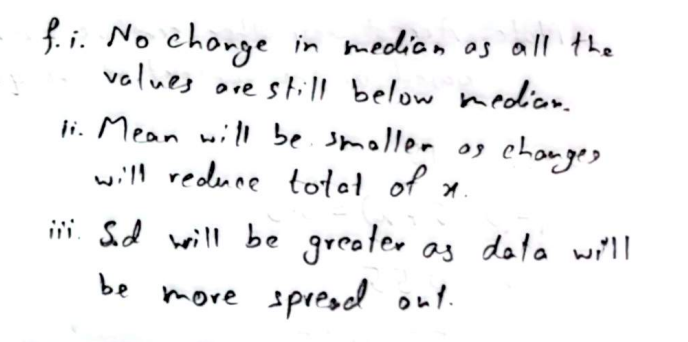
(ii) mean would decrease as total exercise time for the 0 \leq t < 15 group is reduced,
thus lowering the overall average

(iii) S.D increases because the new info gives more variability at the lower end of the data
(cuz 18 peoples time is reduced to 0 mins)
<p><span>(ii) mean would </span><strong>decrease</strong><span> as total exercise time for the $$0 \leq t &lt; 15$$ group is reduced, </span><br><span>thus lowering the overall average</span><br><br>(iii)<span> S.D  </span><strong>increases</strong><span> because the new info gives more variability at the lower end of the data</span><br><span>(cuz 18 peoples time is reduced to 0 mins)</span></p>
25
New cards
term image

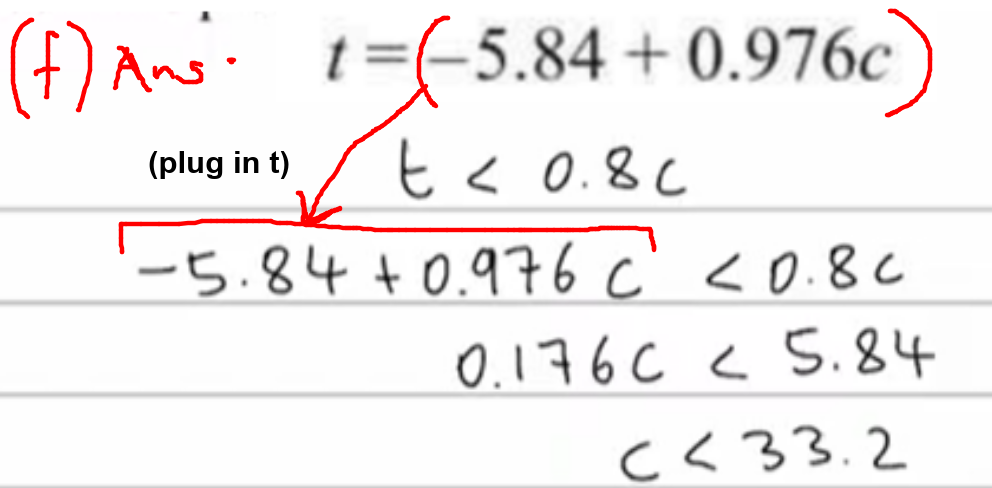
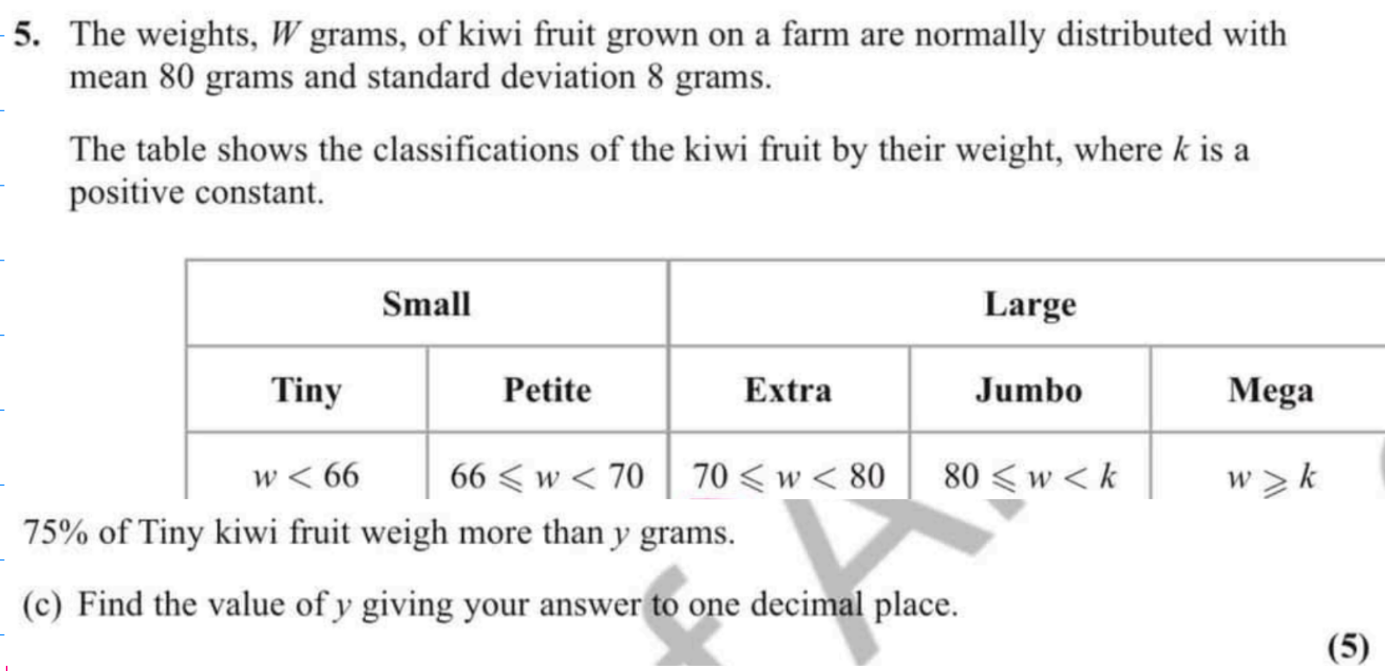
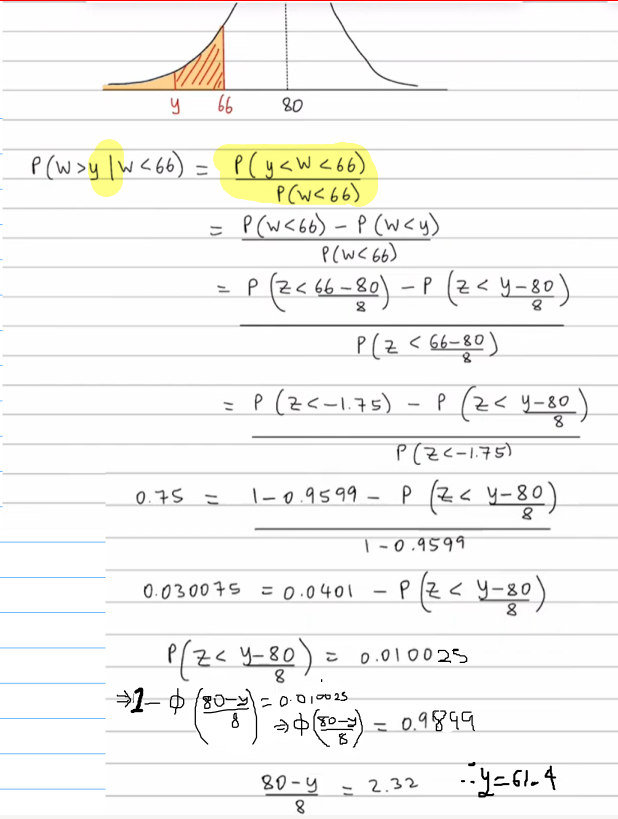
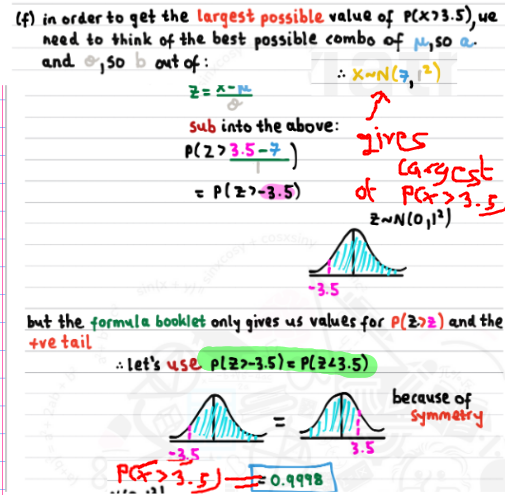
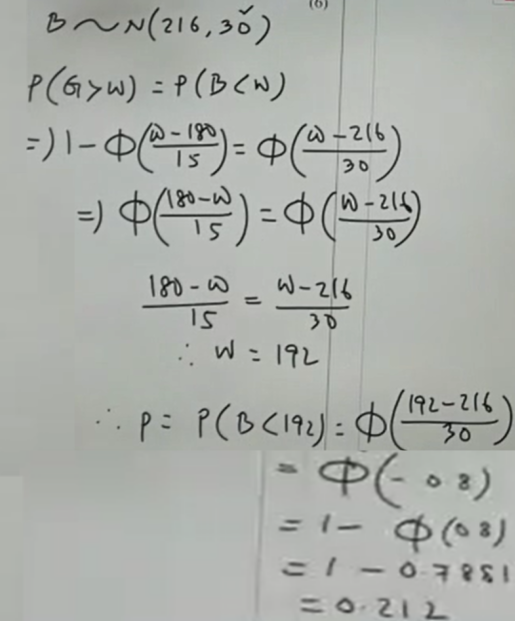
NOTE → since both sides have the same function (Φ), you can cancel them out
<p>NOTE → since both sides have the same function (Φ), you can cancel them out</p>
26
New cards
term image

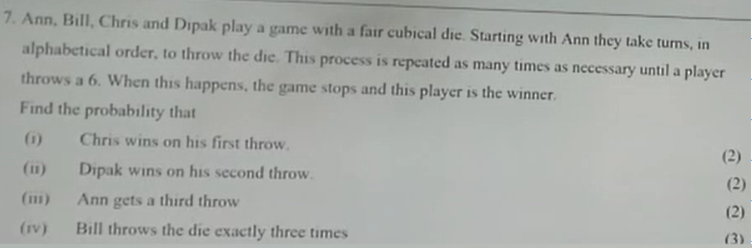
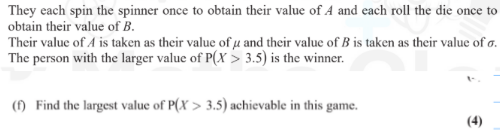
Game is continous like → A B C D A B C D .. until someone wins, thus you keep multiplying

hence the powers are so large, like in (ii) → [ 5/6 × 5/6 x 5/6 x 5/6 x 5/6 x 5/6 x 5/6 = (5/6)^7 ]

<p>Game is continous like → A B C D A B C D .. until someone wins, thus you keep multiplying<br><br>hence the powers are so large, like in <strong><u>(ii)</u></strong> → [ 5/6 × 5/6 x 5/6 x 5/6 x 5/6 x 5/6 x 5/6 = (5/6)^7 ]</p>
27
New cards
term image

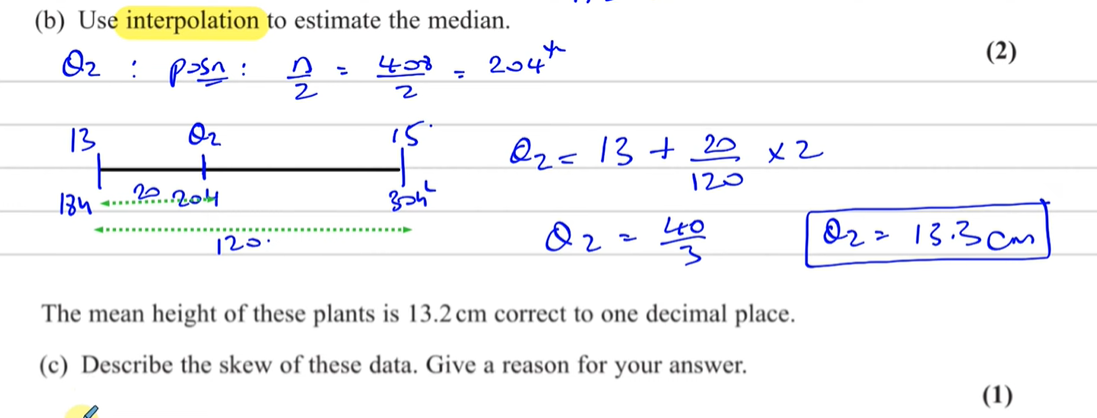
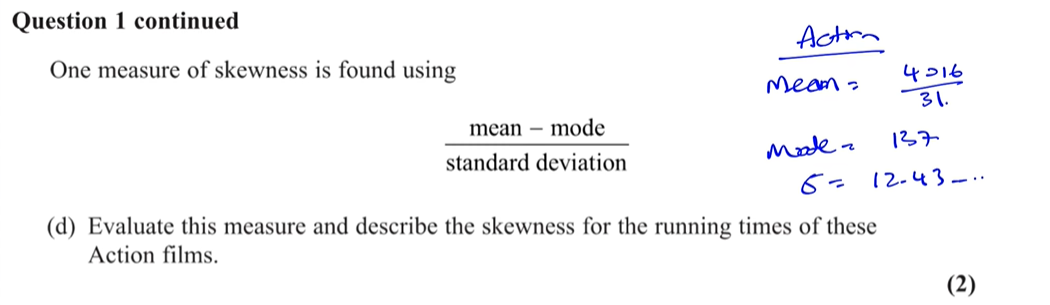
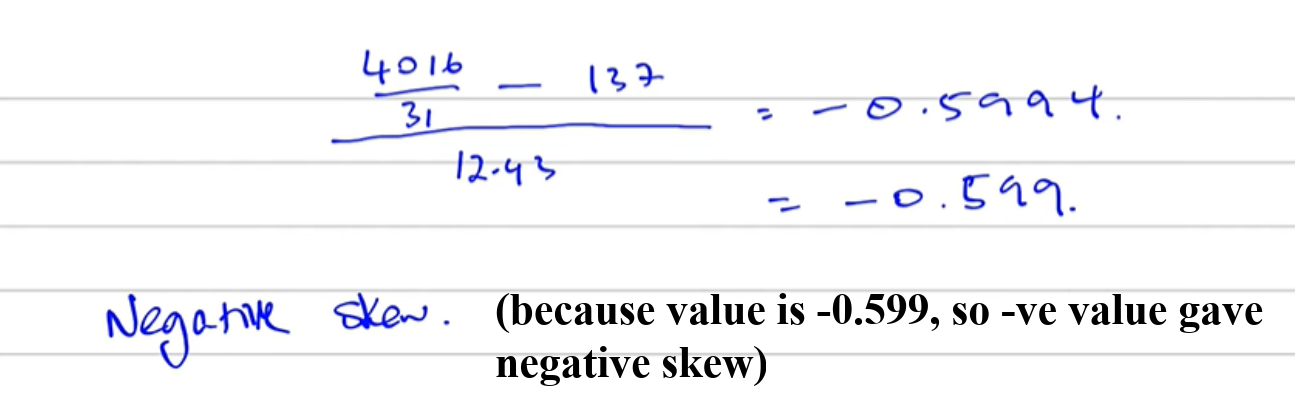
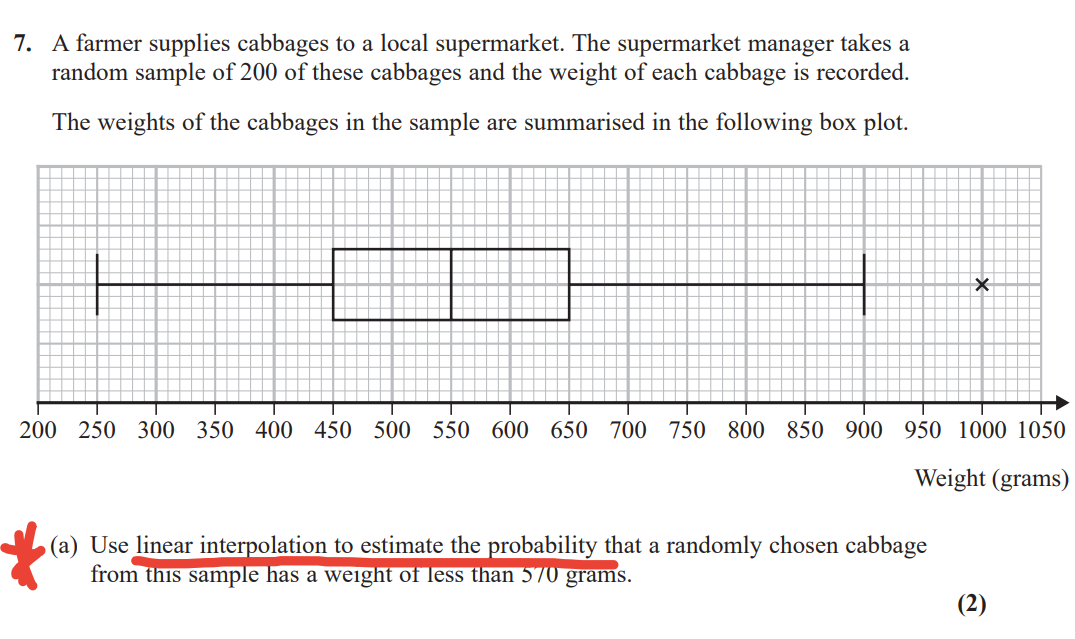
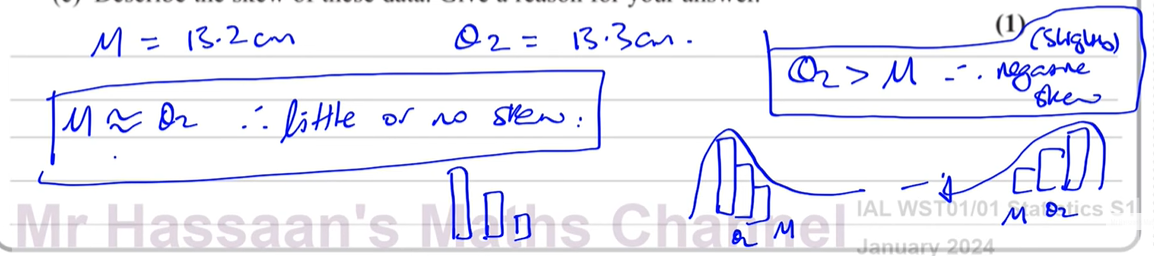
mean ≈ median → Symmetrically distributed

(also as yk right tail → greater positive skew, left tail greater → negative skew
<p><strong><u> mean ≈ median → Symmetrically distributed</u></strong><br><br>(also as yk right tail  → greater positive skew, left tail greater → negative skew</p>
28
New cards
term image

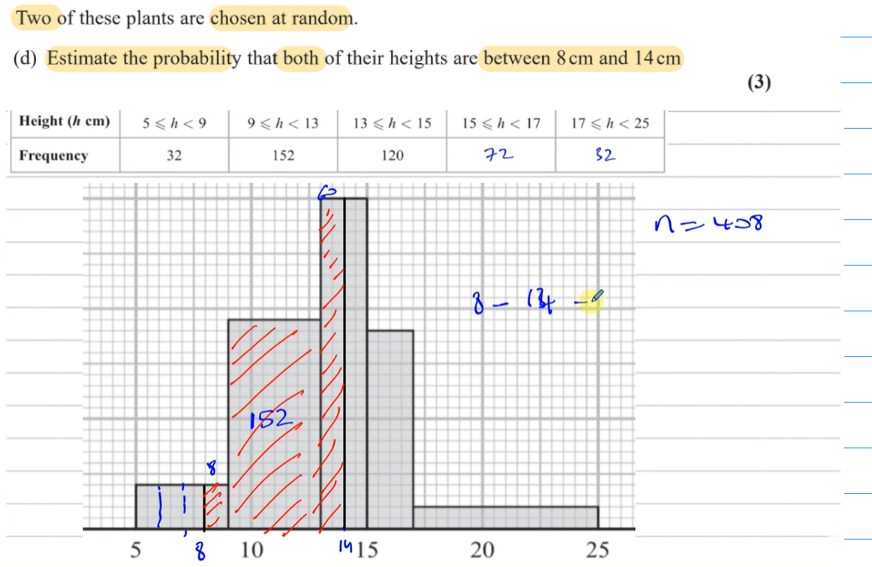
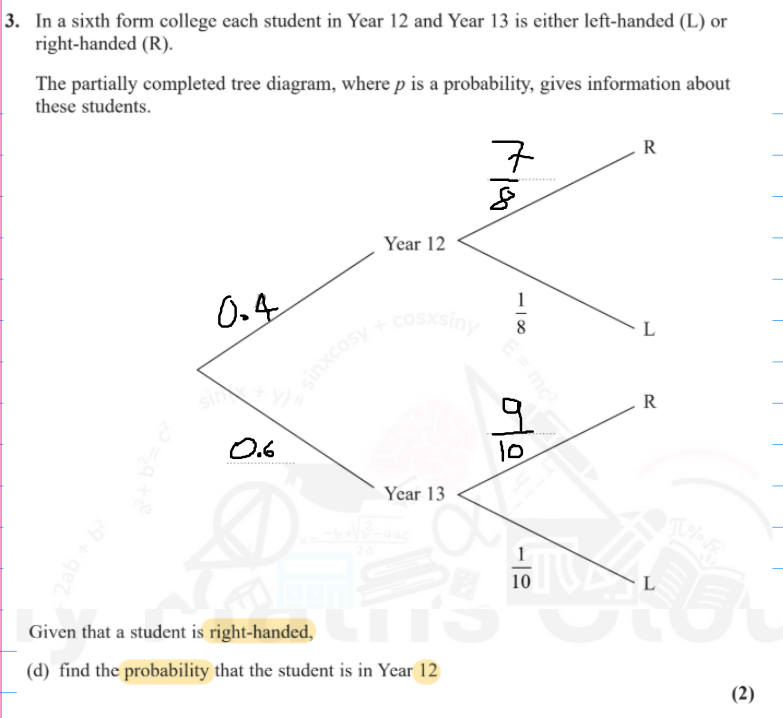
NOTE → it doesnt explicitly say the plants are returned or smt, so we consider not returned, hence its 408 and then 407

<p>NOTE → it doesnt explicitly say the plants are returned or smt, so we consider not returned, hence its 408 and then 407</p>
29
New cards
term image
knowt flashcard image
30
New cards
term image

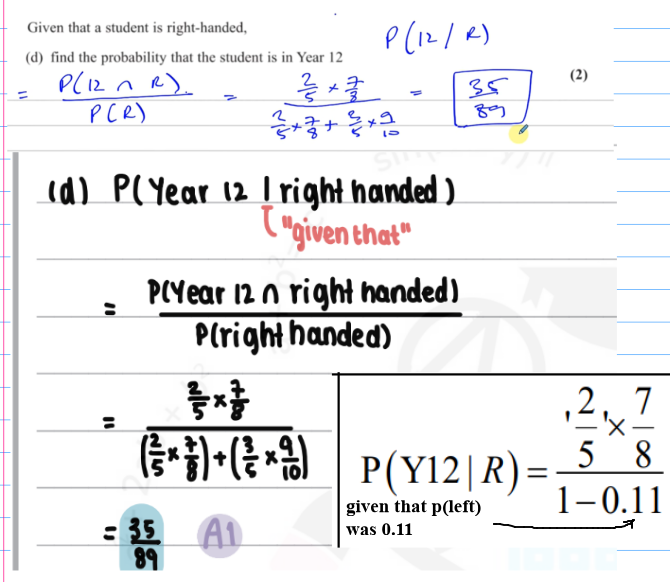
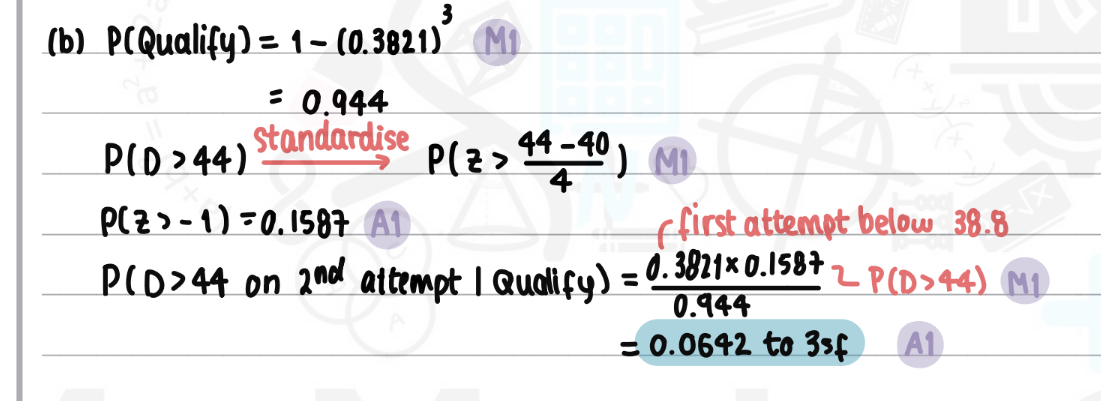
NOTE:
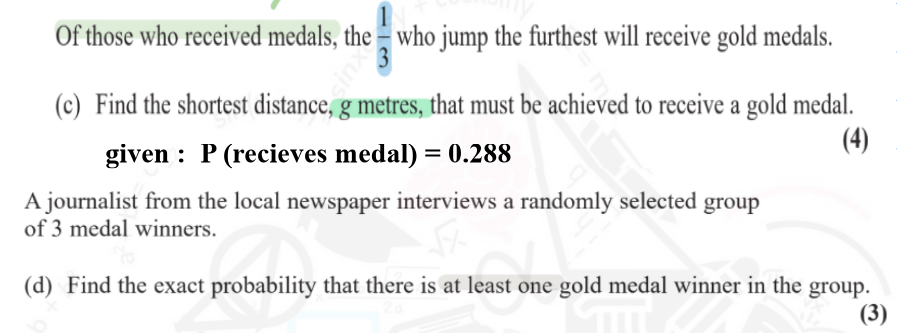
READ THE Q., it says GIVEN….

GIVEN —> P ( A | B)

INDEPENDENT -→ means in this context, first throw doesn’t affect second throw’s probability
<p>NOTE: <br>READ THE Q., it says<strong><u> GIVEN….</u></strong><br><br><strong><u>GIVEN —&gt; P ( A | B)</u></strong><br><br><strong><u>INDEPENDENT -→ means in this context, first throw doesn’t affect second throw’s probability</u></strong></p>
31
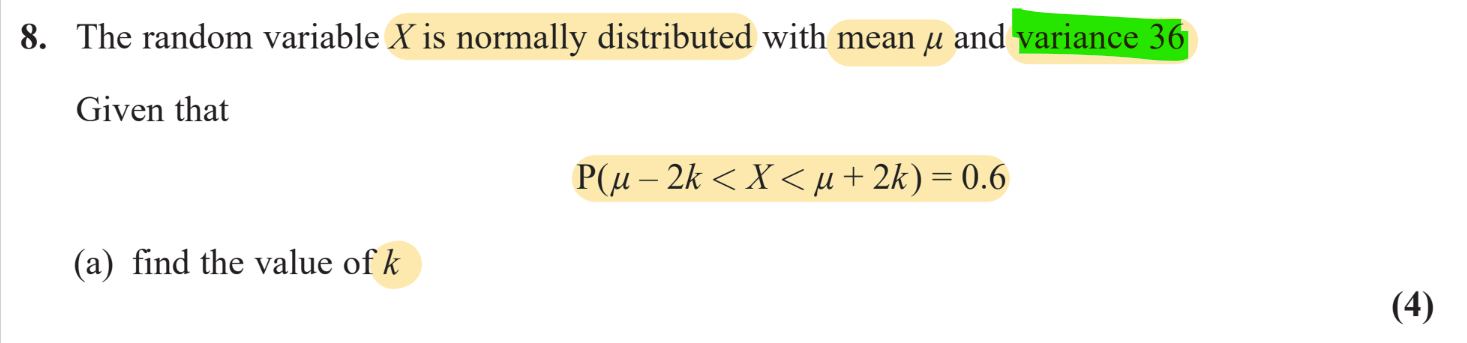
New cards
term image

READ QUESTION CAREFULLY, here it says variance of 6, so convert to S.D

s.d = √var = √36 = 6

N ~ ( u, 6²)
[i used 36 instead of 6 the whole time thus got it wrong]

<p>READ QUESTION CAREFULLY, here it says variance of 6, so convert to S.D<br><br>s.d = <span>√var = √36 = 6</span><br><br>N ~ ( u, 6²)<br>[i used 36 instead of 6 the whole time thus got it wrong]</p>
32
New cards
term image
knowt flashcard image
33
New cards
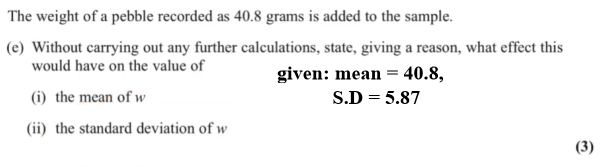
term image

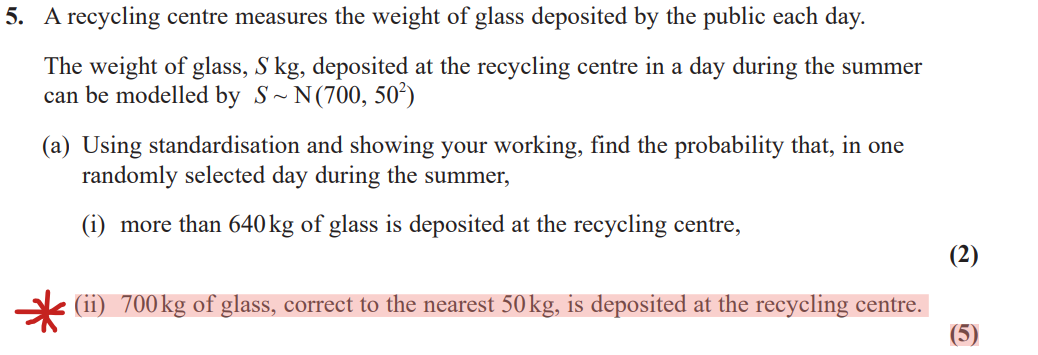
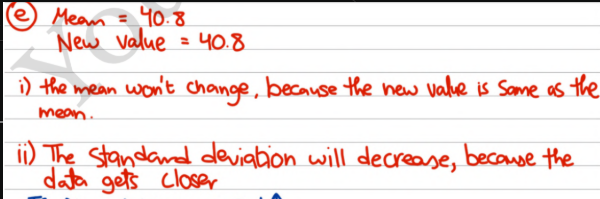
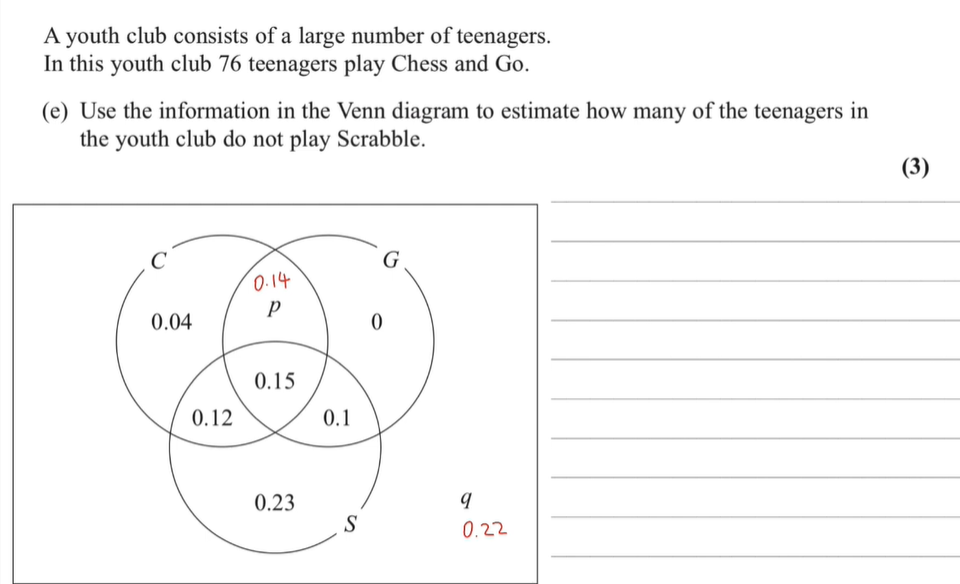
How far data points are from the mean on average, or how spread out

if new value = mean, S.D decreases

if new value < OR > than mean, you gotta check → are the data points are less spread or more spread now
(more spread = more S.D and vice versa)
<p>How far data points are from the mean on average, or how spread out<br><br>if <strong><u>new value = mean, S.D decreases</u></strong><br><br>if new value <strong>&lt; </strong>OR <strong>&gt; </strong>than mean, you gotta check  →<strong><u><mark data-color="yellow" style="background-color: yellow; color: inherit;"> are the data points are less spread or more spread now</mark></u></strong><br> (more spread = more S.D and vice versa)</p>
34
New cards
term image

just simple unitary method

<p>just simple unitary method</p>
35
New cards
term image
knowt flashcard image
36
New cards
term image

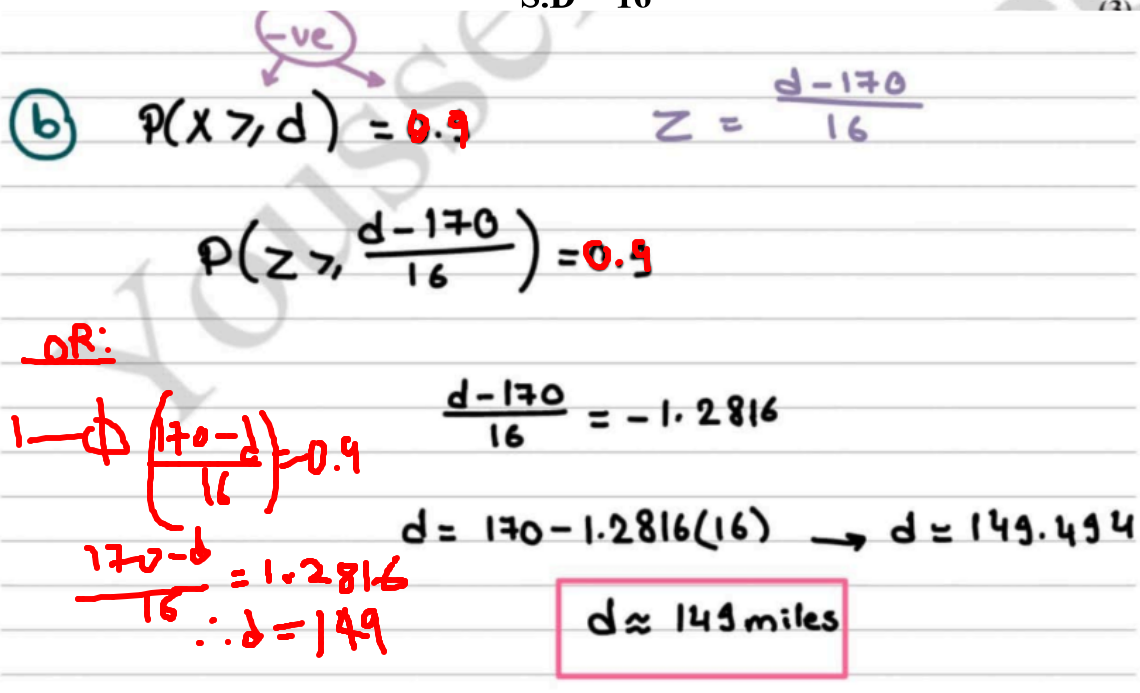
easy, but just be careful when changing from > to < , make sure to keep in mind 1- fi, and using big table

<p>easy, but just be careful when changing from &gt; to &lt; , make sure to keep in mind 1- fi, and using big table</p>
37
New cards
term image

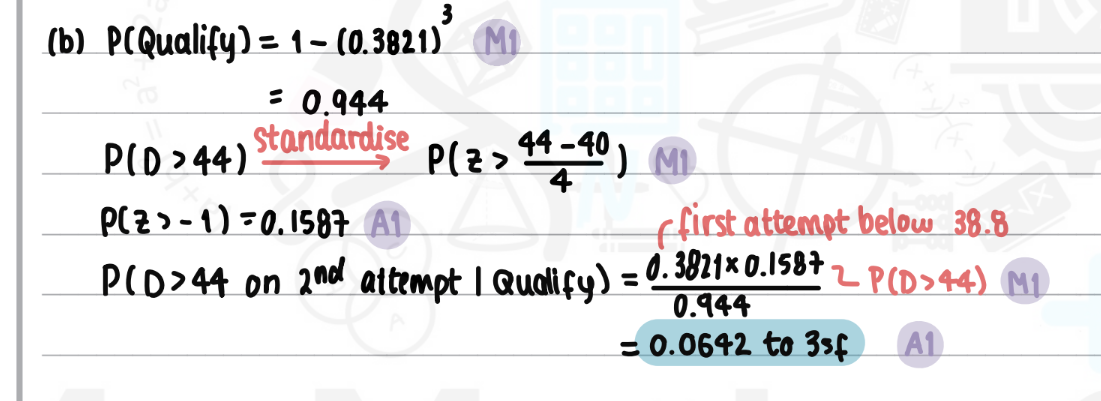
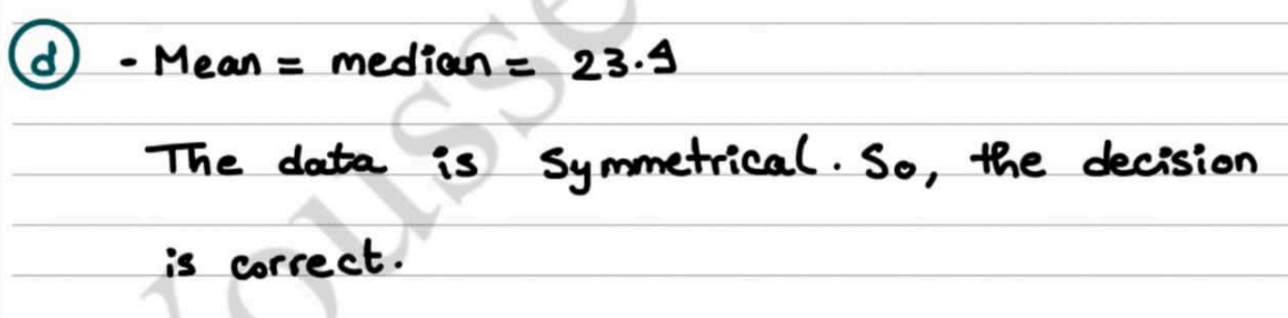
Mean = Median

so decision is justified, as normal distribution is suitable due to symmetry
<p><strong><u><mark data-color="yellow" style="background-color: yellow; color: inherit;">Mean = Median </mark></u></strong><br><br>so <u>decision is justified, as normal distribution is suitable due to symmetry</u></p>
38
New cards
term image


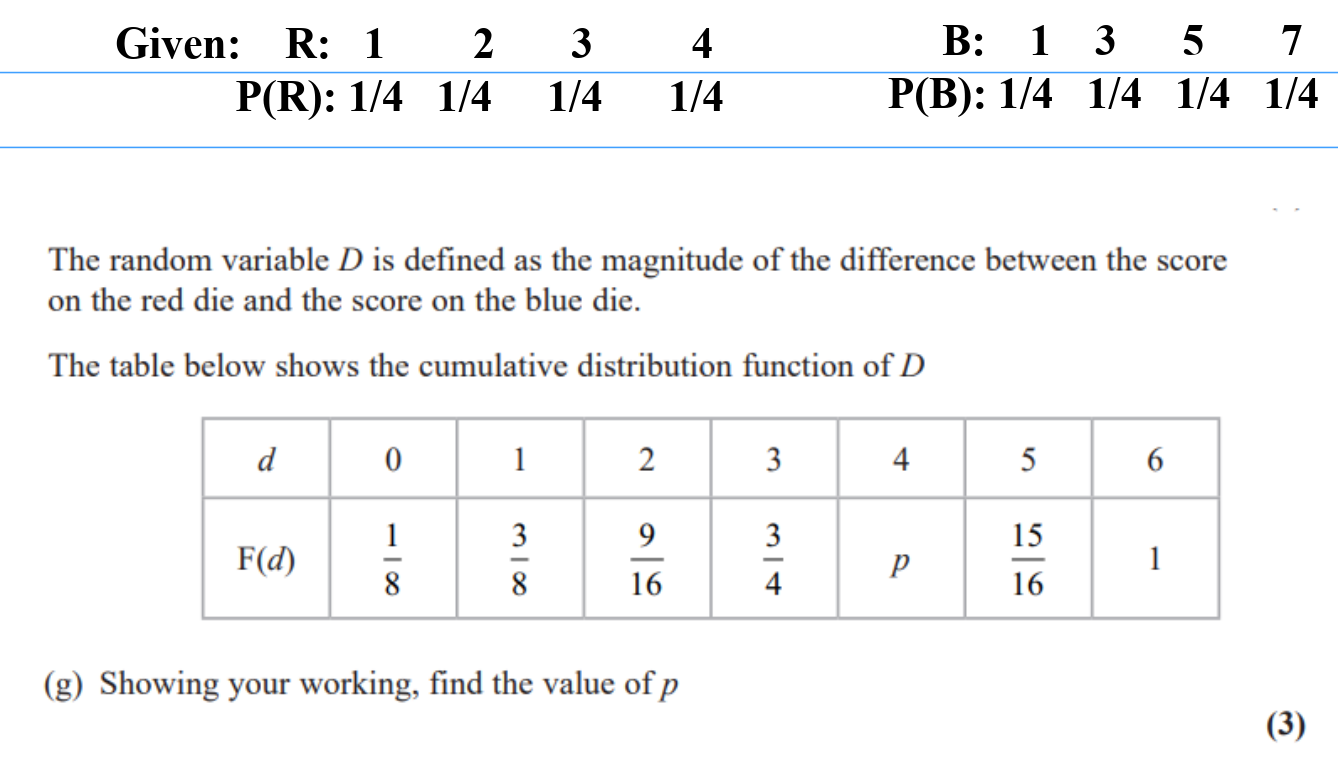
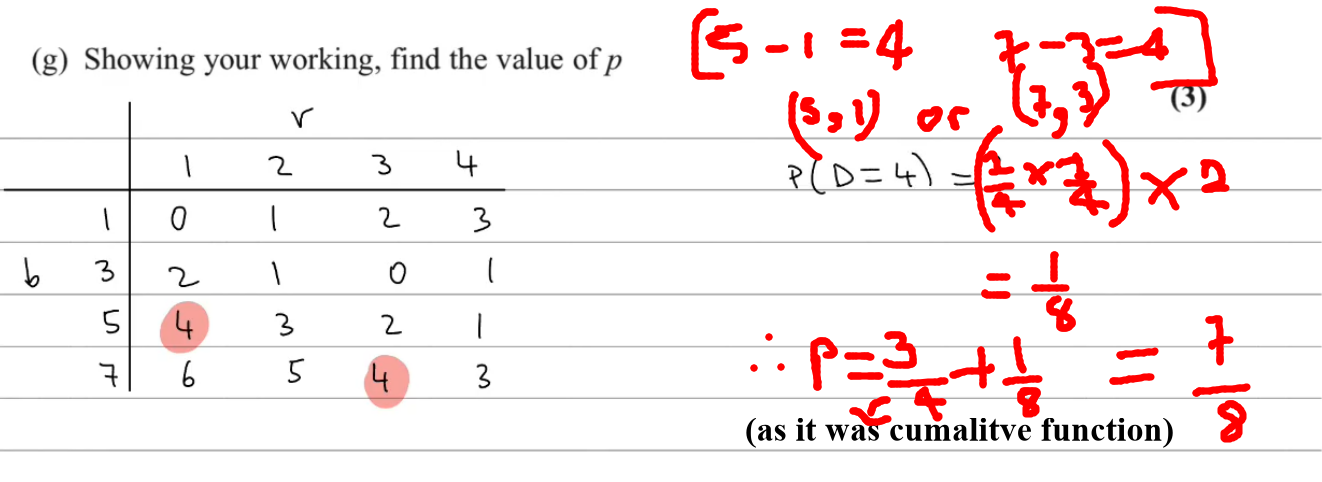
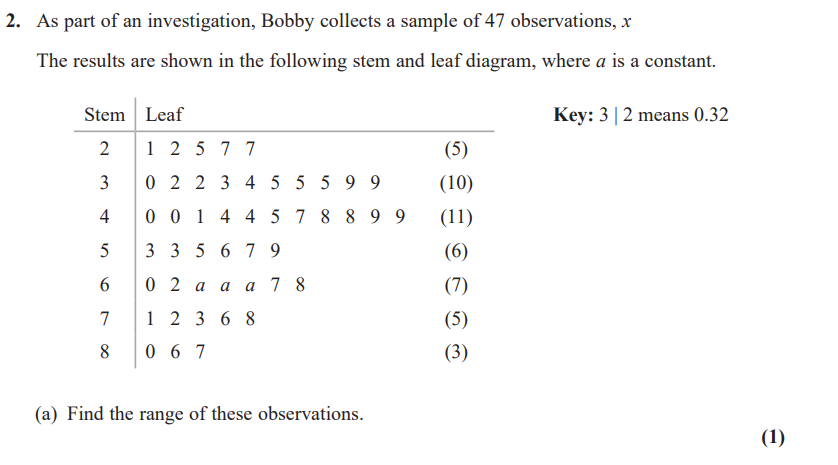
(i.e the rule of game was difference between red and blue die, so plz read q. carefully, it gives hints)
<p><br>(i.e the rule of game was difference between red and blue die, so plz read q. carefully, it gives hints)</p>
39
New cards
term image

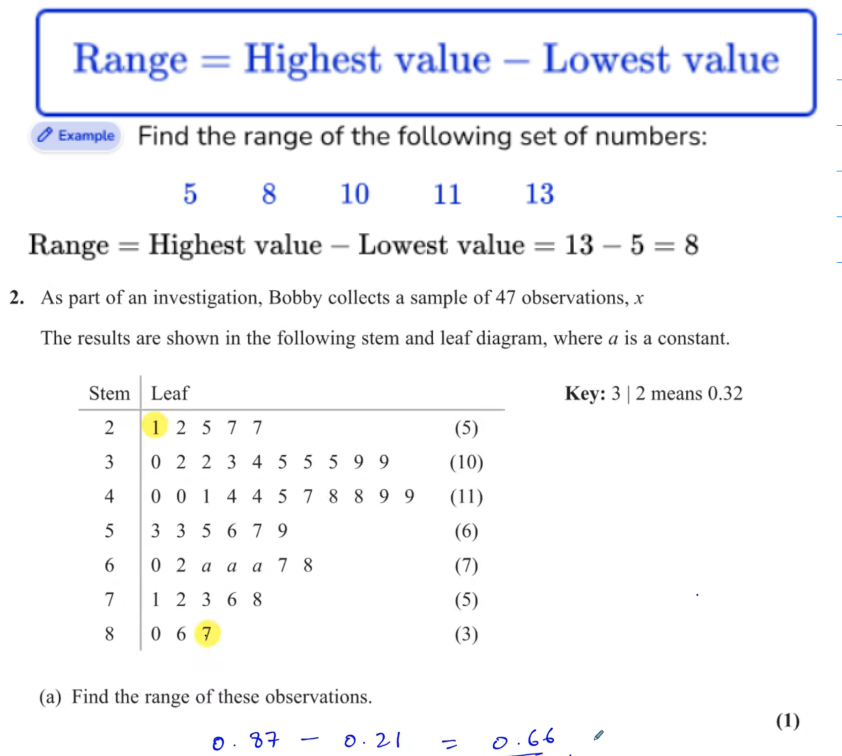
in statistics →range is the difference between max and min
<p><span>in statistics →range is the difference between max and min</span></p>
40
New cards
term image

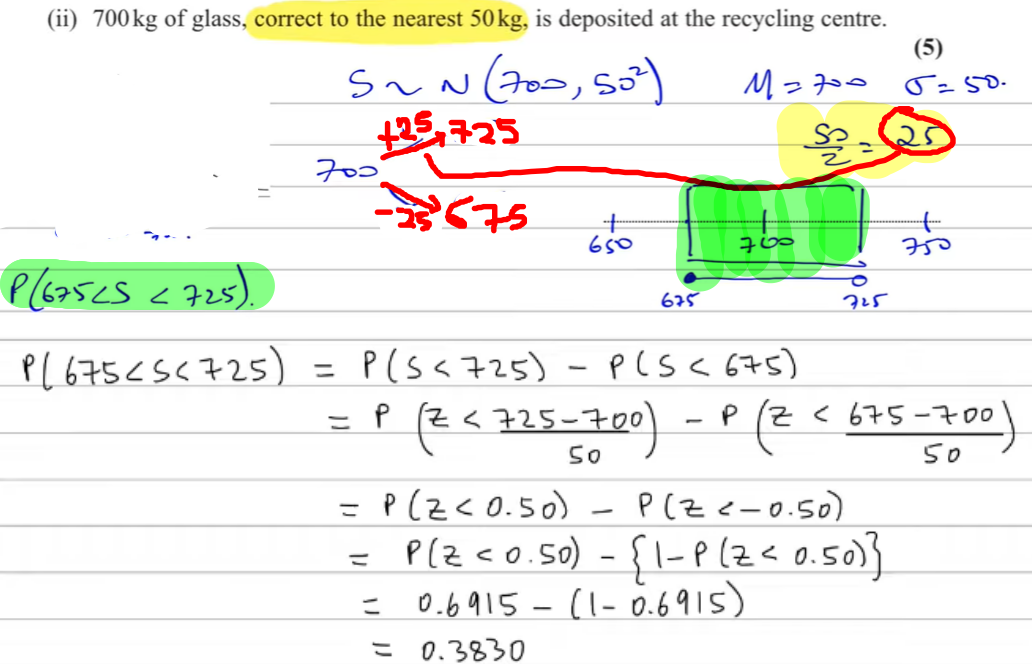
for e.g if it was 500 kg to nearest 30kg, it would be 30/2 = 15

so it would be: 485 < W < 515
<p>for e.g if it was 500 kg to nearest 30kg, it would be 30/2 = 15<br><br>so it would be: 485 &lt; W &lt; 515</p>
41
New cards
term image

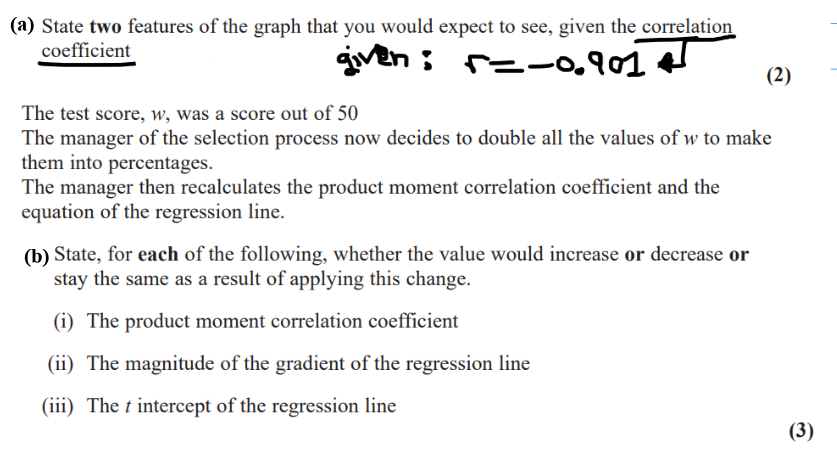
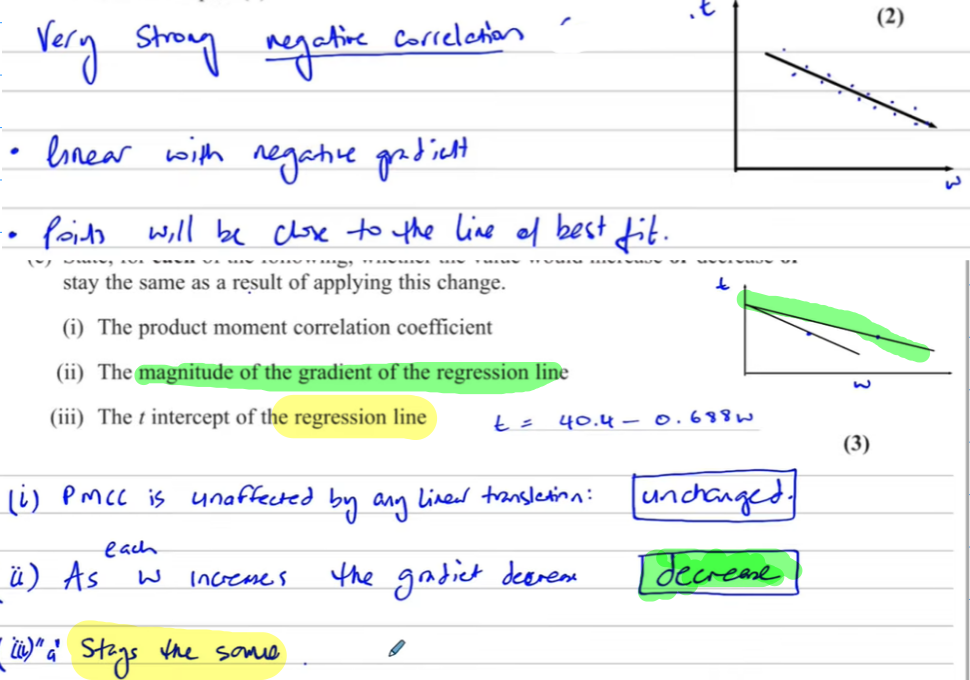
(a)

- points will lie close to a straight line

- there is linear relationship and a negative gradient

[ y intercept doesn’t change even if gradient doubles cuz:
y = mx + c
when m = 0 → y = c

ALSO for:
y = 67mx + c
when m = 0 → y = c
<p><strong>(a) </strong><br><br>-<strong><u><mark data-color="yellow" style="background-color: yellow; color: inherit;"> points will lie close to a straight line</mark></u></strong><br><br><strong><u>- there is linear relationship and a<mark data-color="yellow" style="background-color: yellow; color: inherit;"> negative gradient</mark></u></strong><br><br><strong>[ y intercept doesn’t change even if gradient doubles cuz:</strong><br><strong>y = mx + c </strong><br><strong>when m = 0 → <u> y = c</u></strong><br><br><strong>ALSO for:</strong><br><strong> y = 67mx + c</strong><br><strong>when m = 0 → <u>y = c</u></strong></p>
42
New cards
term image
knowt flashcard image
43
New cards
term image

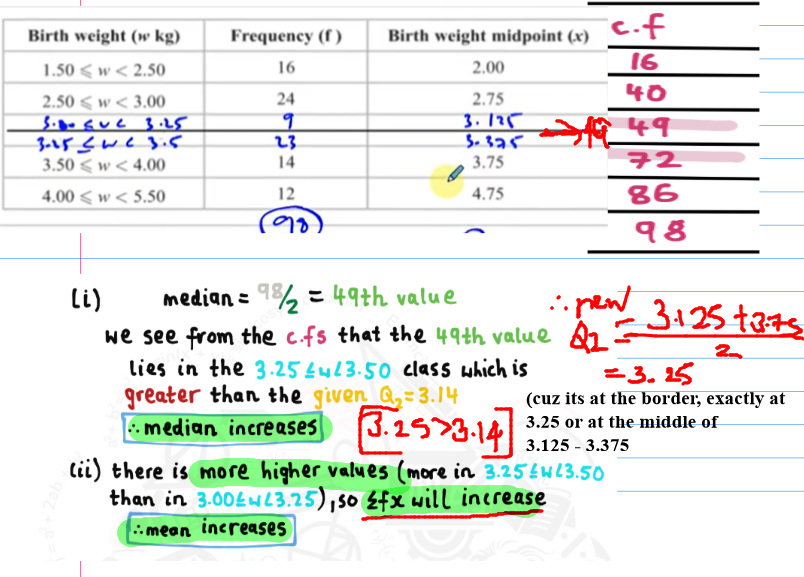
in summary:
new median i found is greater than old, hence median increases

new mean is greater as more higher values present, so sum of fx greater, hence mean greater
<p>in summary:<br>new median i found is greater than old, hence median increases<br><br>new mean is greater as more higher values present, so sum of fx greater, hence mean greater</p>
44
New cards
<p>give → mean 10 and standard deviation</p>

give → mean 10 and standard deviation

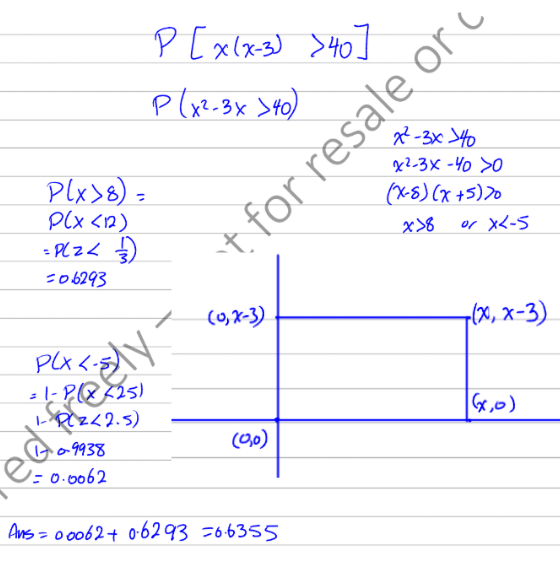
i almost got all marks, basically when x² -3x -40 > 0
X> 8 OR X< -5

so p( X >8 ) + p(X< -5)

(+ sign as it is OR)
i multplied but should have added
<p>i almost got all marks, basically when x² -3x -40 &gt; 0<br>X&gt; 8 <strong><u>OR</u></strong> X&lt; -5<br><br>so p( X &gt;8 )  <strong><u>+ </u></strong> p(X&lt; -5)<br><br><strong><u>(+ sign as it is OR) </u></strong> <br>i multplied but should have added</p>
45
New cards
term image
knowt flashcard image
46
New cards
term image

again pretty easy, just gotta be a bit more careful
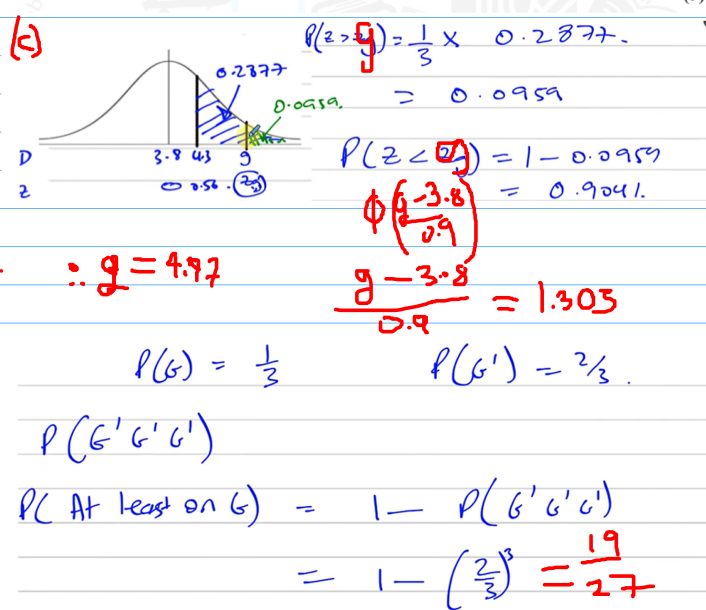
<p>again pretty easy, just gotta be a bit more careful</p>
47
New cards
<p>given outlier is <br>more than 1.5(IQR)<br>less than 1.5(IQR)<br><br></p>

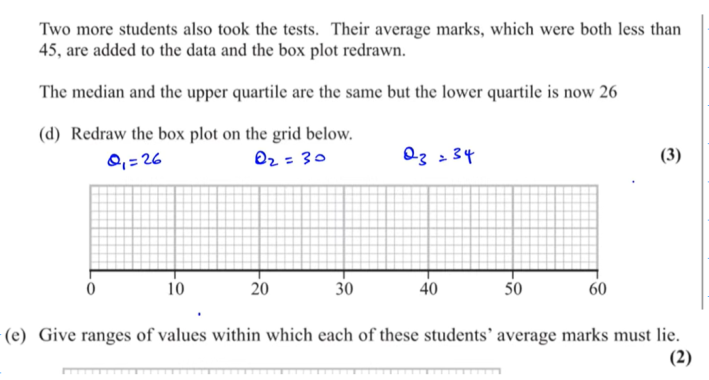
given outlier is
more than 1.5(IQR)
less than 1.5(IQR)

here since Q1 is changed, you gotta find new outliers

( i forgot to find the new outliers……..)


if Q1 increases from 24 →26, the numbers added must be more than Q1 (but less than median/Q2 as Q2 is same in question)

also since Q2 and Q3 is same, the other number must be more than Q3 to balance out this change (also cant be more than 45 as 45 is UL)


SO answer for (e) So one between 26 and 30 and one between 34 to 45
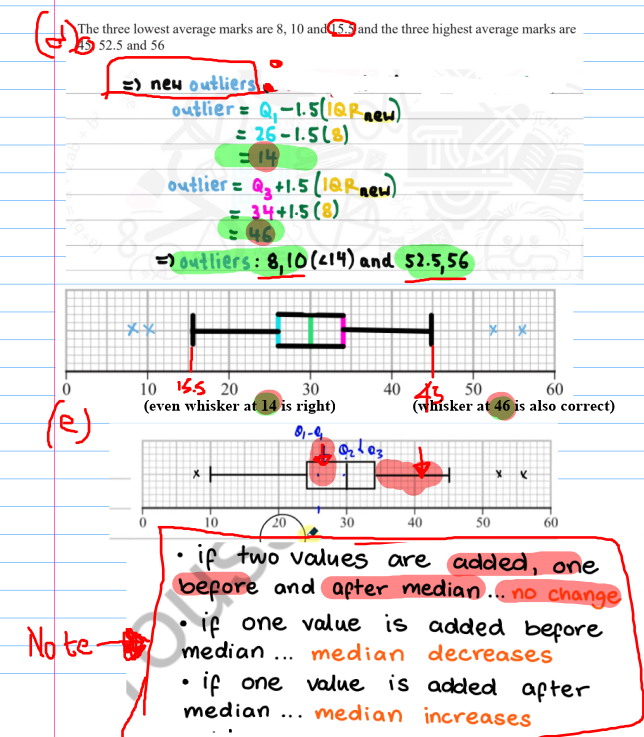
<p>here since Q1 is changed, you gotta find new outliers</p><p>( i forgot to find the new outliers……..)<br><br><br>if Q1 increases from 24 →26, the numbers added must be more than Q1 (but less than median/Q2 as Q2 is same in question)<br><br>also since Q2 and Q3 is same, the other number must be more than Q3 to balance out this change (also cant be more than 45 as 45 is UL)<br><br><br>SO answer for (e) So one<strong><u> between 26 and 30</u></strong> and one <strong><u>between 34 to 45</u></strong></p>
48
New cards
term image

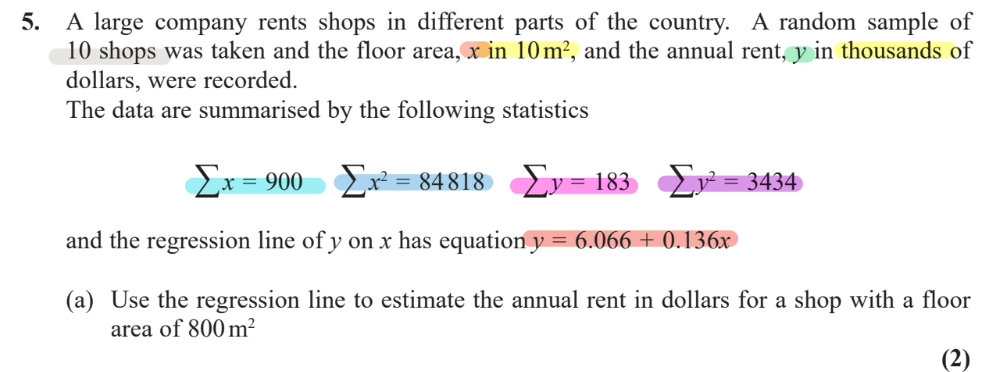
since its given area in 10m²,

x = 800 → x = 80 m²
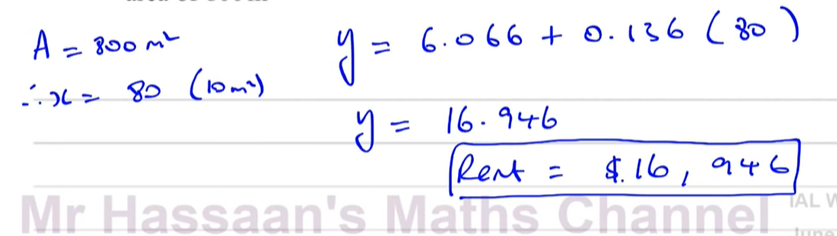
<p>since its given area <strong><u>in 10</u></strong>m², <br><br> <strong><u>x = 800 → x = 80 m²</u></strong><br></p>
49
New cards
term image

no change as we found x = 90 (x = 900 but in 10m² its 90)

mean x = 90

(x -x}(y-y} = 0
so new Sxy = old sxy + 0

thus Sxy remains the same
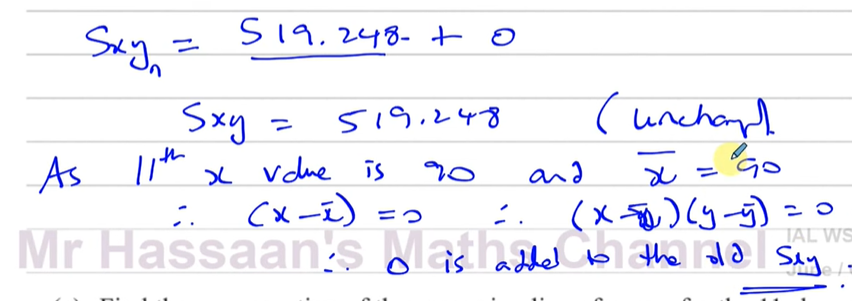
<p>no change as we found x = 90 (x = 900 but in 10m² its 90)<br><br>mean x = 90<br><br>(x -x}(y-y} = 0 <br>so new Sxy = old sxy + 0<br><br>thus Sxy remains the same</p>
50
New cards
term image
knowt flashcard image