reliability - class 4
1/44
There's no tags or description
Looks like no tags are added yet.
Name | Mastery | Learn | Test | Matching | Spaced |
|---|
No study sessions yet.
45 Terms
reliability (3)
reliability = consistency in scores
*Reliability indicates how consistent and dependable a test in giving the same scores
If a test is reliable: Means that we can trust the test results that indicate the test taker's true ability AND we can trust that the test will give consistent results over and over again
most important standard for determining how trustworthy data from a psychogical test are
a reliable test is one we can trust to give us the same score for a person every time it is used
Ex. Weight scale. A scale that is reliable will give you the same weight each time (assuming other factors don't change) *the same should apply to psychological tests--every time you take a test you should get the same score
A child runs a race. 5 different raters record the time it takes. Result: 5 different times for the same runner. Which time represents the true speed?
Since the child only ran once, there should be one accurate score.
In practice, we estimate the true score by taking the mean of the 5 times
Why Take the Mean? (3)
Averaging the scores gives the best estimate of the true score.
Reasoning (Classical Test Theory assumption):
Errors are randomly distributed. *Some raters may overestimate, others underestimate.
Random errors cancel each other out. Therefore, the mean of errors = 0.
The average score across raters provides the closest estimate of the true score.
Classical Test Theory (CTT) or true score theory
1)Assumes each observed test score (x) is composed of true score (t) and error (non-systematic, or random error)
2)assumes no measurement instrument is perfectly reliable *without error
3)assumes each one has only one true score
4)measurement errors are random
5)measurement error is normally distributed
6)variance of observed scores = variance of true scores + error variance
7)variance of true scores = observed scores - error variance
8)assumption on two tests being parallel
3)CTT assumes each person has only one true score
a person’s true score = hypothetical or ideal measure of a person’s attribute we aim to capture with a psycholgical test
it is free from error
it’s defined as the expected score over an infinite number of independant adminitations of the test
*If takes test multiple times have multiple observed scores, but only one true score
*If we give the person the same test over and over, there true score will be the mean of that dist of scores—this is the expected score over an infinite # of administrations of the scale
True Score Defined
The expected score over an infinite number of test administrations.
If you gave someone the same test an unlimited number of times under identical conditions, their observed scores would vary because of random error.
The mean of that distribution of observed scores = the person’s true score.
independant adminitation (2)
independant adminitation = each time the test is taken and is unrelated to previous or future administrations
*They are unrelated (this is the theoretical idea)
*Independent administration = each time test is taken, it is unrelated to the next time the person takes the test
the person’s performance on one occiaions doesn’t influence their performance on another
*But there are practice effects--you get practice at taking the test, which influences future scores
4)CTT assumes measurement errors are random (3)
CTT assumes measurement errors are random:
mean error of measurement = 0
errors are uncorrelated with each other
true scores and errors are uncorrelated
mean error of measurement = 0
Across many test administrations, the average error cancels out.
Some scores will be too high, some too low, but on average, the errors balance.
This is why the mean of observed scores over infinite testing equals the true score.
Errors are uncorrelated with each other (3)
The error on one test administration does not predict the error on another.
Example: If you guessed correctly on one item, that does not make it more or less likely you’ll guess correctly on another.
This assumption makes errors purely random noise, not systematic.
True scores and errors are uncorrelated (2)
A person’s true ability is unrelated to the size or direction of error.
Example: High-ability students aren’t consistently more affected by random distractions than low-ability students.
If true scores and errors were correlated, then errors would bias measurement instead of just adding noise.
random error (5)
Nature: Random, unpredictable, happens “out of the blue.”
Effect on scores:
Sometimes increases, sometimes decreases a score.
Cancels itself out over repeated measurements.
Impact on reliability: Lowers reliability because scores vary inconsistently.
Validity: Still possible to estimate the true score since errors are random and cancel out.
systematic error (4)
Nature: Consistent, comes from the same source every time.
Effect on scores: Always increases or decreases true scores by the same amount. Influences all participants in the same way each time the test is administered.
Impact on reliability: Does not lower reliability—the test gives consistent results. But those results are consistently wrong.
Validity: Threatens validity because scores no longer reflect the true construct. The test is reliable but not accurate.
random vs systematic error (3)
random error: random in nature, cancels itself out, lower reliability of a test *lowers reliability, but error cancels out on average.
systematic error: occurs when source and amount of error always increase or decrease a true score
does not lower reliability of a test since the test is reliable inaccurate by the same amount each time] *doesn’t harm reliability, but harms validity (consistent bias).
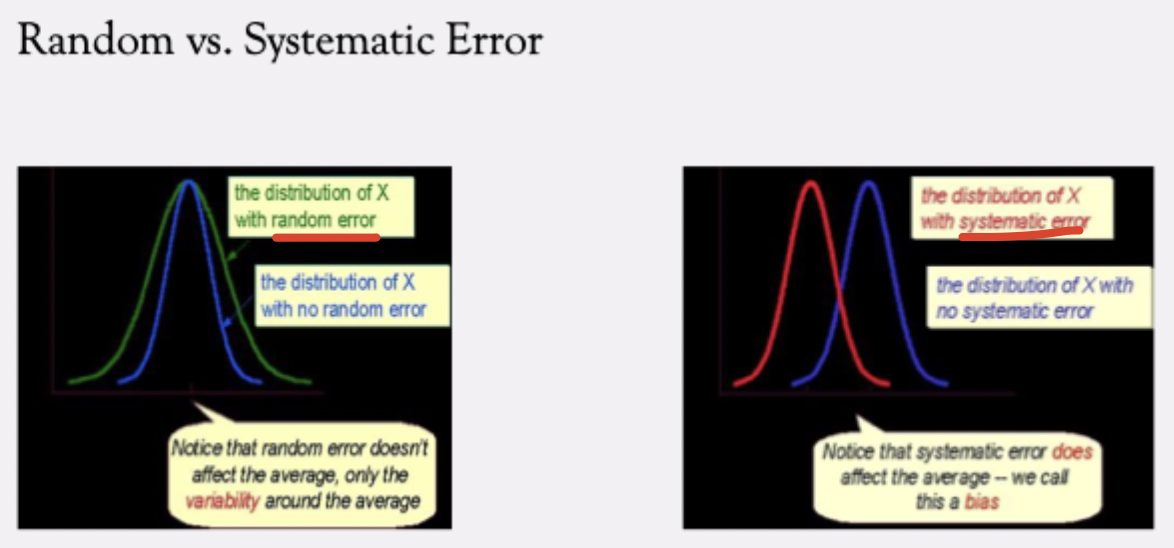
Systematic vs. Random Error in Distributions
Random Error: Makes the observed score distribution wider (more spread out) than the true score distribution. *random error doesn’t affect the average, only teh variability around the average
Peaks of the two distributions are the same, since mean random error = 0. Reliability decreases because of increased variability, but validity isn’t biased.
Systematic Error: Shifts the entire distribution of observed scores away from the true scores. *systemic error does affect the average—we call this bias
The peak (mean) of the observed score distribution ≠ true score distribution. (Ex. A miscalibrated scale always adds +5 lbs → test is reliable but not valid.)
Reliability = Consistency Under the Same Conditions (3)
Reliability means: if the test is administered under the same conditions, results should be stable.
Example: Weighing yourself.
Without clothes = one observed weight.
With clothes = another observed weight.
Both should reflect the same true weight, but error (clothes, scale differences) shifts the observed score.
Reliability at the Individual vs. Population Level (4)
Individual level (CTT idea): Reliability = the relationship between an individual’s observed scores and their true score across an infinite number of test administrations.
Observed = True + Error.
Population level: Same assumptions (true score, random error, systematic error) apply when testing many people.
Reliability is about how consistently the test reflects true differences among people in the larger population.
3 sources of measurement error
1)content sampling error
2)time sampline error
3)other sources of errror
1)content sampling error (3 sources of measurement error) (3)
results from differences between the sample of items (i.e. the test) and the domain of items (i.e. all the possible items) *Results from differences between the sample of items on a test and the larger domain of items the test is supposed to represent.
content sampling error happens when test items may not be representative of the domain from which they are drawn *Occurs when test items are not fully representative of the domain.
content sampling error is low when test items are represenative of the domain
Causes of Content Sampling Error (3)
Limited item coverage: A domain may be broad (e.g., agreeableness) but a test can only include a subset of items.
(Ex: agreeableness behaviors could include smiling at people, being polite, helping, etc.—but only a fraction can appear on a test.)
Small test length: A test with very few items (e.g., 10 questions) cannot adequately represent the entire domain.
Unrepresentative or duplicated items: If test items do not reflect the full domain (or repeat the same kind of item), error increases.
Impact of Content Sampling Error on Reliability
High content sampling error → test reliability decreases.
Low content sampling error → test reliability improves (items accurately represent the construct).
Even with a good representative sample, responses may still vary due to other errors (e.g., not reading carefully).
How to Reduce Content Sampling Error
Increase test length → more items = better domain coverage.
Ensure items are representative of the construct domain.
Include diverse behaviors/examples from the full domain of interest.
2)time sampling error (3 sources of measurement error)
time sampling error results by choice of a particular time to administer the test *Error that arises from the choice of time when the test is administered.
random fluctuations in performance from one situaiton or time to another *Refers to random fluctuations in performance across different times or situations.
Reduces test reliability because results depend partly on when the test is given, leading to inconsistency in observed scores.
Causes of time sampling error (3)
Test given at different points in time (e.g., morning vs. afternoon, today vs. 2 months later).
Performance can vary due to fatigue, mood, environment, or practice effects.
Timing itself introduces variability not related to the true score.
3)other sources error (3 sources of measurement error) (3)
other sources error — scoring or administrative error
Scoring / Administrative Errors: Mistakes during test administration or scoring. (e.g. miscalculating total scores when adding)
Rater and Scoring Influences: Subjectivity or bias from raters. Differences in scoring criteria or leniency/strictness.
Miscellaneous Factors ("Anything else"): Situational distractions, miscommunication, or clerical errors. Any unintended factors outside the construct being measured that affect test scores.
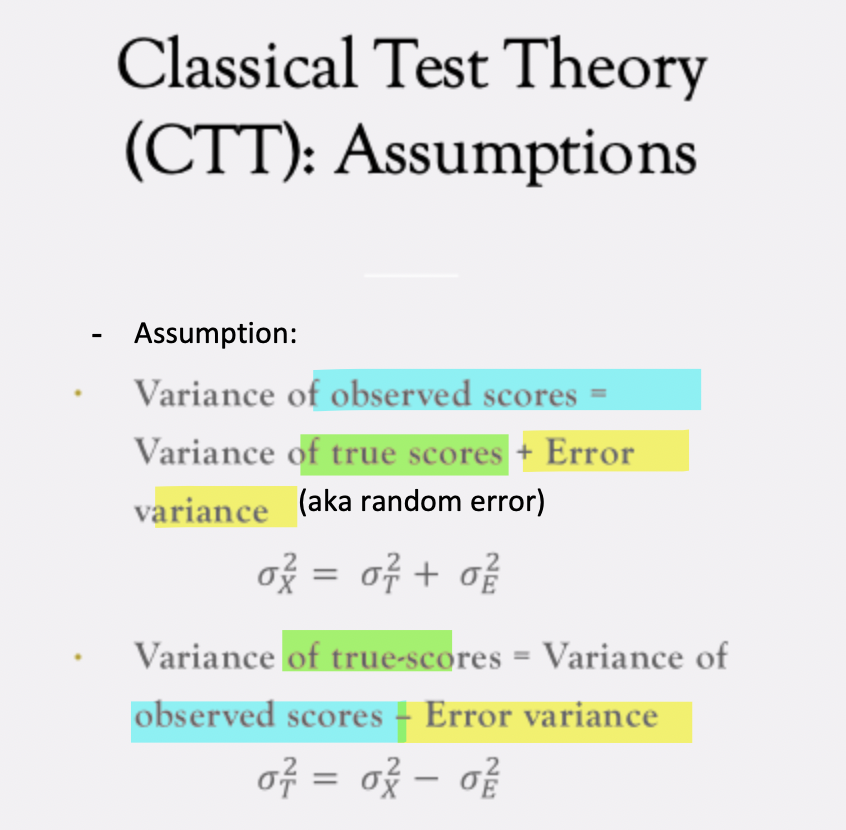
CTT assumption on the variance of observed (2 formulas)
CTT assumes that:
variance of observed scores (X) = variance of true scores (T) + error variance (E) (aka random error)
variance of true scores (T) = observed scores (X) - error variance (E)
*σ=variance
reliabiilty coefficient (3)
*A numerical estimate of how consistently a test measures a true score.
reliabiilty coefficient = true score variance / observed score variance
RE: Observed score = True score + Error
This ratio tells us what proportion of the observed score variance is due to true score variance rather than error.
reliabiilty coefficient = proportion of observed test scores accounted for by variability in true scores
The reliability coefficient quantifies the proportion of observed score variance that is systematically due to variability in true score, ranging from 0 (unreliable) to 1 (perfectly reliable).
range for reliability (4)
0 → No reliability
Observed scores do not reflect the true scores at all.
0% of observed score variance is due to the true score.
1 → Perfect reliability
Observed scores perfectly match true scores.
100% of observed score variance is due to the true score.
Between 0 and 1
Most tests fall somewhere in between.
Higher values = more reliable test.
Cannot be negative
Reliability is a ratio of two positive numbers (variance cannot be negative).
3 Criteria for Parallel Tests (Classical Test Theory)
CTT assumes two tests are parallel if:
1)Equal True Scores *true scores are the same
Each person has the same true score on both tests.
Implication: Equal observed scores reflect equal true scores.
2)Equal Error Variance
The variability due to measurement error is the same for both tests.
Ensures that differences in observed scores are not due to differing reliability.
3)Same Correlations with Other Tests
Both tests correlate equally with external measures of the construct.
Ensures consistency in how each test relates to other measures.
additional notes on Parallel Tests (Classical Test Theory)
Def: Two tests are considered parallel if they measure the same construct in exactly the same way, such that their scores are interchangeable.
Tests must have exactly the same observed score variance.
If true scores are equal, error variance will also be equal.
Parallel tests are a theoretical ideal; we assume they could exist in practice.
Parallel tests produce interchangeable scores, with the same true score, same error variance, and same pattern of correlations with other measures.
assumptions about error—estimating error with venn diagrams (CTT) (4)
assume errors are random and hence uncorrelated
*Errors are not influenced by the true score.
if errors are small, correlation will be large
if errors are large, correlation wil be small
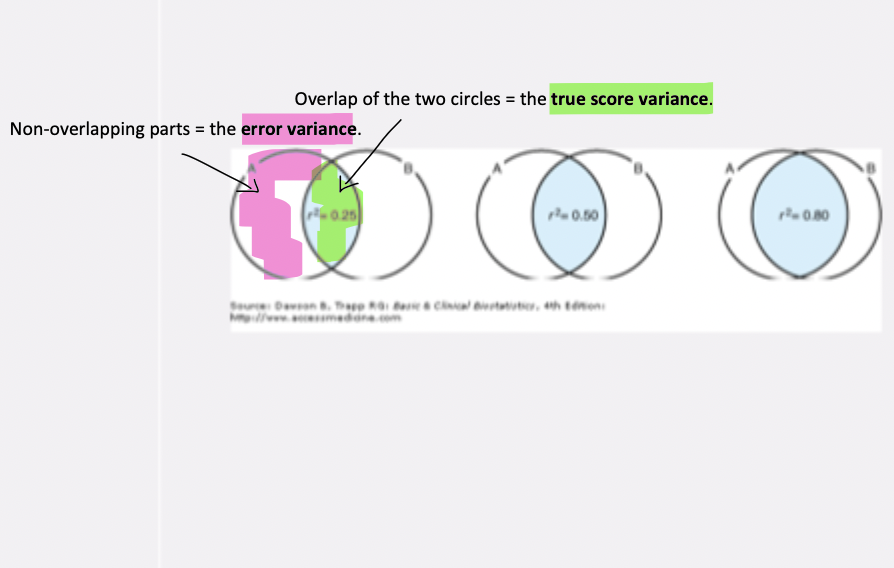
estimating error with venn diagrams (CTT)
Form A and Form B of the same test each provide a set of scores.
Overlap of the two circles = the true score variance.
Non-overlapping parts = the error variance.
Relationshps
Large overlap (scores highly correlated) → high reliability.
Small overlap (scores weakly correlated) → low reliability.
Correlation between test forms reflects true score consistency.
*RE: Observed score = True score + Error
implications of relationships—estimating error with venn diagrams (CTT)
The correlation between two forms of a test = an estimate of reliability.
High correlation → most variance explained by true scores.
Low correlation → a lot of variance is due to random error.
After estimating error, we calculate the SEM to quantify how much observed scores differ from true scores on average.
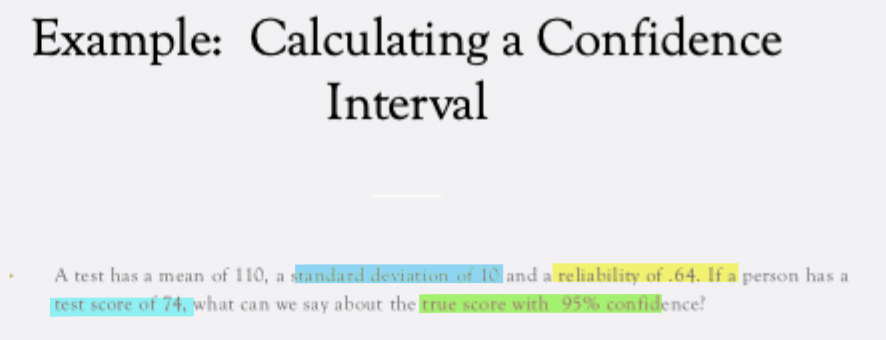
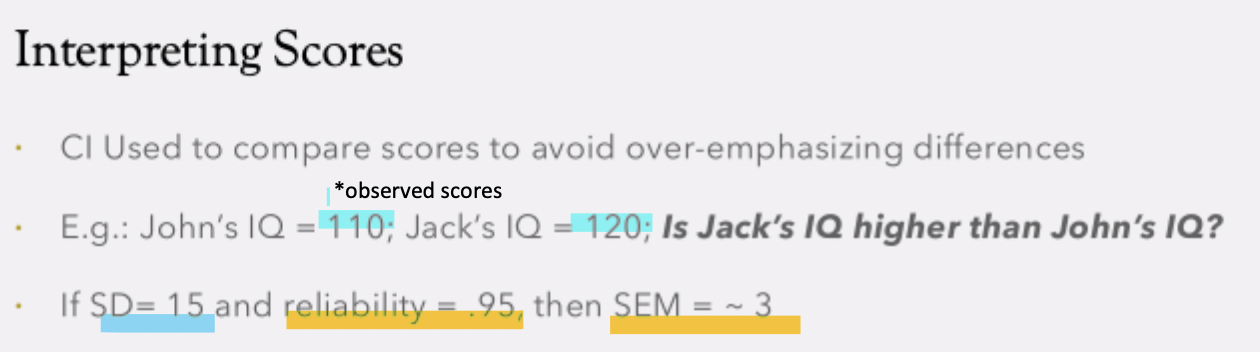
standard error of measurement (SEM)
indicates the amount of uncertainty or error expected in an individual’s obsvered test score
SEM corresponds to the SD of the distribution of scores onwards would obtain by repeatedly testing a person
allows us to quantify the amount of variation in a person’s obsvered score that measurement error would most likely cause
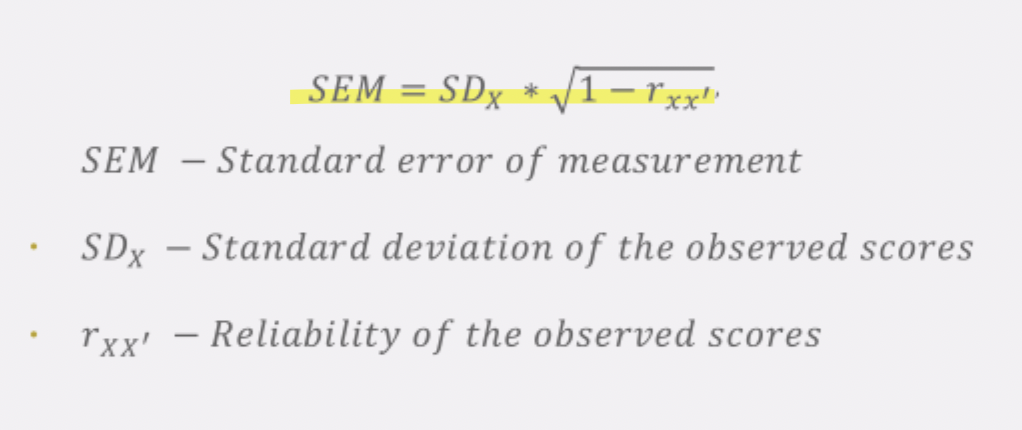
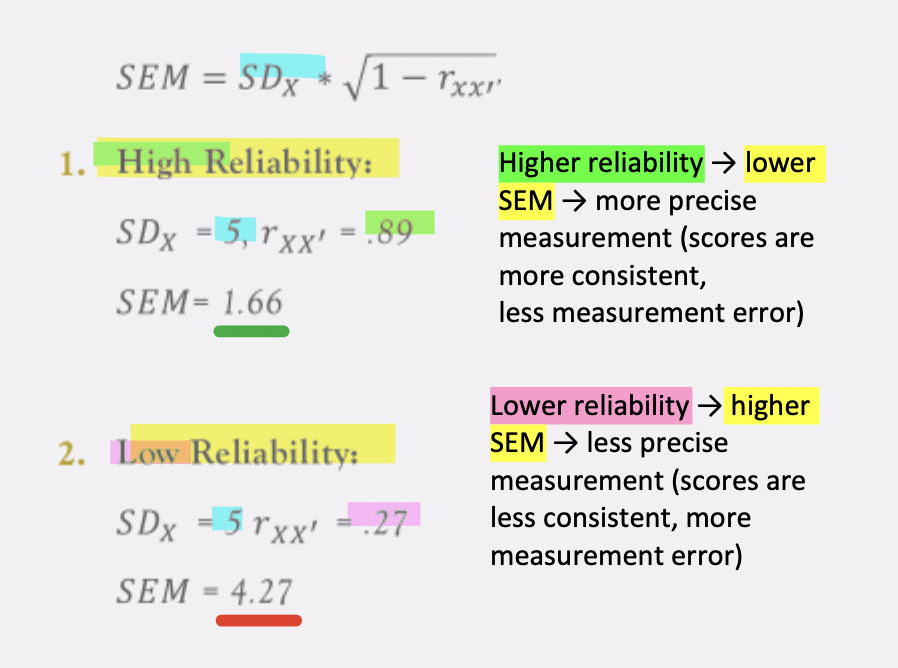
variables in SEM calculation (3)
SEM = standard error of measurement
Six = standard deviation of the observed scores
rxx’= reliability of the observed score
how SEM is affected by high reliability VS low reliability
SEM quantifies the amount of error in observed test scores. It is influenced by test reliability: higher reliability → lower SEM; lower reliability → higher SEM.
if SDx held constant:
Higher reliability → lower SEM → more precise measurement (scores are more consistent, less measurement error)
Lower reliability → higher SEM → less precise measurement (scores are less consistent, more measurement error)
Goal: maximize reliability to reduce measurement error
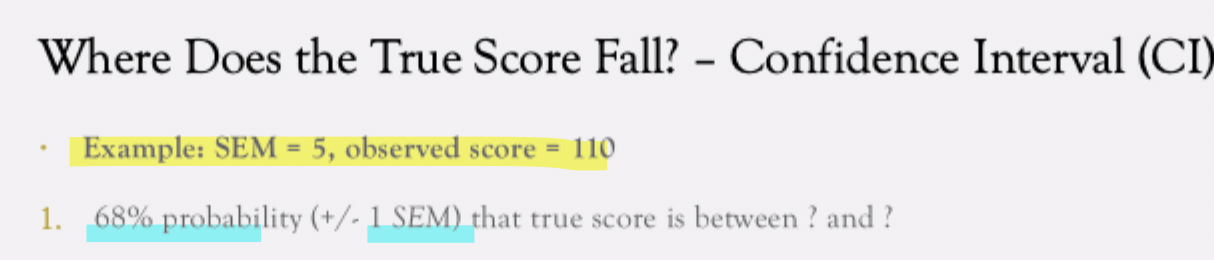
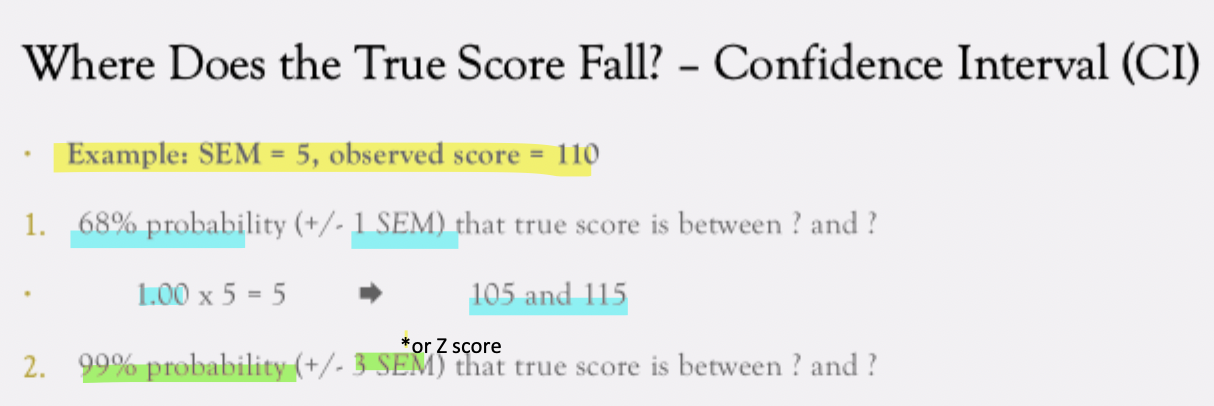
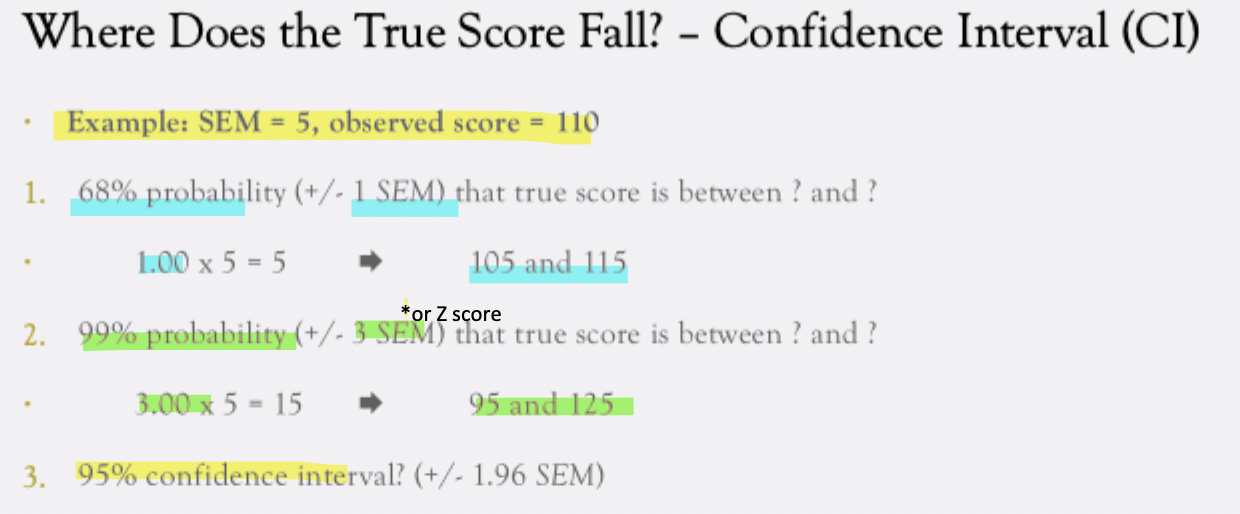
where does the true score fall?
confidence interval (CI) is a range of score that we feel condident will include the rule score
Observed test scores--bc error affects any test, observed test scores will vary from one occasion to another--whenever we administer the test
How do we know the score we observe is the true score
If we administer the test an infinite amount of times, the average should be the true score
How to frame our confidence in what's the range of scores in which the true score should be present
We use CIs
We administer a test multiple times and get diff observed scores bc of error
We frame confidence in terms of true score based on CI notion
CI
We use SEM to compute CI that tells us the ratio score in which we should the true score to be included
Another way of establishing reliability of a test
What is the range of scores than include the true score
We want to find the interval in which we feel confident the true score will be inclued based on observed test score
We have test score (x) and want to know range of scores around that test score that we feel confidence should include that true score
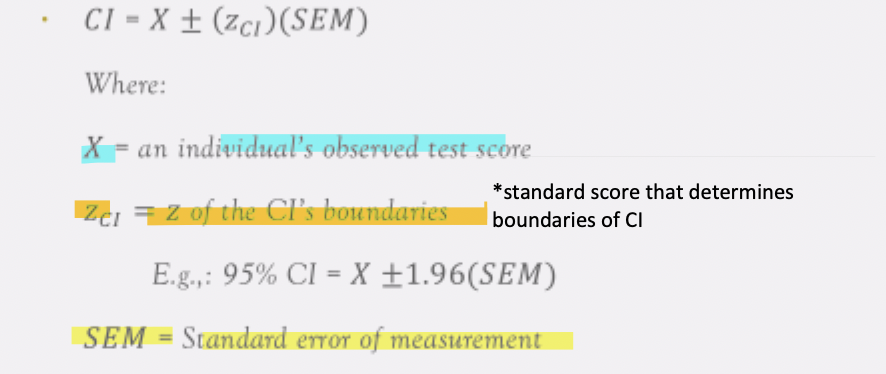
3 pts of CI formula
x = an indicual’s observed test score
Zci = z of the CI’s boundaries
SEM = standard error of measurement
Ex. WISC-IV
reliability and test length