PKPD Exam 5
 Call Kai
 Learn
Learn Practice Test
 Spaced Repetition
 Match
Match Flashcards
 Knowt Play
1/43

There's no tags or description
Looks like no tags are added yet.
Name | Mastery | Learn | Test | Matching | Spaced | Call with Kai | Chat |
|---|
No analytics yet
Send a link to your students to track their progress
44 Terms
Linear PK
Dose & concentration independent
PK parameters do not change with dose
Drug concentration and AUC increases proportionally to dose
Nonlinear PK
Handling of drug is not first order
Subject to capacity limited or dose dependent biological procsses
Linear PK Measures
Exposure (AUC, Cmax, CP,) vs. dose → increase proportionally
PK parameters (CL, V, Vss, T1/2, F) vs. dose → remain constant
PK parameters vs. time → remain constant
Dose normalized Cp ( Cp / dose) → should be superimposed
Nonlinear PK Measures
Exposure (AUC, Cmax, CP,) vs. dose → increase disproportionately
PK parameters (CL, V, Vss, T1/2, F) vs. dose → increases or decreases
ADME Saturability
Dissolution → concentration has upper limit, no matter how much more is added concentration remains the same
Metabolism → rate of enzyme metabolism approaches upper limit as substrate conc. increases
Transport → Rate of transport has upper limit
Plasma protein binding → protein binding is limited by available binding sites
Nonlinear Absorption
More than proportional → saturable efflux transporters
Less than proportional → saturable active absorption
Michaelis-Menten Elimination
Low Cp → Approximation to first order (rate of elim. = -km * Cp)
Cp = Km → mixed first and zero (rate of elim. = - Vm / 2)
High Cp → Approximation to zero order (rate of elim/ = -Vm)
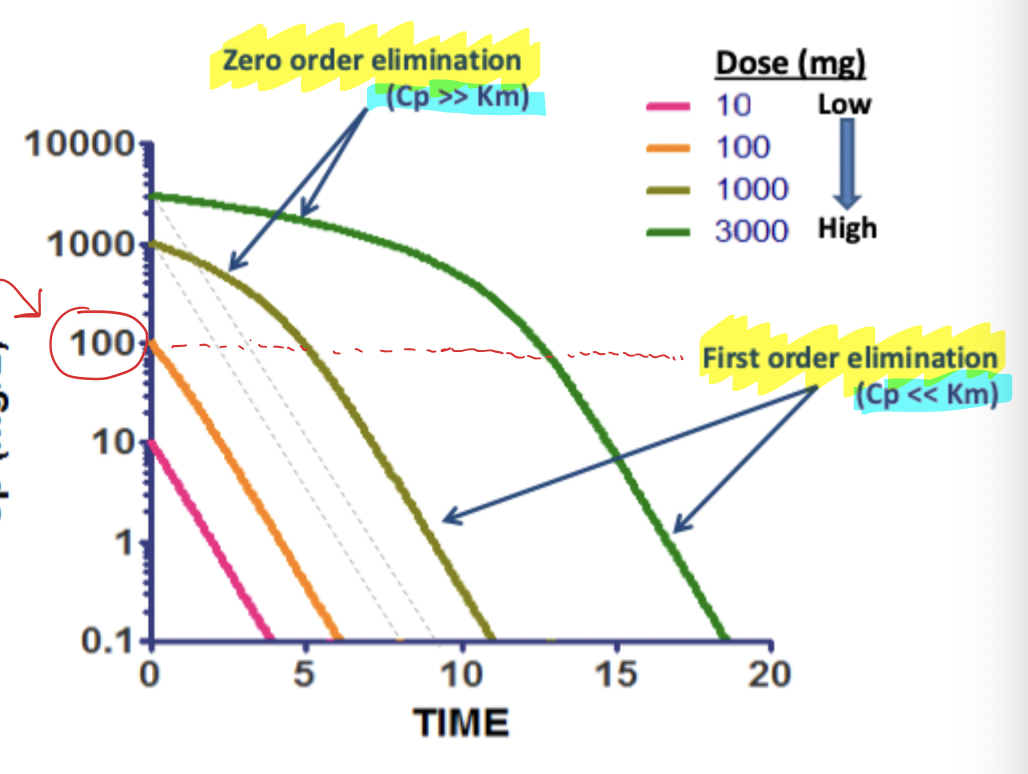
Semi-Log Plot that displays Saturable Metabolism
Km can be estimated when rate changes from zero to first order
Curve starts at zero order → maximum rate regardless of concentration
Once drops below Km → first order kinetics
Dose Dependent Clearance
As Cp(dose) increases → Clearance decreases
thus, Kel decreases and T1/2 increases
INITIALLY → increasing Cp increases elimination rate and clearance
saturation then slows this down
Average Concentration at Steady State
Steady state → rate of administration = rate of elimination
CP average can increase exponentially with increase dosing rate
should titrate dose changes due to small changes causing huge effects
Increasing dosing rate (DR) not only more than proportionally increases steady state conc. but also increases time required to reach 90% steady state
Nonlinear Renal Clearance
tubular secretion → saturable
renal clearance decreases (less drug put into urine and cleared)
tubular reabsorption → saturable
renal clearance increases (less drug reabsorbed into blood and excreted through urine)
Plasma Protein Binding Saturability
As Cp (dose increases) → Fu increases
Thus V increases (big V, not small V)
Clearance can increase or not change (depends on ER)
High ER → Cl ~ Q (no change)
Low ER → Cl = Fu* Clint (will increase)
Why is Oral dose limited for Biologics?
Low bioavailability
low permeability due to large size
lack of lipophilicity
rapid enzymatic inactivation or degradation
Pulmonary Biologics
Pros
Ease of administration, presence of large surface area, high vascularity, bypass first pass metabolism
Cons
Lung proteases, immune cell degradation, local side effects, MW limitations
SC & IM Injections Biologics
Cons
decreased F (site degradation / limited uptake into circulation)
Limited volume of fluid per injection
SC and IM routes only feasible for high potent drugs
Biologic Half Lives
Increase in MW increases T1/2
less renal clearance
resides more in lymph
Charge
Isoelectric point → pH net charge is zero
Higher isoelectric point at 7.4 pH will mean it is a positive charged molecular → more binding to proteins that can degrade it
FcRN
higher dose can saturate FcRn
Biologics Distribution
Most have small Vd due to limited volume of extracellular space and mobility
Glycosylation
Sugar on AB
Increasing Sialic Acid → decrease Clearance
prevent binding of AB to liver receptors to be metabolized
TMDD for mAb’s
TMDD → target mediated drug disposition
lower dose = faster clearance
low dose = all bound by metabolizing enzyme
high dose = saturates enzyme, lasts longer
dosing
low dose → higher clearance
high dose → FcRn saturation
ADCC & ADCP
bind to antibody coated cells and can destroy them
FCgamma helps clear proteins
Basic Tenets of Pharmacodynamics
Capacity-limitation → law of mass action and small quantity of targets leads to capacity limitations in most responses
Turnover & homeostasis → diseases and drugs both interfere with homeostasis in the body resulting from natural turnover of biological substances
Receptor Binding of Prednisolone
increasing drug increases bound drug
However, after Kd, the binding starts to hit a plateau
Clark’s Occupancy Theory
First model to account for quantitative behavior of a receptor mediated process
Pharmaceutical effect is directly proportional to the number of receptors bound
“Corpora non agunt nisi fixata” → substances do not act unless bound
Paul Ehrlich
How to find Slope (m)
Slope = m
Slopes of E vs. Log C plots are often linear
m = (Emax * gamma) / 4
S Slope
S slope = delta QT / delta Cp
Female population has a steeper S slope meaning more sensitive to changes in Cp and bigger QT effects
Estimating Parameters of Sigmoid Emax Models
When the highest measured of effect intensity was less than 95% of Emax, than Emax and EC50 were poorly estimated
Equation of Life
Function = capacity * substrate / 1/affinity + substrate
Derived from law of mass action
Simple Direct Effects
Examples
ACE activity, platelet aggregation, muscle activity, EKG, lymphocyte activity
Duration of Effect
Td (duration of effect) will increase with:
larger dose
longer T1/2
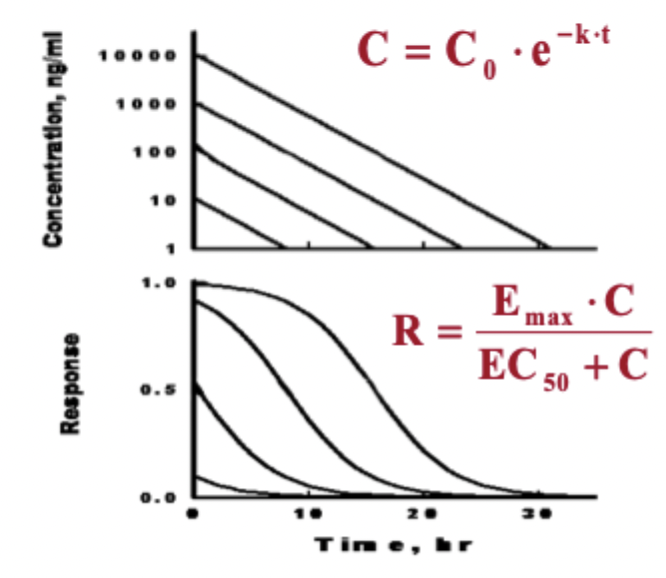
Expected PK/PD Graphs
PK → Linear decrease of concentration over time
PD → decrease in response over time, increasing dose increases duration, highest doses hit plateau
Biological Turnover Rates from Fast to Slow
Electrical signalIn
Neurotransmitters
Chemical signals
hormones
mRNA
Proteins
Cells
tissues
organs
Human
Indirect Response Models
Model 1 → inhibits Kin
Model 2 → inhibits Kout
Model 3 → stimulates Kin
Model 4 → stimulates Kout
Rosiglitazone Model 4
Rosiglitazone stimulates insulin transporters (making more sensitive) and therefore stimulated Kout of blood glucose (model 4)
SGLT2 Inhibitors
inhibit Kout of urine reabsorption (model 2)
therefore more glucose is excreted through urine
DPP4 Inhibitors and GLP1
GLP1 exerts main effect by stimulate insulin release from pancreas
GLP1 is broken down by DPP4 enzymes
GLP1 also exerts effects by slowing gastric emptying, reducing food intake
Population PK
Study of variability in drug concentrations across individuals in target population
Focuses on interindividual variability
supports dose optimization in real world settings
Covariates
Factors affecting PK / PD
disease
age
diet / nutrition
weight
genetics
etc..
Covariate Model
Quantitative relationship between parameter values and covariates
Statistical Model
Variability of parameter values across populations of patients
between subject variability
Residual unexplained variability
Structural Model
Defines shape of curve
1 compartment, 2 compartment models
Mean PK parameter values (Cl, V, F)
Interindividual Variability
How each individual deviates from the population mean
Residual Variability
Variance from each individual from their own mean predicted curve
Sources of Residual Variability
Measurement Error (observed data)
Assay variability
Investigator, patient
Measurement Error (time)
Investigator, patient
PKPD Model
inappropriate or incomplete model
intraindividual variability
data errors
Population PK Parameters
Include:
Mean parameter values
quantitative relationships between parameter values and covariates
Variability of parameter values across populations