Taxes and Subsidies
 Call Kai
 Learn
Learn Practice Test
 Spaced Repetition
 Match
Match Flashcards
 Knowt Play
1/22

There's no tags or description
Looks like no tags are added yet.
Name | Mastery | Learn | Test | Matching | Spaced | Call with Kai | Chat |
|---|
No analytics yet
Send a link to your students to track their progress
23 Terms
What are the two types of tax (give examples of both)
Direct tax - corporation, income tax
Indirect tax - VAT, sugar, plastic bag charge
Draw a specific indirect tax onto a diagram
parallel inward shift of the supply curve
What are the different types of indirect taxes
specific indirect
Ad-valorem
What is a direct tax
imposed directly on your income
What is a indirect tax
imposed on things you purchase rather than straight onto your income
What is a specific indirect tax
this is a set tax per unit e.g. 10p per plastic bag
each additional unit purchased the price increases by the same amount each time
What is an Ad-Valorem tax
This is a percentage tax on the unit price e.g. 20% VAT
increases by the same proportional amount each time
Draw an Ad-valorem tax onto a diagram
pivotal inward shift of supply
How does the addition of a specific tax affect demand
causes it to contract as the supply curve moves inwards
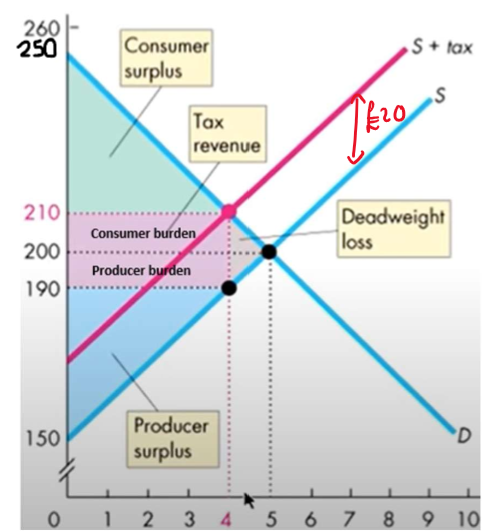
Draw and label a specific tax diagram labelling:
consumer burden
producer burden
consumer surplus
tax revenue
producer surplus
DWL
CS from new supply line to equilibrium
CS and CB on the top
What are the welfare implications of a specific tax
CS reduces
PS reduces
creates a DWL
Why is there a DWL when a tax is added
The gain in government revenue (CB+PB) is less than the loss in consumer and producer surplus, meaning there is a DWL
CS + PS > CB + PB = DWL
How can you calculate the DWL
(CS + PS) - gain in gov.t revenue = DWL
What are the features of inelastic demand in terms of a tax diagram
less effective a specific tax is in reducing the market equilibrium quantity
the more effective it is in raising the equilibrium price
the consumer burden is larger than the producer burden
the more revenue is received by the government
DWL is lower
Why is the consumer burden larger than the producer burden on a relatively inelastic tax diagram, illustrate this on a diagram
As the producer knows that an increase in the price of the product will not change demand that much. Therefore, they pass on the majority of the burden to the consumer
What is a sin tax
taxes placed on products which are harmful to us or the environment, in an attempt to deter us from buying them e.g. cigarettes
Why do sin taxes benefit the gov.t
as they are placed on products with relatively inelastic demand (addictive/necessity0
So the tax doesn’t reduce the equilibrium quantity as people keep purchasing them
price level increases a lot so the gov.t receives lots of tax revenue
Define a subsidy
A government grant given to producers to lower their cost of production
What are subsidies given towards
research and development of new technologies
training workers
Draw and label a subsidy diagram
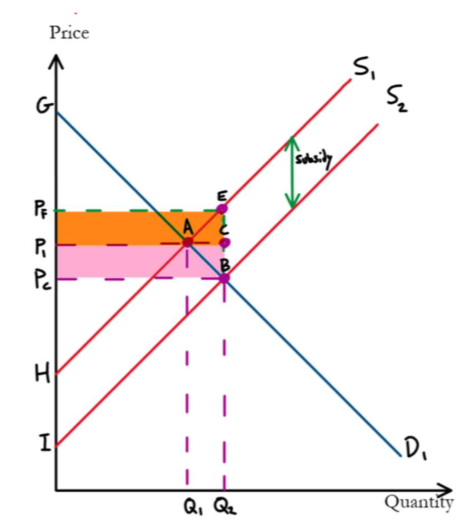
What are the two key differences of a subsidy diagram to a tax diagram
subsidies are good for consumers and producers so are benefits not burdens
the benefit rectangle for consumers is below producers
Why is there a DWL when a subsidy is added
the gain in consumer and producer surplus is smaller than the cost of the subsidy to the gov.t
What are the key features of a inelastic demand curve on a subsidy diagram
the less effective a subsidy is in increasing the market equilibrium quantity
the more effective a subsidy is in decreasing the equilibrium price
the consumer benefit is larger than the producer benefit
DWL is lower