Data Science Interview Review
1/9
Earn XP
Description and Tags
Data science type topics, but not just limited to data science
Name | Mastery | Learn | Test | Matching | Spaced | Call with Kai |
|---|
No analytics yet
Send a link to your students to track their progress
10 Terms
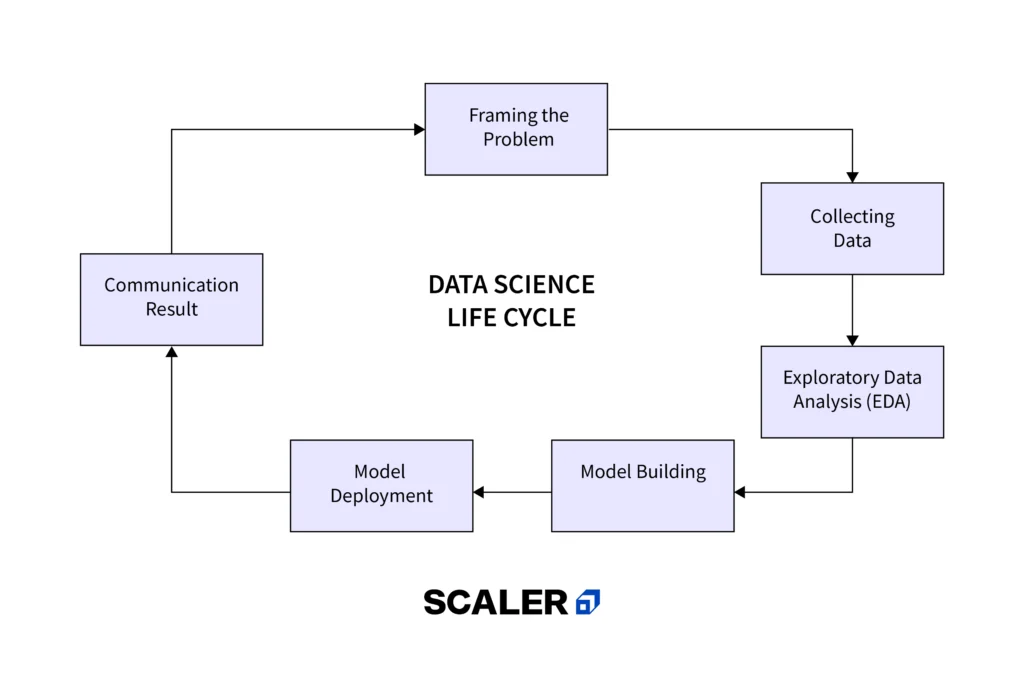
Data Science Process Lifecycle
Framing the problem
Collecting data
Exploratory Data Analysis (EDA)
Model building
Model development
Communication result
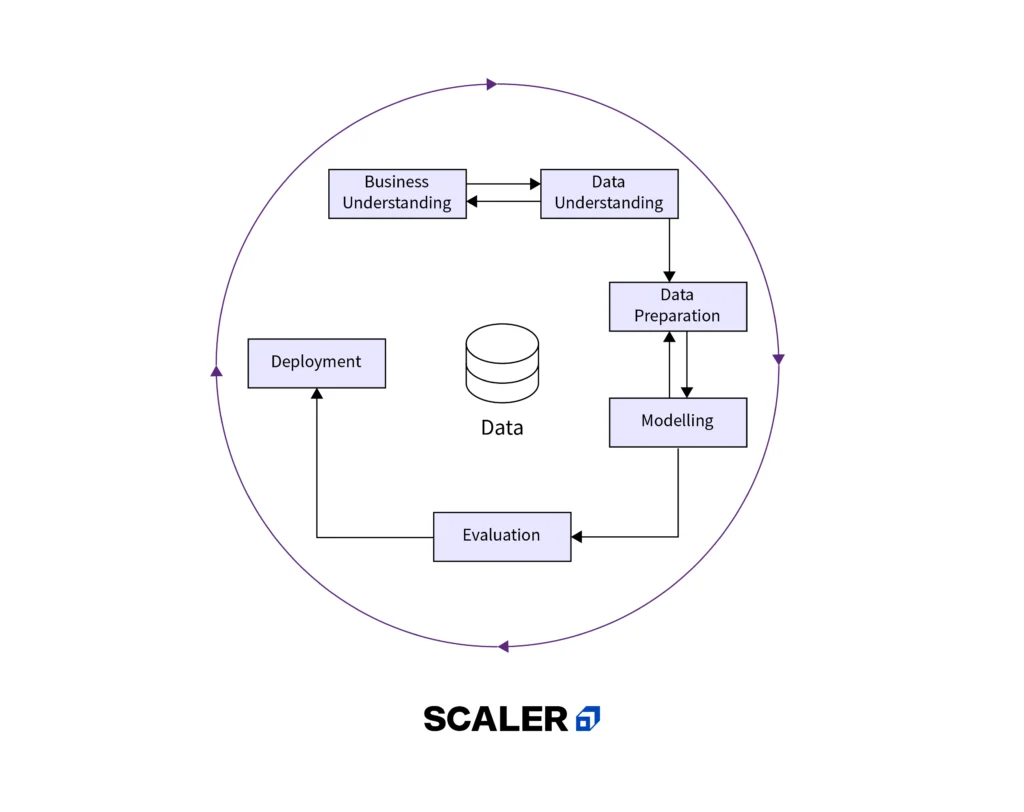
Data Science Process Framework - CRISP-DM (Cross-Industry Standard Process for Data Mining)
Business Understanding
Data Understanding
Data Preparation
Modeling
Evaluation
Development
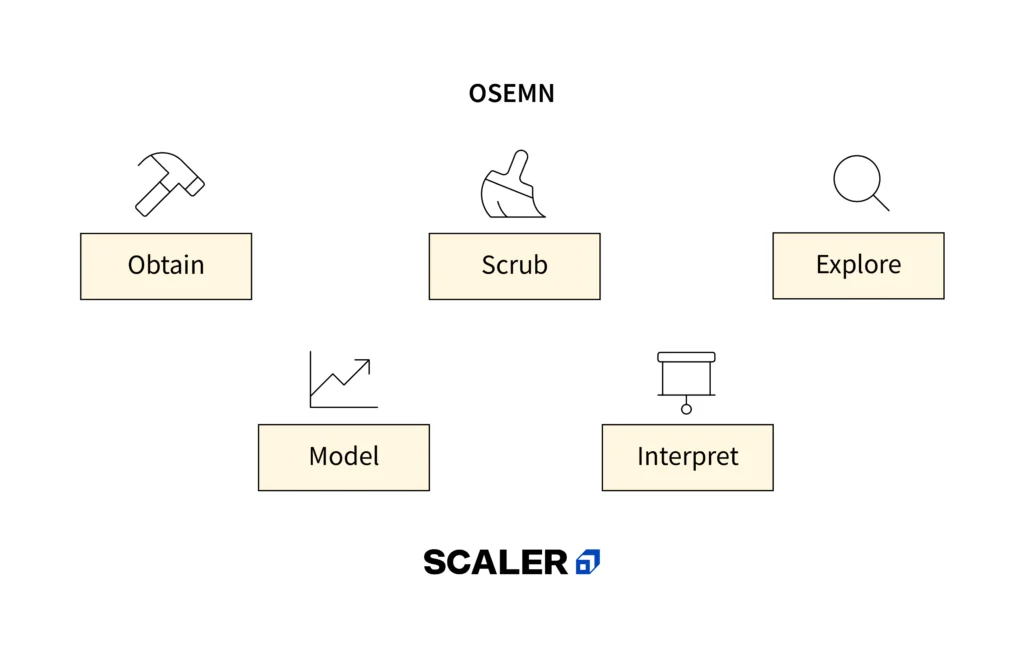
Data Science Framework - OSEMN
Obtain Data
Scrub Data
Explore Data
Model Data
Interpret Results
Model Overfitting
When a model learns the training data too well
Model Underfitting
Happens when a model is too simple to capture the underlying patterns in the data
Regularization Technique
A technique used to avoid overfitting by trying to make the model more simple. One way to apply regularization is by adding the weights to the loss function. This is done in order to consider minimizing unimportant weights.
L1 Regularization
We add the sum of the absolute of the weights to the loss function
Loss (L1) : Cost function + L * |weights|
Penalizes weights by adding a term to the loss function which is the absolute value of the loss. This leads to it removing small values of the parameters leading in the end of the parameter hitting zero and staying there for the rest of the epochs.
L2 Regularization
We add the sum of the squares of the weights to the loss function.
Loss (L2): Cost function + L * weights ²
Penalizes huge parameters preventing any of the single parameters from getting too large. Weights never become zeros, adding parameters square to the loss, preventing the model from overfitting any single feature.
Gradient Descent
Is a generic optimization algorithm cable for finding optimal solutions to a wide range of problems. The general idea of gradient descent is to tweak parameters iteratively in order to minimize a cost function.
Statistical Power
Refers to the ability of a statistical test or analysis to detect an effect or relationship if one truly exists in the population being studied. In other words, it is the probability of correctly rejecting a false null hypothesis.
High power has a greater chance of detecting a true effect, whereas a test with low power is less likely to detect a true effect even if it exists
Depends on factors such as the sample size, the significance level, the effect size, and the variability of the data
High statistical power is desirable in research because it increases the likelihood of obtaining accurate and reliable results
Typically reported as a number between 0 and 1
0.80 (80%) is typically considered desirable
Applications: Experimental design, hypothesis testing, sample size determination, meta-analysis (evidence across multiple studies)