Core skills: Experimenal design
1/166
There's no tags or description
Looks like no tags are added yet.
Name | Mastery | Learn | Test | Matching | Spaced | Call with Kai |
|---|
No analytics yet
Send a link to your students to track their progress
167 Terms
describe the scientific method
A systematic approach used by scientists to investigate natural phenomena, acquire new knowledge, or solve problems, the steps include; observation, question, hypothesis, prediction, experimentation, data collection, analysis and conclusion and communication.
Describe what makes a good hypothesis
must be testable, falsifiable (formulated in a way that it can be proven false), specific, based on existing knowledge, predictive, simple, relevant and modifiable.
Explain the difference between the null and alternative hypothesis
the null hypothesis states there is no significant effect or difference between groups or conditions being compared, and is what the researcher aims to reject based on collected evidence. The alternative hypothesis suggests that there is a significant effect or difference between groups or conditions, and is what the researcher hopes to support.
define Induction
the derivation of general ideas from specific observations. Involves making conclusions based on patterns or trends observed in collected data.
define Hypothetico-deductive reasoning
An alternative to inductive reasoning involving the formation of testable hypothesis.
define a theory
a set of general ideas or rules which are used to explain a group of observations. A theory is normally more general or broad in scope than a hypothesis
define a paradigm
a set of beliefs, assumptions, and practices that define a particular scientific discipline at a given time. Paradigms serve as frameworks or models through which scientists interpret observations, conduct research, and make sense of the world.
Define a paradigm shift
A dramatic change in the way we think about a subject in science when the evidence has accumulated in favour of rejecting a previous set of hypotheses or theories
what is nominal data?
non quantitative data in the form of categories with names e.g. male and female.
define discrete data
data that consists of distinct, separate values with clear boundaries between them.
define ordinal data
non-quantitative data that is ranked or are on a rating scale – do not know the size of the difference between the categories.
Define continuous data
quantitative measurements on a scale, can take on any value within a given range.
what are the different measures of variability?
range, variance, standard deviation.
What are the measures of central tendency?
mean, median, mode.
Define mean
the sum of all values in a dataset divided by the number of values. It represents the "centre" of the data and is sensitive to extreme values.
Define median
the middle value in a dataset when the values are arranged in ascending or descending order.
Define mode
the value that occurs most frequently in a dataset
what is a frequency histogram?
graphical representation of the distribution of a dataset, particularly for numerical or continuous data. It displays the frequency or count of observations falling within various intervals or bins.
define deviate
The distance between a particular data-point/observation and the mean. In some contexts, a deviate is known as a “residual”.
what is the sum of squares (ss)?
The total of all the squared deviates for a particular data-set. We square the deviates to get rid of any minus signs. The sum of squares therefore quantifies the magnitude of the total variability in a data-set but ignores the direction of that variability.
what is variance (s²)?
quantifies the spread or dispersion of a dataset by calculating the average of the squared differences between each data point and the mean of the dataset.
what is standard deviation?
statistical measure of the dispersion or variability of a dataset. It quantifies the average distance of data points from the mean of the dataset, providing a measure of how spread out the values are from the average.
define population vs sample
all the individuals in a particular group v.s a sub-set of a population, normally chosen to represent the population.
describe normal distribution/bell curve
symmetry, 68.5% of all data-points in a normal population will be within one standard deviation of the mean. Normal populations are common in biology.
what is skewed distribution?
a type of probability distribution where the data values are not evenly distributed around the mean. Instead, the distribution exhibits a tail that extends more prominently in one direction than the other.
what are parametric statistics?
Statistics or tests which make several key assumptions about the distribution of the data from which they are calculated. For example, parametric tests often assume that data are normally distributed.
what are non-parametric statistics?
Statistics or tests which make fewer assumptions about your data. They do not assume a normal distribution.
describe the Poisson distribution
models the probability of observing a specific number of events occurring within a fixed interval of time or space, given a known average rate of occurrence and assuming independence between events.
describe the binominal distribution
Similar to the Poisson distribution, the binomial distribution is often a good description of discrete data, but only in situations where the maximum possible count is close to the mean
when does bias occur?
when there is a systematic error in your measurements
what is a confounding variable?
a third variable that is related to both the independent variable and the dependent variable in a study, potentially distorting or masking the true relationship between them. It can lead to erroneous conclusions if not properly controlled for, as it introduces a spurious association between the variables of interest.
what is an independent variable?
a factor manipulated or controlled by the researcher in an experiment to determine its effect on the dependent variable.
what is a dependant variable?
the outcome or response that is measured or observed in an experiment, and its value depends on the independent variable
what are floor and ceiling effects in experimental design?
where the majority of participants score at the extreme low (floor) or extreme high (ceiling) end of a measurement scale, respectively, limiting the ability to accurately measure differences between groups or conditions.
What is reverse causation?
occurs when the relationship between two variables is incorrectly interpreted as one variable causing the other, when in fact the causal relationship is the opposite.
Define p-value
represents the probability of obtaining results as extreme or more extreme than the observed results. A lower p-value indicates that there is stronger evidence against the null hypothesis, and therefore, the results are considered statistically significant. Typically, a p-value of 0.05 or less is used as a threshold for statistical significance. A t value of zero suggests no difference thus accepting null hypothesis.
What is the independent sample t test?
a statistical test used to compare the means of two independent groups to determine if there is a significant difference between them. It is commonly used when the data from two groups are unrelated or independent of each other, such as comparing the test scores of students from two different schools.
What is a type 1 error?
The rejection of the null hypothesis when it is in fact true, If we decide that we are going to reject our null hypothesis when we find a p-value of less than 0.05, there is a 5% chance that we will reject the null hypothesis when it is in fact true
What is a type 2 error?
The failure to reject the null hypothesis when it is in fact false.
What are Parametric statistical tests?
hypothesis tests that make certain assumptions about the distribution of the data being analyzed. These assumptions need to be met in order for the results of the parametric tests to be valid and reliable.
What are the common assumptions of parametric tests?
Normality: data follows a normal distribution. This means that the data is symmetrical and bell-shaped, with the mean, median, and mode being equal.
Independence: data are independent of each other. In other words, the values of one observation should not be influenced by the values of another observation.
Homogeneity of variances (homoscedasticity): data are equal across groups or conditions being compared.
Linearity: relationship between the independent and dependent variables is linear.
Interval or ratio scale: require the measurement scale of the data to be interval or ratio..
What Is Homogeneity of variance?
If the variance is assumed to be “homogenous” in a statistical test, we assume that the variance in each sample in the test is the same. If this assumption is violated, we have to use a different test which makes fewer assumptions.
what are features of a good hypothesis?
clearly, simply stated
precise/specific
plausible
able to produce testable predictions
what are the 2 types of categorical data
nominal and ordinal
what are the 2 types of quantitive data
discrete and continuous
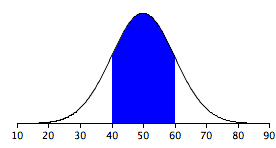
What does the blue area represent?
data points within on standard deviation from the mean, 68.25% in normal distributions
What is the % of data points within one standard deviation of the mean in normal distributions?
68.25%
what does the sum of squares represent?
quantifies the magnitude of the total variability in a data set but ignores the direction of variability
(x1 - x)2
what does the calculated value for variance represent?
average size of the squared deviates in a sample
(x1 - x)2 divided by n-1
how do you calculate standard error of the mean?
standard deviation divided by the square root of number of samples
what is the standard error of the mean (SEM)?
a measure of confidence we have in our sample mean as an estimate of the real population
What type of data are parametric statistics used to analyse?
normal continuous data
What type of data are non-parametric statistics used to analyse?
non-normal data e.g skewed
what are 2 common distributions for discrete data?
Poisson and binomial
what does an experiment involve?
making a prediction, manipulating the variable of interest and observing the effects on other variables.
what is measurement precision?
where unbiased measurement errors make data un precise e.g rounded to nearest measure (not human bias)
what is measurement accuracy?
accurate when free from bias that occurs from systematic (human) errors in measurements
what are confounding variables?
a variable that influences your results in a way that may be confused with the variable you are really interested in
e.g order effects
what 4 key things must a study achieve?
must discriminate between null and alternative hypothesis, must aim for generality, must be biologically realistic, and repeatable.
what is a ceiling effect?
when a considerable percentage of participants score the best or maximum possible score, the measurements then lose their value.
what is a floor effect?
when a considerable percentage of participants score the worst or minimum avaliable score, the measurements then lose their value.
when the null hypothesis states x1 is not bigger than x2, a positive t value is….
non consistant with H0, large value shows significant positive differance - x1 is bigger than x2
when the null hypothesis states x1 is not bigger than x2, a negative t value is….
consistant with H0, smaller/negative value shows negative differance, x1 is smaller or same value as x2
what is a type 1 error?
rejection of null hypothesis when it is in fact true, says results are significant when they are not
when does a type 1 error mainly occur?
when p<0.10 because probability level is too lenient, 10% due to chance
when does a type 2 error mainly occur?
when p<0.01 because probability level is too stringent, 1% due to chance
what is a type 2 error?
the failure to reject the null hypothesis when it is actually false, says results are not significant when they actually are
What are the 3 main assumptions of parametric t-test?
observations are independant
homogenity of variance
data come from continous and normal populations
explain the assumption of t-test that observations are independant
e.g sperm samples taken from different mice, however problem may arise from poor sampling methods, can be fixed using psuedoreplicaiton
what is a problem of using independent measures?
problem may arise from poor sampling methods, fixed using psuedoreplication - paired experimental designs
what is psuedoreplication?
use of non-independant data points as if they were actually independant
what is repeated measures?
an experimental design where the same participants take part in each condition of the experiment
what is a paired design?
an experimental design where pairs of participants are matched in terms of key variables, such as age and IQ. one from each pair tested in one condition each
explain what is meant by the assumption in t-test homogenity of variance?
we assume different samples have identicle variance
how do you tes for ‘normal’ data?
using shaprio-wilk (S-W) test
what are the 2 options for if data isn’t normal in t-test?
option1: transformation of data
option 2: use non-parametric statistics that dont assume normal distribution e.g two sample wilcoxan test
what is transformation of data?
making data normally distributed e.g by square rooting each data point
what are the different methods of transforming data?
log(x+1), log(x), square root of x, arcsin square root of x, cube root of x
what is the paired t test?
used for analysing 2 samples of data where data is in pairs, such as same person measured under different treatments, same person measured before and after treatment, or matched individuals in different treatment groups based on gender age etc
what are types of paired data?
same person measured under different treatments, same person measured before and after treatment, or matched individuals in different treatment groups based on gender age etc
what is the independent two sample t-test?
used to compare the mean of 2 independent groups (unrelated groups)
what is levene’s test?
test for homogenity of variance - the null hypothesis is that the variance of samples is the same, a significant p value (<1%) indicates you should reject null hypothesis - samples have different varaince
what tests for homogenity of variance?
levene’s test
what tests for ‘normality’?
shapiro-wilk test
what is the shapiro-wilk test?
tests for normality, H0 is that the data in a sample are normally distributed, a significant p-value (<1%) indicates you should reject null hypothesis -data is not normally distributed
what is the H0 in shapiro-wilk test?
the data in a sample are normally distributed
what is the H0 in levene’s test?
the variance of samples is the same
what is the two-sample wilcoxan test?
also known as mann-whitney U test
non-parametric equivelant of independant samples t-test, examines differance between 2 samples of ranked data, significant p-value (<1%) indicates you canr eject H0 that the 2 samples came from a single population with a single mean rank
What is the H0 of two sample wilcoxan test?
the 2 samples came from a single population with a single mean rank
what is the welch two-sample t-test?
slightly adjusted version of independent samples t-test, used if variance of samples are significantly different as long as data is still normal, tweaks the degrees of freedom.
what is the paired samples wilcoxan test?
a non-parametric equivalent of t-test, similar to wilcoxan but does not assume samples are independent, assumes they are paired.
when do we use paired-samples wilcoxan test?
non parametric data
paired samples
when do we use welch two-sample t-test?
when variance of samples are significantly different
data is normal
independent measures
when do we use two-samples wilcoxan test?
non-parametric
independent samples
ranked data
what are the two tests for correlations?
pearsons correlation coefficient (r), parametric
spearmans rank correlation coefficinet (p or rho), non-parametric
what is pearsons correlation coefficient?
a parametric test for correlation
what is spearmans rank correlation coefficient?
a non-parametric test for correlation
what do we use to test for casual relationships?
regressions analysis
what do we use to test for correlations?
correlation analysis