Stats 101 EXAM 1 review
1/193
There's no tags or description
Looks like no tags are added yet.
Name | Mastery | Learn | Test | Matching | Spaced | Call with Kai |
|---|
No analytics yet
Send a link to your students to track their progress
194 Terms
Experimental Study
Research internationally applies one treatment to subjects and then measures a response variable to determine how the treatment affects the response. The purpose is to study whether the treatment causes a change in the response.
Observation Study
observes individuals and measures variables of interest but does not intervene to influence the response. The purpose is to describe some group or situation
not possible to establish cause and effect
What type of study is this?
“Research survey 1,000 adults to record their current exercise habits and blood pressure levels at one point in time
Observation
What type of study is this?
“Scientists randomly assign patients to receive either a new drug or a placebo and track their recovery over 6 months
Experimental
What is a Census?
A special survey that attempts to collect data from every single member of the population.
What the pros and cons of the census?
More accurate since it covers everyone, but takes more time and money.
What is sampling?
The process of selecting a subset of individuals, items. or observation from a larger population to estimate characteristics of the whole population
Convenience Sampling
A bad sampling
A type of sampling where a selection of whichever individuals are easiest to reach rather than at random
What type of sampling is this?
Surveying people in a shopping mall instead of a diverse population.
Convenience Sampling
Voluntary Response Sampling
A bad sampling
Individuals self-select to participate (online polls, call in surveys)
What type of sampling is this?
A Tv show asking viewers to vote on an issue via text messages
Voluntary Response
Simple Random Sample
A good sampling
A sample chosen by a method in which each collection of n population items is equally likely to make up the sample. unbaised
Statified Random Sampling
A good sampling
Where you divide the sample into groups called strata (can be by gender, major, etc) and then take an SRS from each strata
What type is sampling is this
A company wants to survey employee satisfaction across different departments (sales, IT, HR)
We divide employees into strata (sales: 200, It: 150, HR:50) Then randomly selected 20% from each group.
Statified Random Sampling
Cluster Sampling
A good sampling
The population is divided into nonhomogeneous groups called clusters (schools, cities). Entire clusters are randomly selected, and all members within chosen clusters are surveyed.
What type is sampling is this
A researcher wants to study vaccination rates across a country. She randomly selects 5 cities out of 50, and then surveys all residents in those cities.
Cluster Sampling
Systematic Sampling
A sample is drawn by selecting every k-th element from the list (every 10th customer). Requires a random starting point to avoid bias
What type is sampling is this
A factory checks product quality from a production line of 10,000 items. The quality control manager picks a random starting point (item #7), then selects every 100th item until he obtains 50 items and checks for quality
Systemic Sampling
Sampling Variability
Describes how statistics will take different values when you repeat a sample or experiment
Sampling Bias
When a sampling design systematically favors certain individuals over others
How can we reduce bias ?
Using simple random samplings- a sampling where you use a radoms digit table
How can we reduce variability
Using a larger sample
The larger the sample size the ___ the variability
Smaller
Voluntary Response Bias
In particaulr people with strong opinions are more likely to participate
Self-Interest Bias
People who have an interest in the outcome of an experiment have an incentive to use biased methods
Social Acceptability Bias
People are reluctant to admit behavior that may reflect negatively on them
Leading Question Bias
Sometimes questions are worded in a way that suggests a particular response
Non-response Bias
People who refuse to respond to a survey or participate in any study they have been asked.
Sampling Bias
Occurs when some members of the population are more likely to be included in the sample than others.
Sampling Erros
erros caused by the act or process of taking a sample
What are the two types of sampling errros?
Randome and systematic
Random Sampling Error
The deviation (distance) between the statistic and the parameter caused by chance in selecting a random sample
The margin of error in a confidence statement account only for WHICH TYPE of error?
Random Sampling Error
Systematic Sampling Error
Consistent bias in the selection process, leading to under- or overestimating the true population parameter.
caused when the sampling process is biased or flawed in a systematic way
Ways of sampling Systematic Sampling Error
1) unvercoverage
2) poor sampling designs
Undercoverge
Somemembers of the population are inadequately represented in the sample
These is an example of what?
Using a phone directory to sample people (excludes those without a landline)
undercoverge
These is an example of what?
a survey that excludes rural areas when studying national healthcare access.
undercoverge
Poor sampling designs examples
convenience and voluntary response sampling
Nonsampling errors
error not caused by the act of sampling
Sources of nonsampling errors
1) Non-response error
2) response error
3) data entry
4)poorly worded/ misleading questions
5) interviewer bias
What are the two types of non-sampling errors?
Non response and response
Non-response error
Failure to obtain data from an individual selected from a sample.
Most nonresponse occurs when some subjects cannot be contacted or refuse to cooperate
Response Error
Occurs when a subject gives an incorrect response (participant lies about their response)
Way to minimize nonsampling erros
1)Prevention (before data collection)
2)Detection (during and after data collection)
3) Mitigation (after errors occur)
Prevention to minimize nonsampling errors
design a clear survey and instruments
-avoid ambiguous or leading questions
-pilot-test questionnaires to catch errors
train data collection
-ensure interviews, observers, or technicians follow protocols
Detection (during and after data collection) to minimize nonsampling errors
Monitor response rates-high nonresponse? adjust with follow ups or incentives
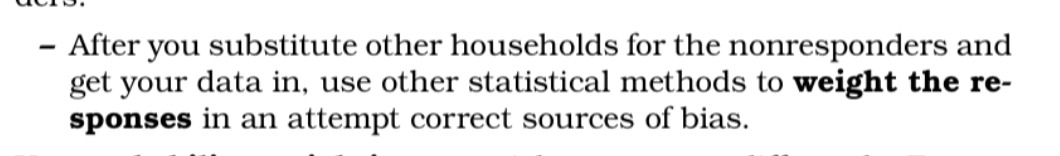
Mititgation(after erros occur) to minimize nonsampling errors
For nonresponse: substitute other households for the nonresponders
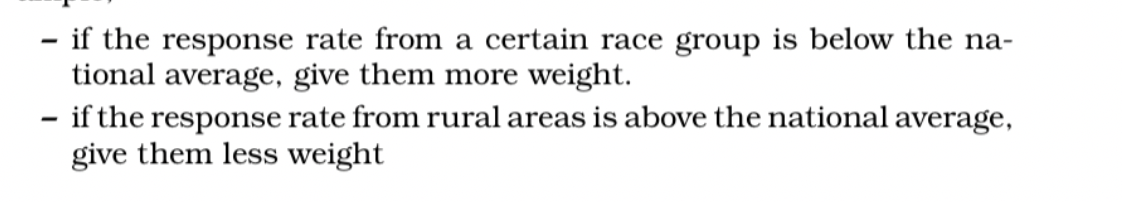
Probability weighting: to weight the response differently
Example for which type of Mitigation
For nonresponse
Example for which type of Mitigation
Probability weighing
What is Margin of Error
a numerical value that quantifies the uncertainty in an estimate
Margin of error formula (MOE)
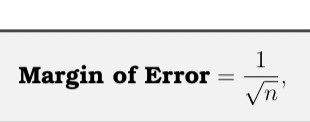
n= sample size
How does the sample size effect Margin of error formula (MOE)
The larger the sample size, the smaller the margin of error.
How does the confidence interval affect Margin of error (MOE)
The higher the confidence level, the wider the margin of error.
Sampling frame
a list or database from which a sample is drawn for a research study or survey.
frame errors
When the sampling frame is not a complete representation of the pop. of interest.
Frame erros can lead
under coverage, over coverage, duplication errors
What is the sampling frame?
If you’re studying university students
university office student enrollment list
Population
Statistical studies consist of all elements (individuals, items, or objects) whose characterstics are being studied
Sample
The part or subset of the population, containing individuals that are actually observed.
A university wants to know the average study time of all 20,000 students. It collects data from 400 students who volunteered.
What is the population, and what is the sample?
sample: 400 students
population: ALL 20,000 students
Parameter
A number that describes the population
Statistics
A number that describes a sample
Sampling distribution of statistic
The distribution of values taken
by the statistic in all possible samples of the same size from the same
population.
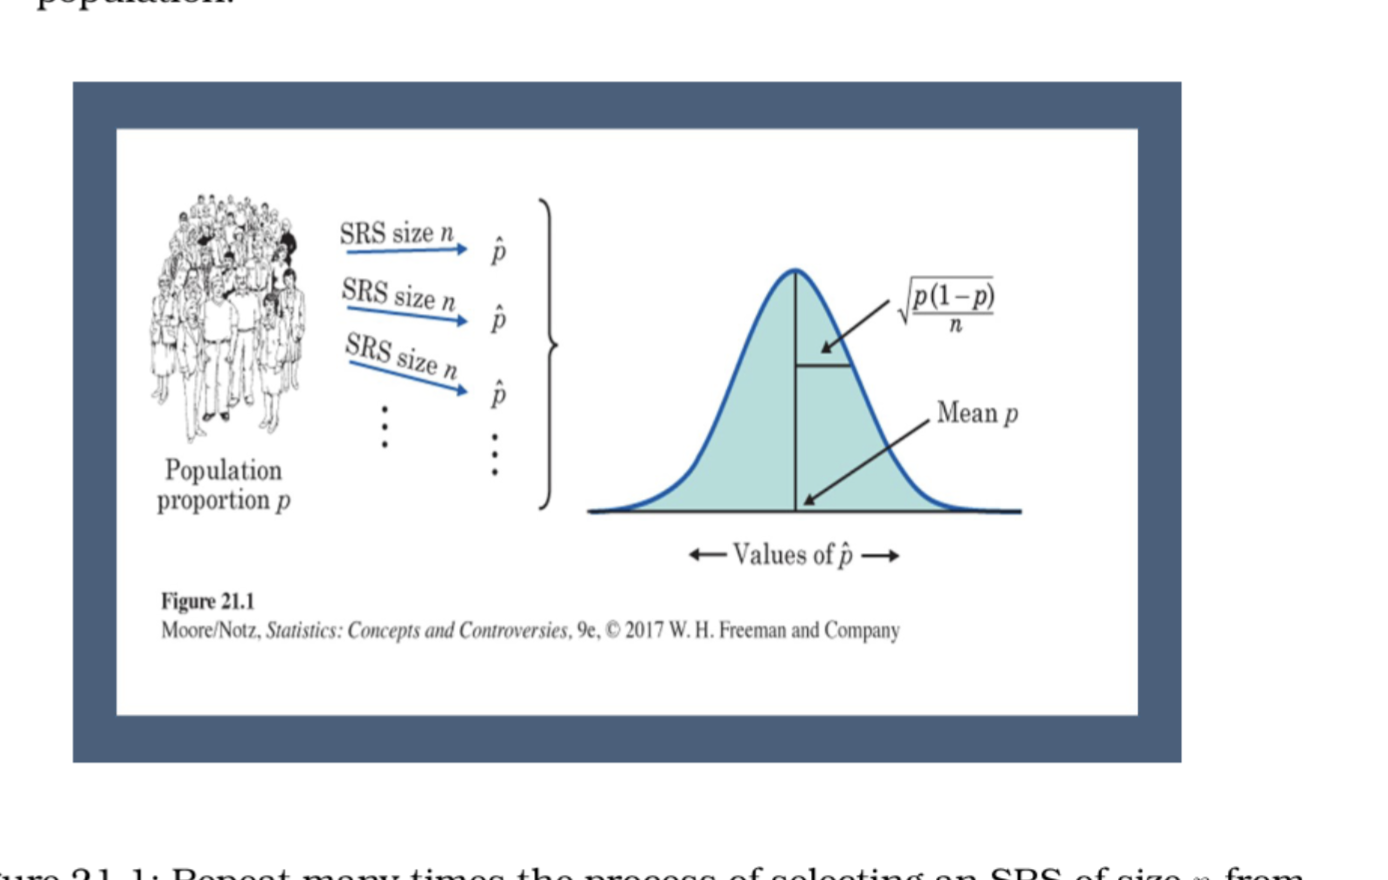
an example of a sampling distribution
What does P stand for?
Population proportion
What does X stand for?
number of successes in the sample
What does n stand for?
sample size
What does
stand for? also known as “P-Hat”
Sample proportion
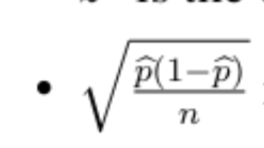
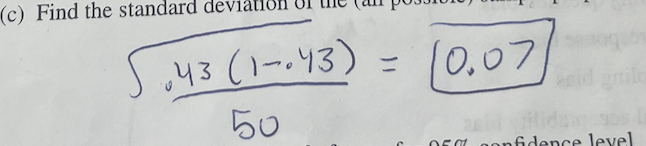
Standard Deviation for the sample proportion equation
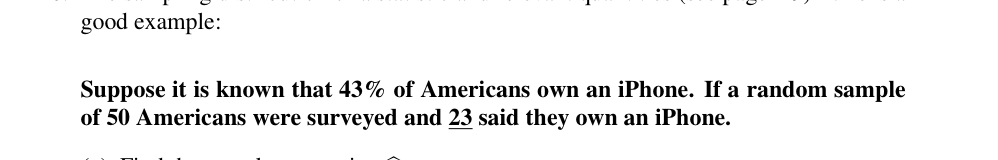
What is the sample proportion (p-hat)
x/n = 23/50 =0.46
Find the mean of the (all possible) sample
p=.43
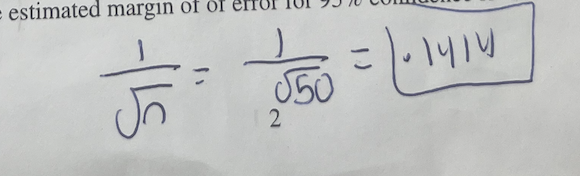
Find the standard deviation of (all possible) sample proportions (p-hat)
Find the estimated margin of error for 95% confidence level
Formula for confidence level
What factors affect the confidence level width
sample size
standard deviation
z score
the chosen confidence level
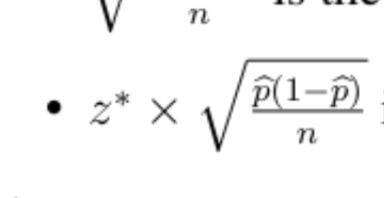
another formula of Margin of error
As the sample size increases, what happens to the confidence interval?
decreases
The larger confidence level,
You have more certainty that the interval contains the true population parameter
larger interval
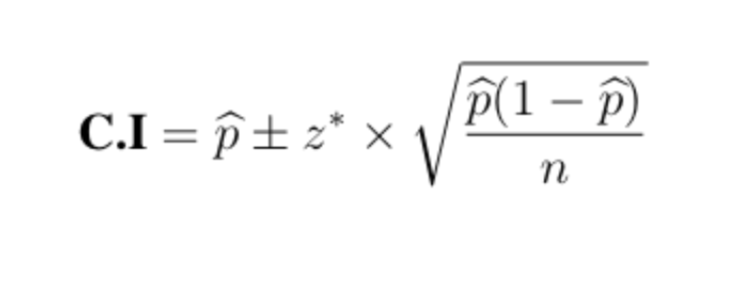
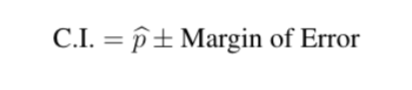
Formual of confidence interval for proportion
Interpretation of confidence interval statement example.
We are 95% confident that the proportion of parents who believe that music education has a positive effect is between
76.18% and 81.82%.
Randomized Comparative Experiments
A study design where subjects (or experimental units) are randomly assigned to different treatment groups to compare their outcomes
Types of Randomized Comparative Experiments
1) Completely randomized
2) Matched pairs
3) Block Design
Completely randomized design
Experimental units are randomly assigned to different treatment groups.
each subject is assigned one of any of the possible groups at random
What is best suited for Completely randomized design
when experimental units are homogeneous ( similar in all respects that might affect the outcome)
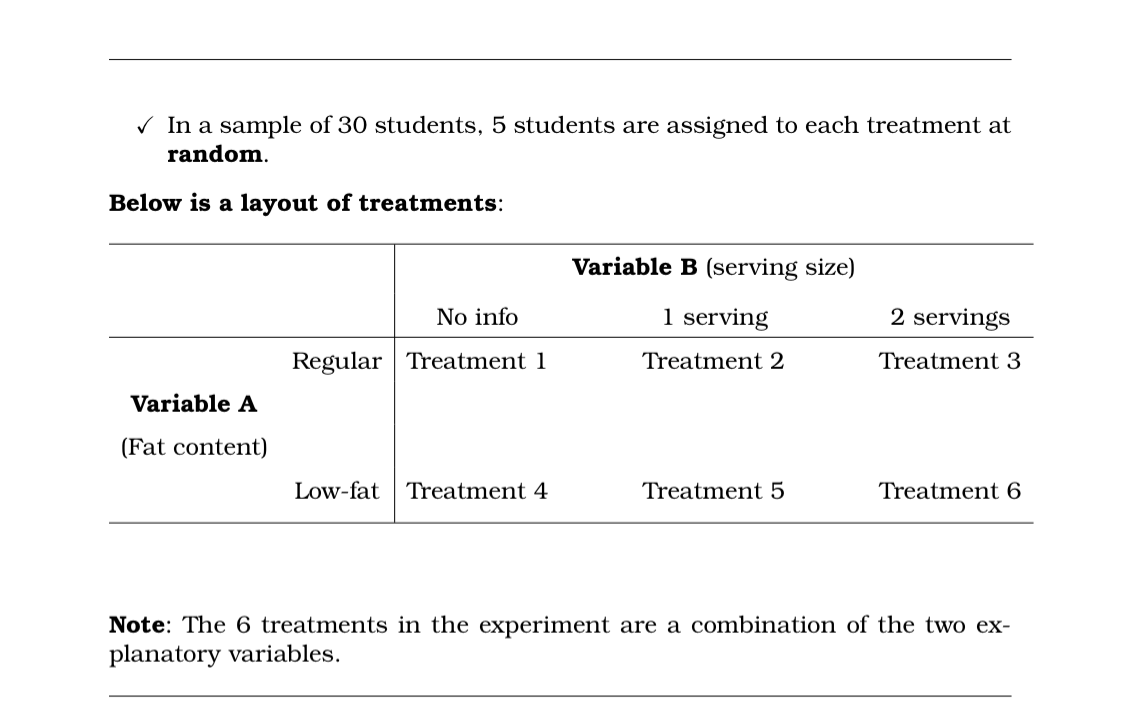
What type of design is this?
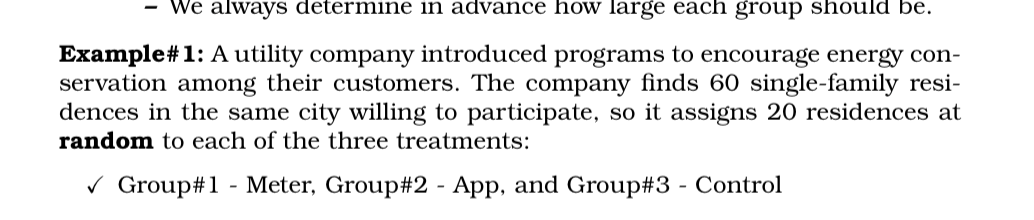
Completely randomized design
What type of design is this?
Completely randomized design
Matched pairs design
A randomized block design where each block contains only two subjects or conditions that are matched closely (either the same person under two treatments or two very similar subjects). The pairs form a block
What does the matched pairs design help control?
confounding variables and increase the precision of the experiment by reducing variability between groups
Matched pairs design are appropriate when?
comparing two treatments
Types of examples of Match Pairs Design
1) Before and after study
2) Twins Study
3) Matched subjects, two treatments
4) Same subject, two treatments
Measuring blood pressure before and after a diet intervention on the same individuals is an example of what type of design?
Match Pairs Design: Before and after study
because each individual’s before measurement is paired with their after measurement, controlling for individuals baseline differences
Comparing the effect of two different diets by assigning one diet to one twin and the other diet to the other. Example of what type of design?
Match Pairs Design; twin studies
Twin share genetics and environment, so pairing controls for these factors
Studying the effect of a new teaching method on student performance. Students are paired based on similar GPA and study habits. One from each pair is randomly assigned to the new method, and the other to the traditional method Example of what type of design?
Match Pairs Design; matched subject, two treatments
because students are matched to control for variability in prior academic ability
Testing two types of headache medicine on the same person. The person takes medicine A on one day and Medicine B on another day, and the headache relief is measured after each Example of what type of design?
Match Pairs Design; same subject, two treatments (repeated measures)
because the same person acts as teir own control, so individual differences are eliminated.
Block Design
Dividing subjects into blocks (groups) based on a variable that could affect the outcome of(like age, gender, etc.) to reduce variability within each block Then, within each block, treatments are randomly assigned
Why do we use block design?
1) Reduce variability from nuisance factors (like time, location, or batch)
2) Increase the precision of treatment comparisons (by controlling for the block-to-block variation, you reduce the “noise” - error or fluctuation- in the data, making it easier to detect real differences between treatments
3) Improve the accuracy of the conclusion (since variation due to blocks is accounted for separately, the analysis focuses more accuratley on the treatment effect)
Testing 3 fertilzer on 30 plants, but some are in sun and some in shade. You group them into sun and shade blocks, then randomly assign rach fetlizer within each block
what type of design is this?
block desgin
What is the best type of design for this ?
if you have an experiment that wants to compare the effecttivenessof three television comericals for the same product will between women and man
block design (explantion on page 46 of notes)
What are the principles in experimental designs
1) Randomization
2) control
3) Replication