08.27.26-09.11.26 content
 Call Kai
 Learn
Learn Practice Test
 Spaced Repetition
 Match
Match Flashcards
 Knowt Play
1/29

There's no tags or description
Looks like no tags are added yet.
Name | Mastery | Learn | Test | Matching | Spaced | Call with Kai | Chat |
|---|
No analytics yet
Send a link to your students to track their progress
30 Terms
Investigative questions
Used to obtain data
make sure to get multiple data values
3 things an investigative question must do
identify the population
state a parameter (population proportion or population mean)
Use comparative words like difference, increase, decrease, more/less than
Population
the collection of all subjects
sample
a small section of the population
census
asks all individuals (think US census) & collects data
Unbiased estimater
refers to a sample as it should be randomized
Parameter
characteristic from a population
Statistic
characteristic from a sample
Observational unit
an individual in the data set - must be specific
Variable
Characteristic that can take on different values from different observations
2 Types of variables
categorical
quantitative
2 types of quantitative variables
discrete
continuous
discrete variables
takes on specific values
measured by counting
usually whole numbers
continuous variables
can take on an infinite number of values in a particular range
found by calculating
Categorical variables
divided data into different groups
usually not numerical
EX: your birthday, although a number, would fall under categorical because can’t do any measurements with the numbers unless its a question like “out of a sample of ___ people, what is the probability that ___ have a birthday in ___?” but even them I’m unsure
frequency table
categories and number of times occuring
relative frequency table
% of the total number of values
Bar graphs
used to display categorical data
the bars do not touch so they can be reordered
x axis = categorical variable
y axis = frequency or relative frequency
scale equally and use proper scale - don’t lie with statistics!
bars must also be equal width
Misleading graphs
do not use pictographs!
watch for bar size
watch for scales
Dot plots
used with discrete data
smaller range data / small variability
small data set in general
Different shapes (distributions & peaks)
Distributions
Symmetric
Skewed left (negatively)
Skewed right (positively)
Uniform
Peaks/Modes
1 = unimodal
2 = bimodal
3+ = multimodal
Graph unusual features
Possible outliers
gaps in the data
clusters in the data
Measuring center: median vs mean
use mean in uniform distribution = average of data
Use median in anything skewed = middle value of data
Spread & variability
Standard Deviation
range = max-min
(Spread & variability) Inter Quartile Range
AKA IQR
Q3-Q1
Stem & leaf plots
displaying more complex numerical data with larger variability / multiple digits
Good for discrete data
Stems can have multiple digits (on the left) (think of them like “bins”)
the leafs are on the right (individual data values)
Ideally, you want 5 stems or split your stems
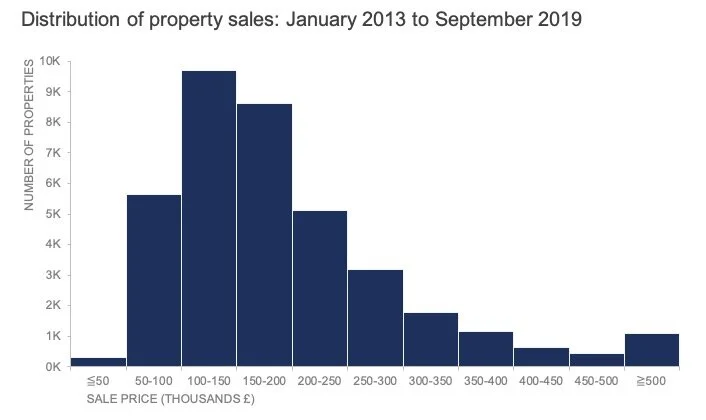
Histograms
measuring both discrete and continuous data
Discrete - bin indication in the middle of bar
Continuous - spaces between bins serve as bars
Mean as a measure of center
μ = population mean (parameter - greek letter “mu”)
x̄ = sample mean (statistic)
x̄ = (Σxi)/n
OR sum of all data values/number of data values
Σ pronounced as sigma
Median as a measure of center
middle value of ordered data
# values + 1 / 2 = observational number of the median
if you get lets say 3.5, then the median is the average between the 3rd and 4th value in the data set
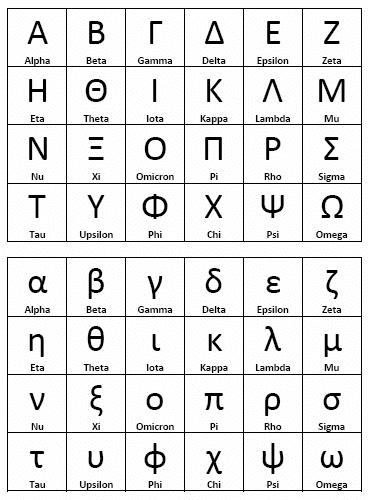
Greek alphabet for funsies