4. Production Costs and Revenue

0.0(0)
Studied by 0 people
call kaiCall Kai
Locked
learnLearn
examPractice Test
spaced repetitionSpaced Repetition
heart puzzleMatch
flashcardsFlashcards
GameKnowt Play
Card Sorting

1/49

flashcard set

Earn XP

Description and Tags

Last updated 8:26 AM on 3/27/24
Name
Mastery
Learn
Test
Matching
Spaced
Call with Kai
Chat

No analytics yet

Send a link to your students to track their progress

50 Terms

1
New cards

Productivity

the output per unit of input employed. A measure of efficienct

2
New cards
A fall in labour productivity leads…
a rise in firms’ cost of production
3
New cards
labour productivity
the output per worker or output per hour worked
4
New cards
Consumer durables
provide a steady flow of utility over their working life
5
New cards
Specialisation
When a product or task is concentrated on
6
New cards
Division of labour
when production is broken down into many separate tasks
7
New cards
Specialisation/division of labour advantages (4)

1. higher labour productivity and business profits
2. creates surplus output that can then be traded internationally
3. lower prices, higher real incomes and GDP growth
8
New cards
Specialisation/division of labour disadvantages (4)

1. unrewarding and repetitive work → lower productivity
2. may create structural unemployment due to little training
3. mass-produced goods lack variety for customers
4. countries can become less self-sufficient
9
New cards
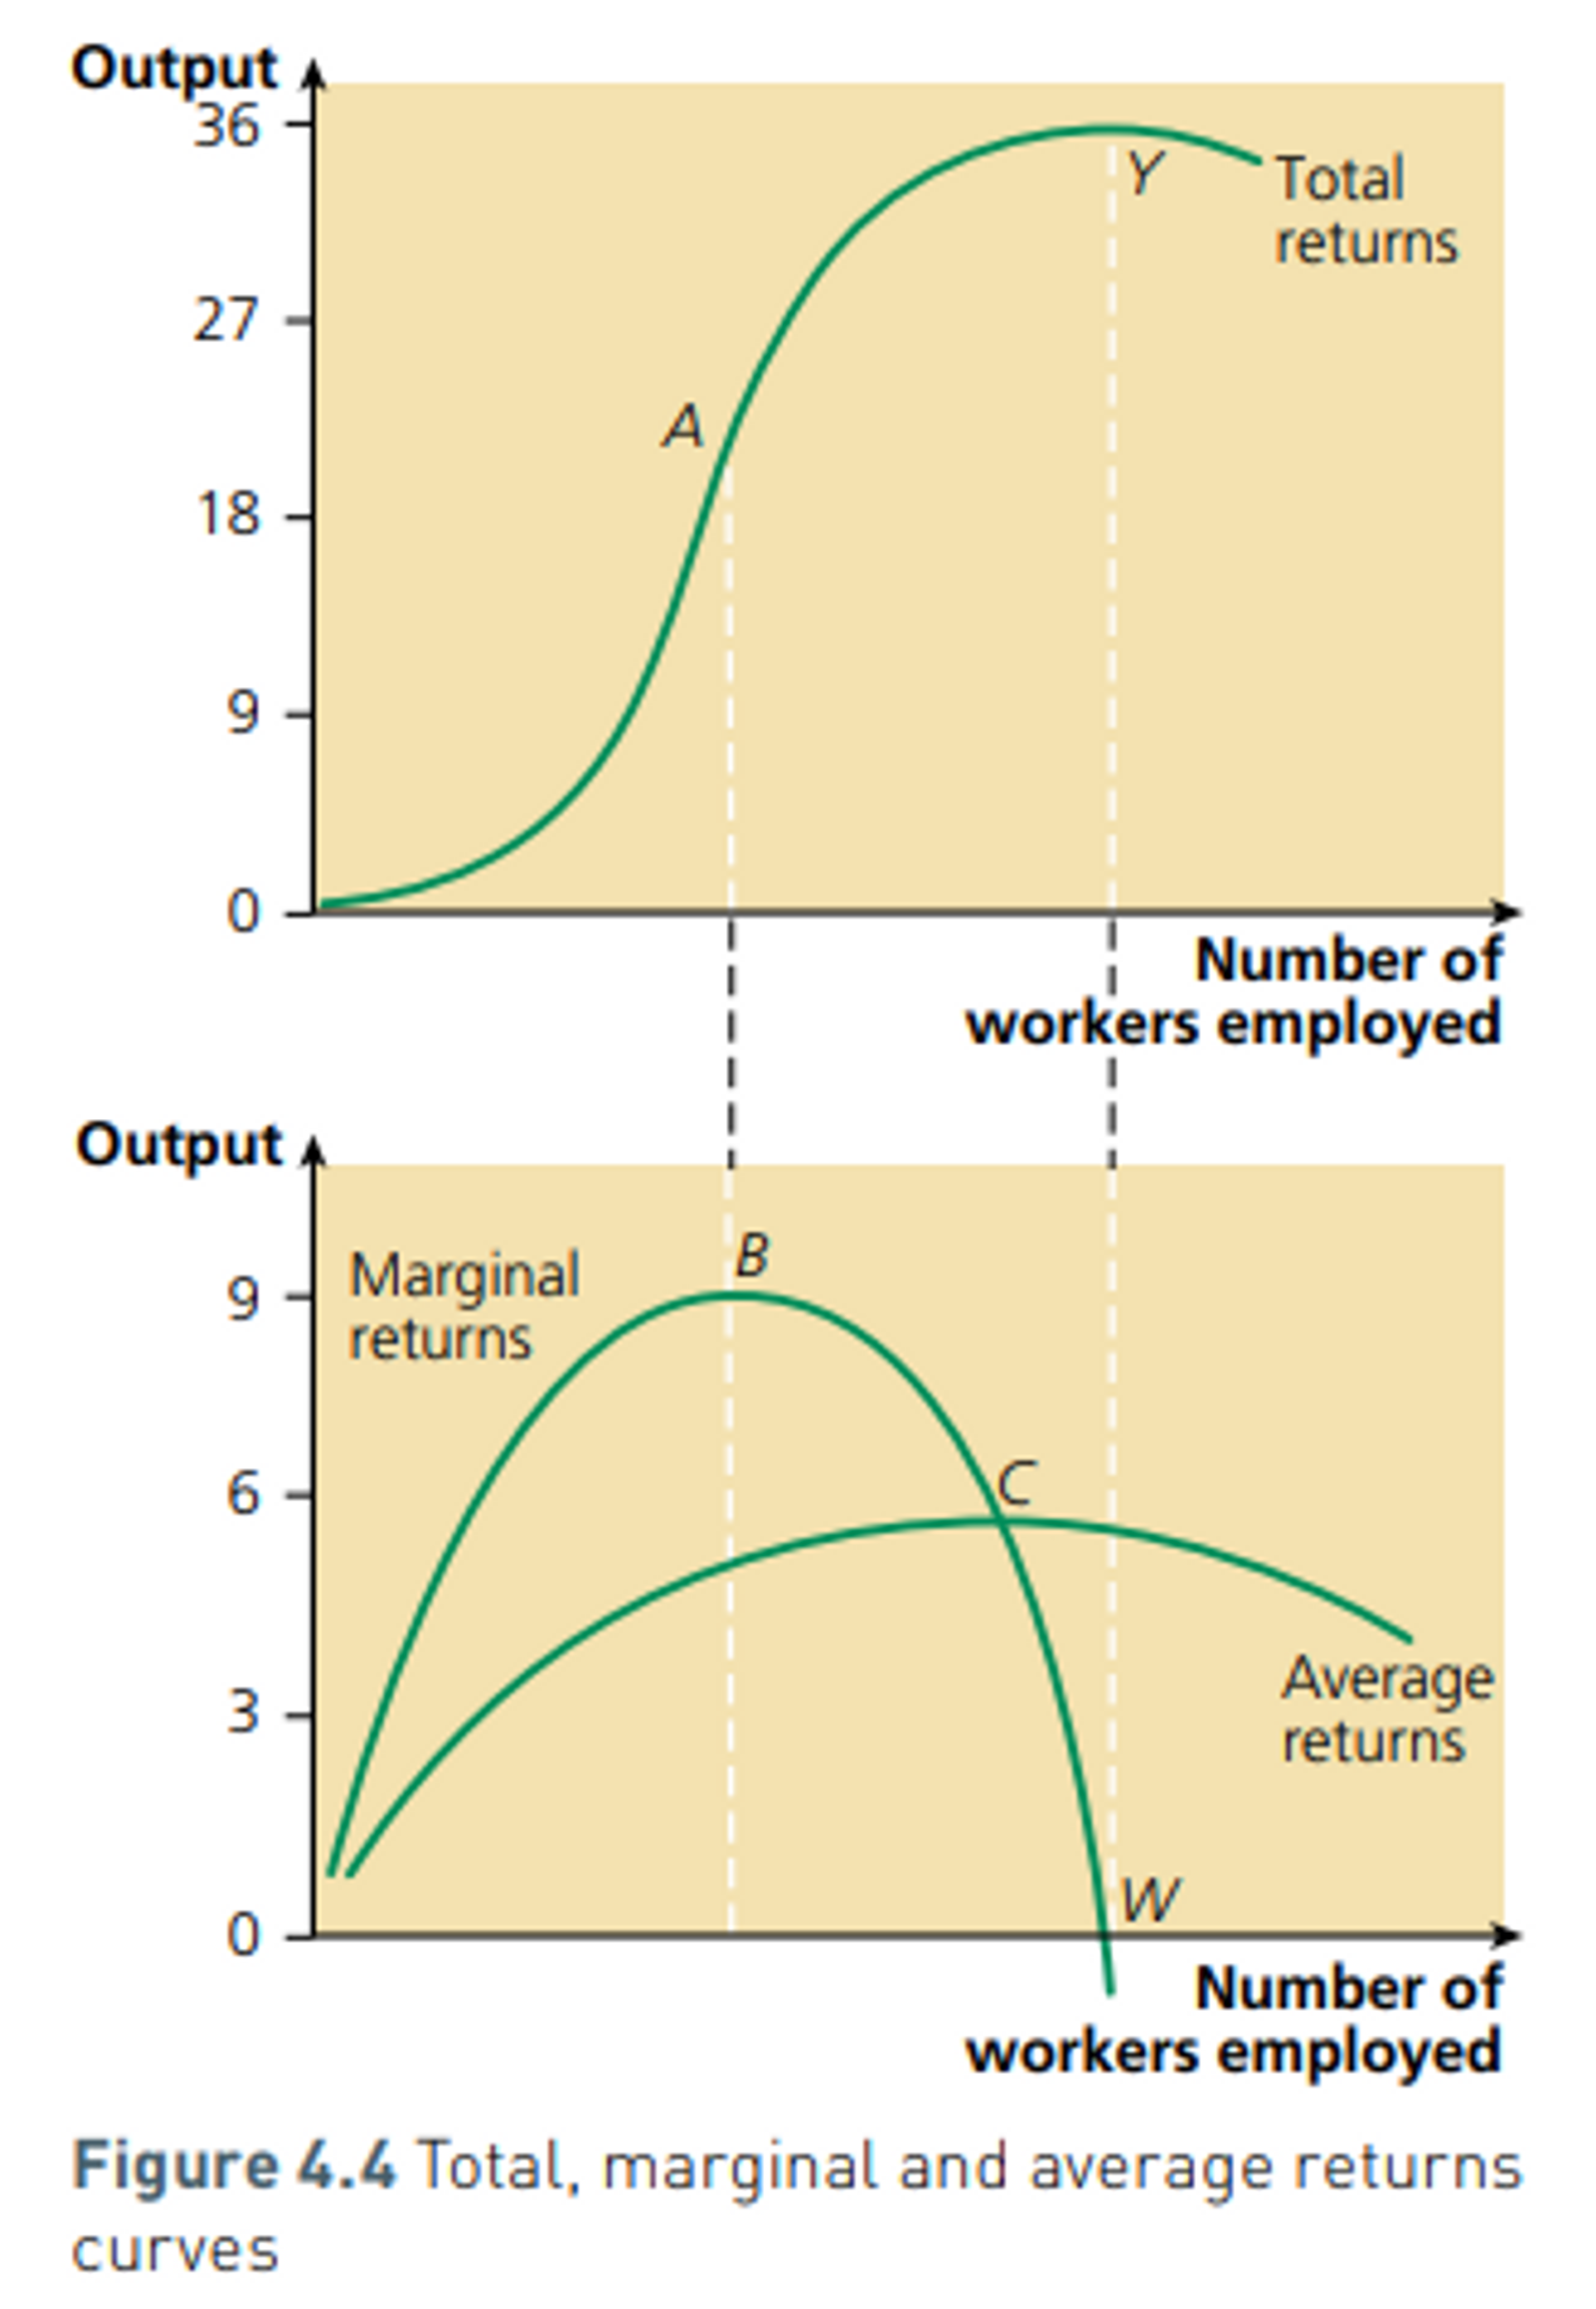
Marginal Returns
the extra output derived per extra unit of labour employed
10
New cards
Average Returns
the output per unit of input
11
New cards
Total Returns
the total output produced by all the factors of production
12
New cards
The law of diminishing marginal returns
if one variable factor of production is increased while other factors stay fixed, eventually, marginal returns from the variable factor will begin to decrease, as well as then average returns
13
New cards
Draw the total, margin and average return curves
14
New cards
Returns to scale
the change in output of a firm after an increase in factor inputs
15
New cards

Fixed costs, example

Costs which do not vary with output, salaries

16
New cards

Marginal cost. What is it affected by?

the cost of producing one extra unity of output
Only affected by variable costs
17
New cards
Average Costs
The cost per unit produced
18
New cards
Total Costs
all costs involved to produce a given level of output
19
New cards
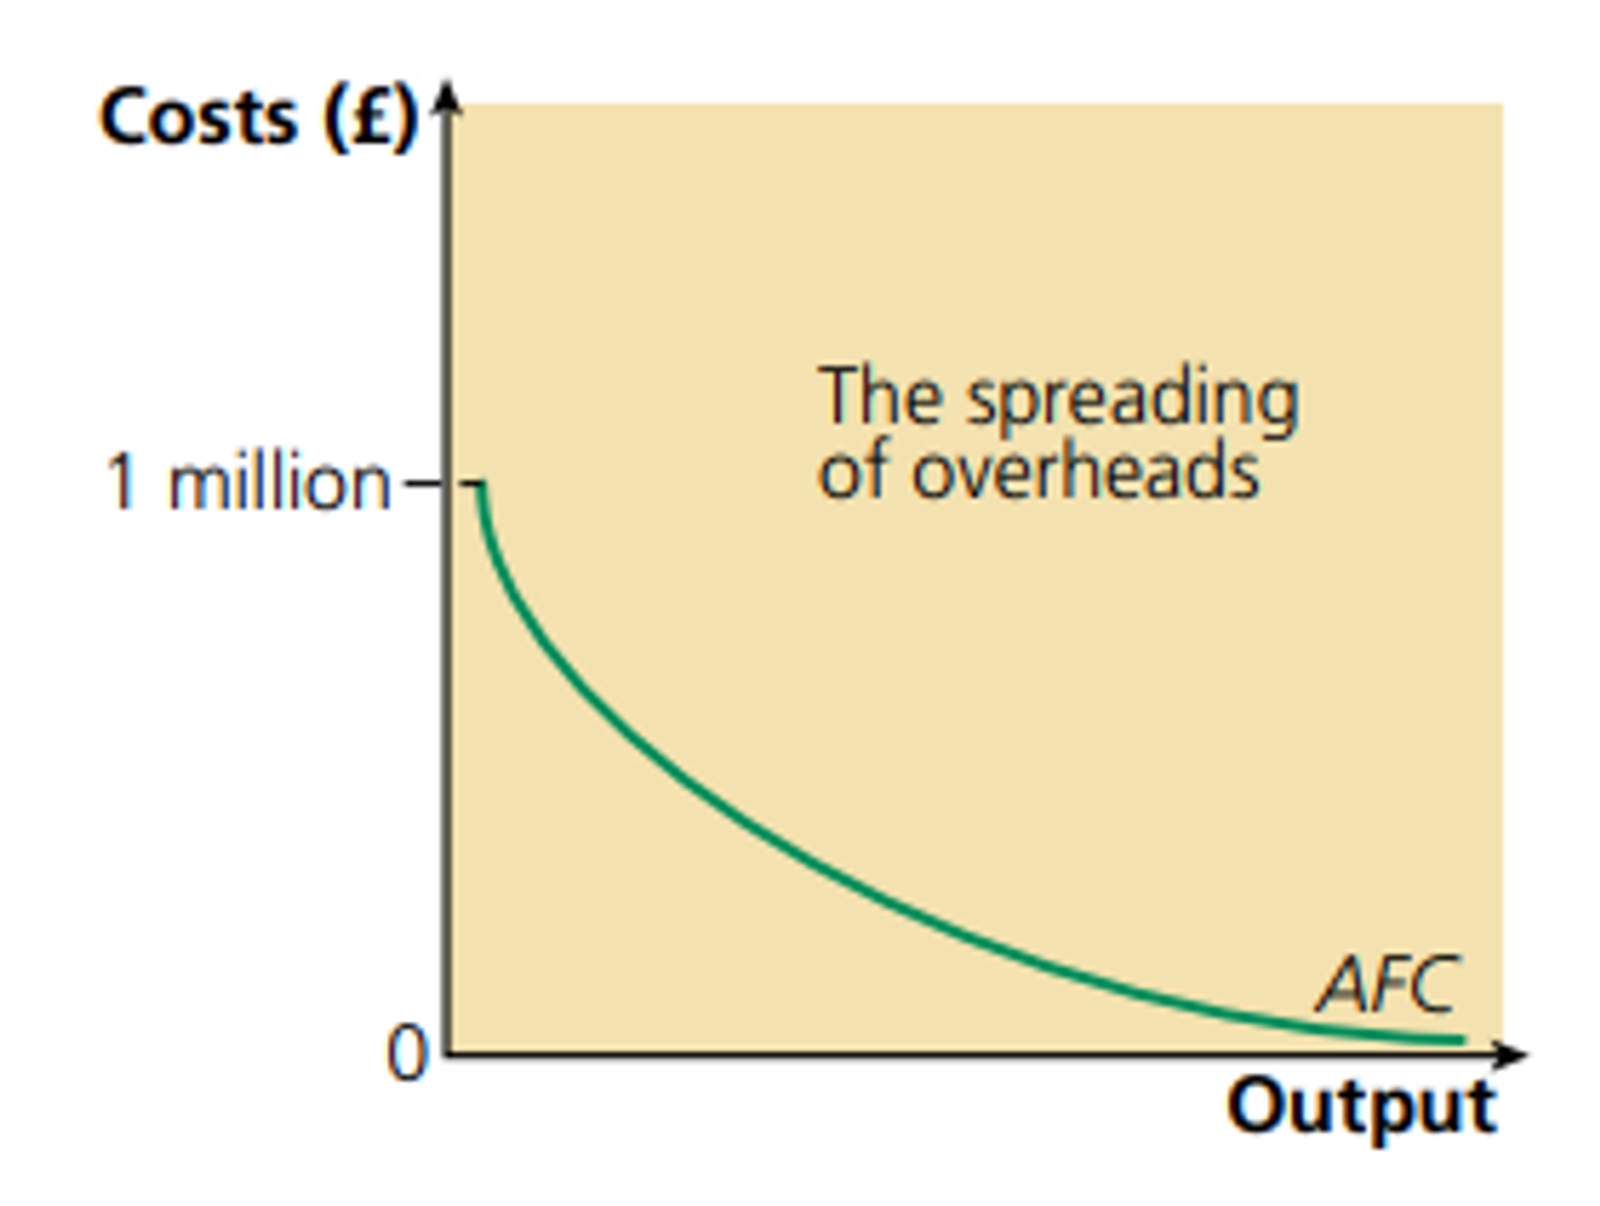
Draw the Average Fixed Cost Curve + why is it like that
because the total fixed costs is spread across a greater output
20
New cards
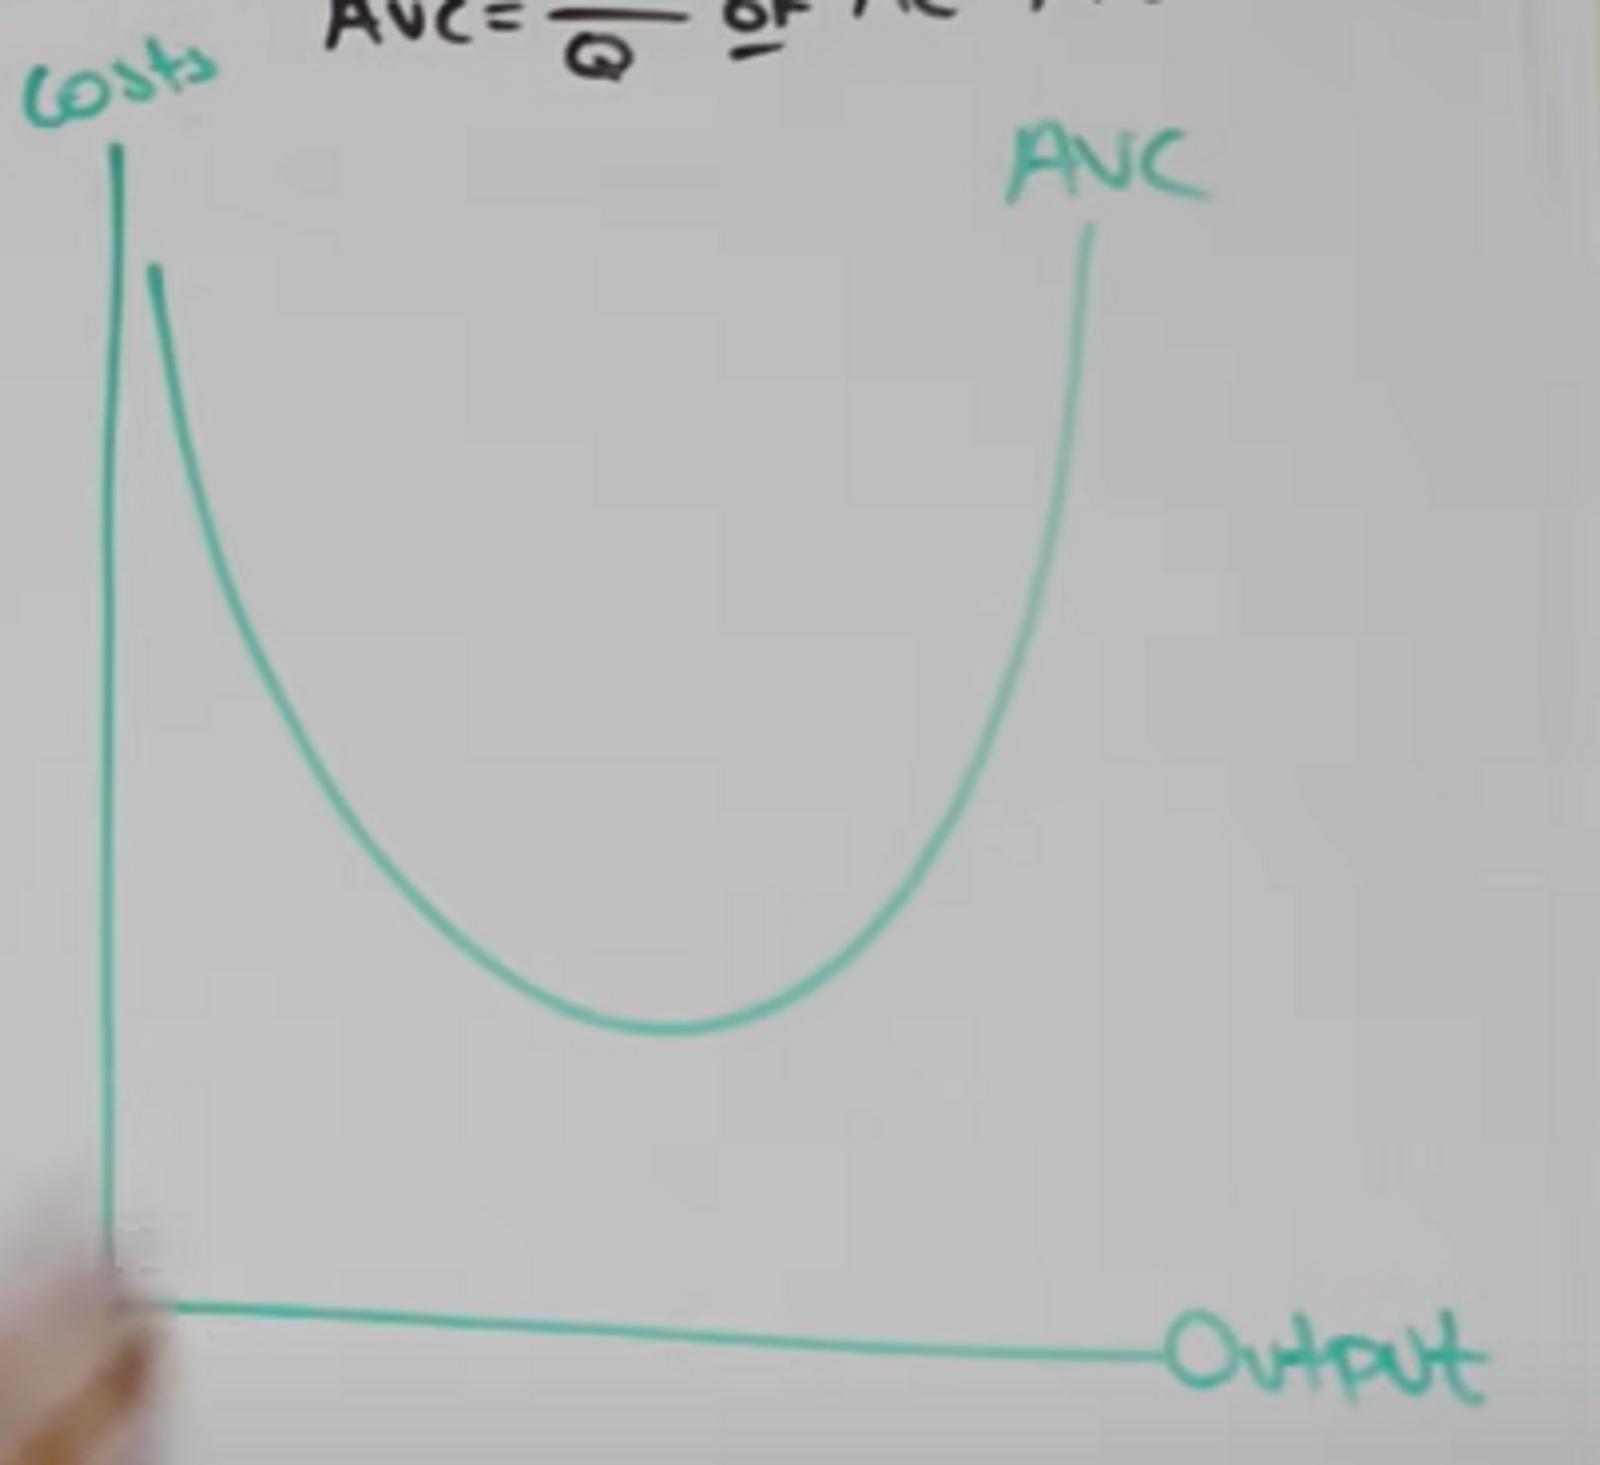
Draw the Average Variable Cost Curve + why is it like that
Due to the law of diminishing marginal returns
21
New cards
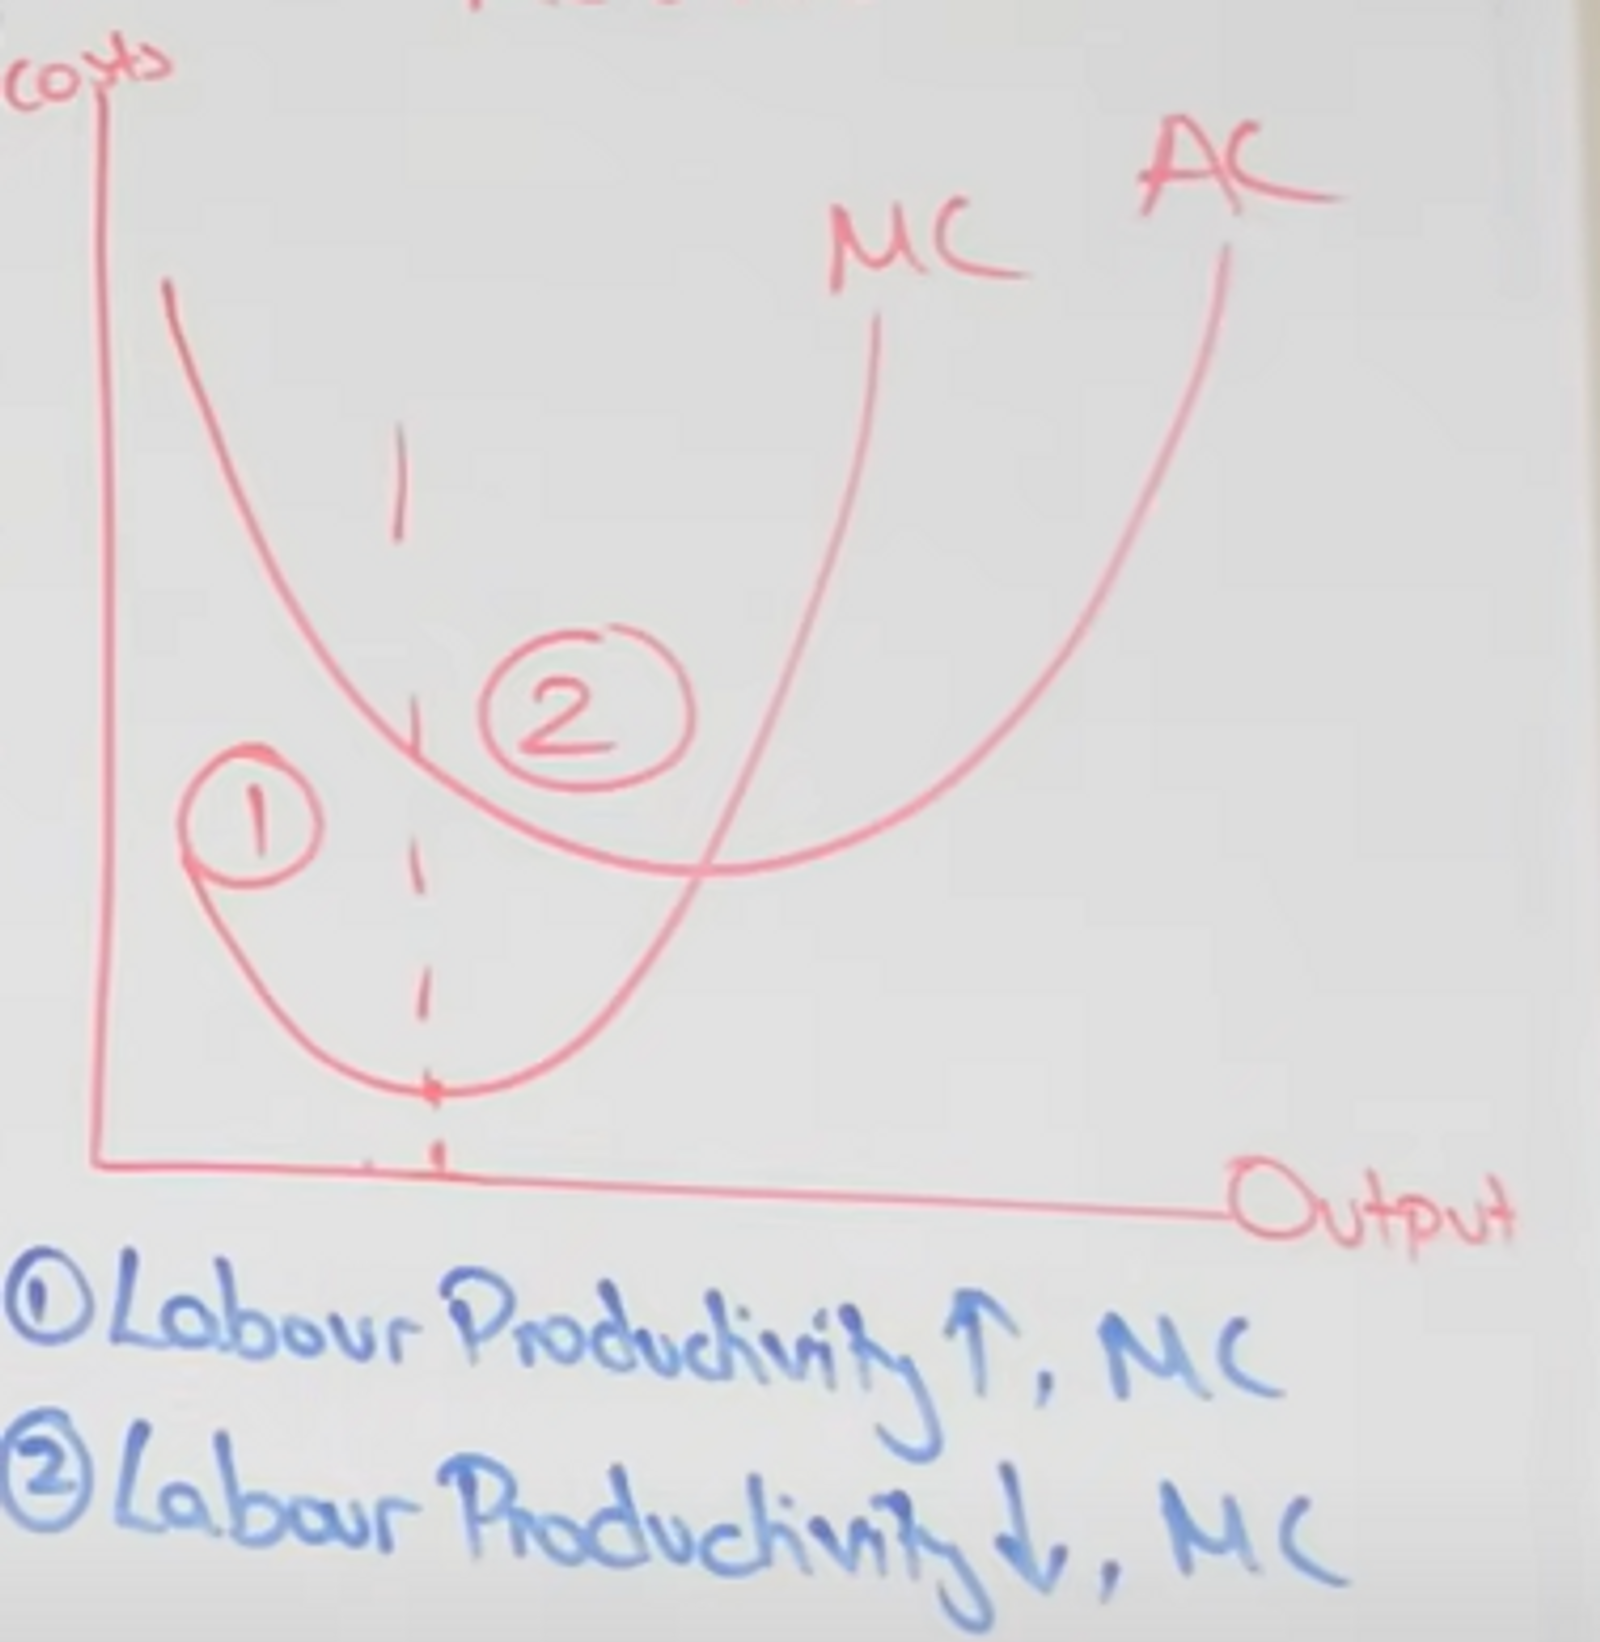
Draw the Marginal Cost and Average Cost Curve
knowt flashcard image
22
New cards
When MC is low than AC, AC…. This is because…
will be falling. each extra unit produced will decrease the average cost
23
New cards
Productive Efficiency
When Average cost is at its lowest, MC=AV
24
New cards
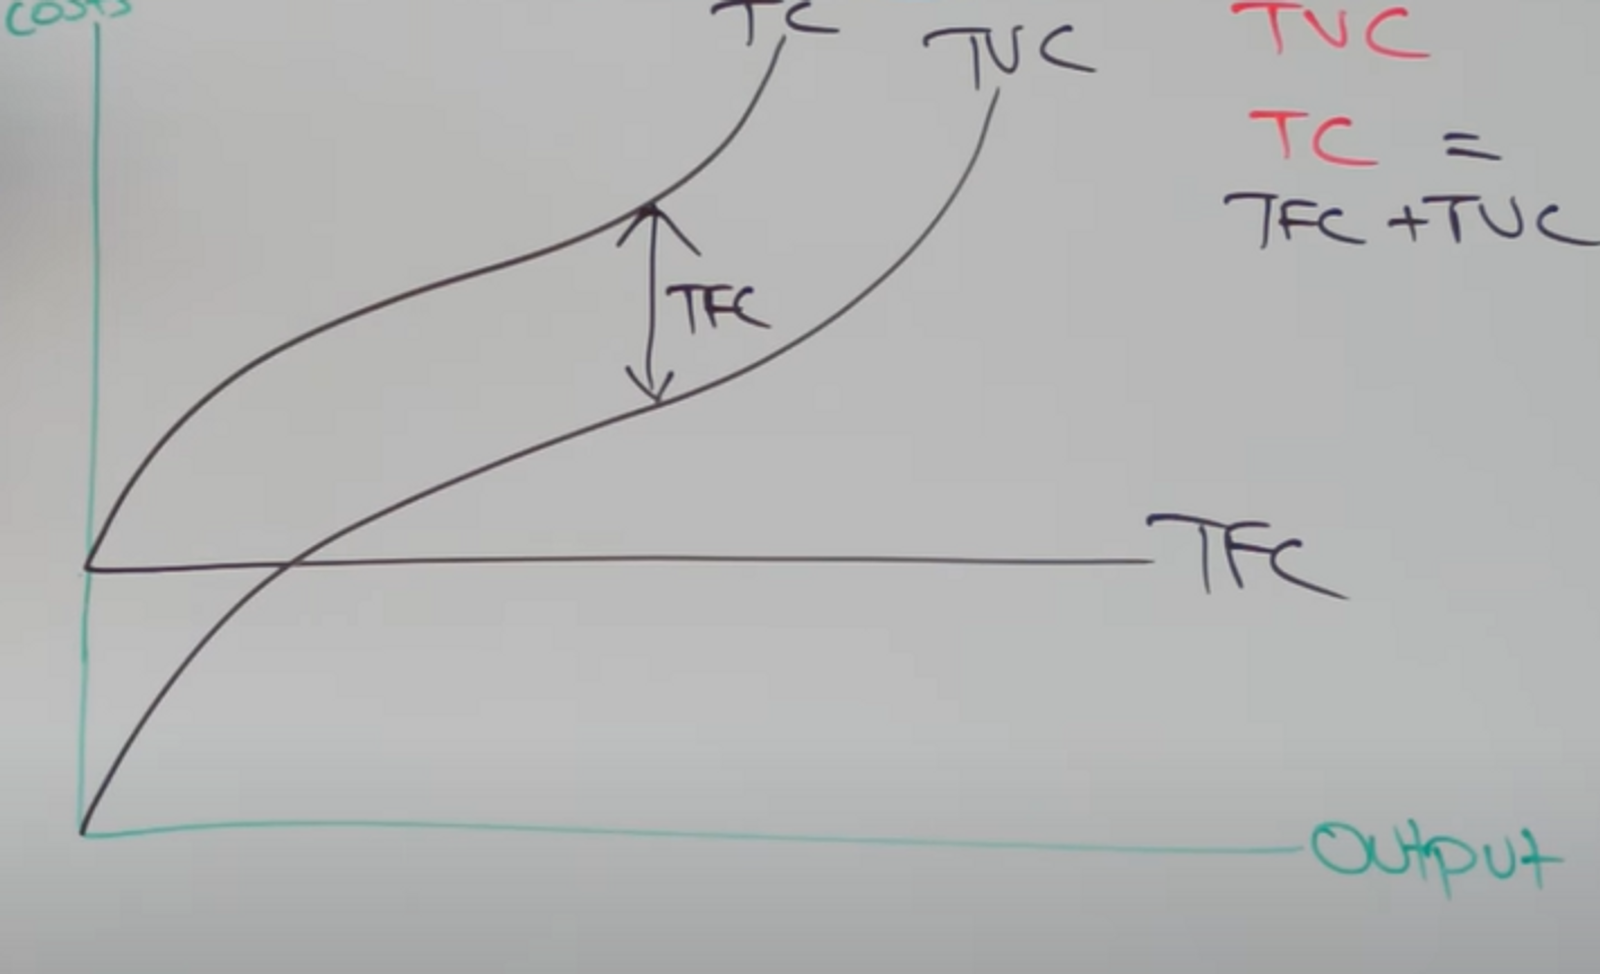
Draw TFC,TC,TVC
knowt flashcard image
25
New cards

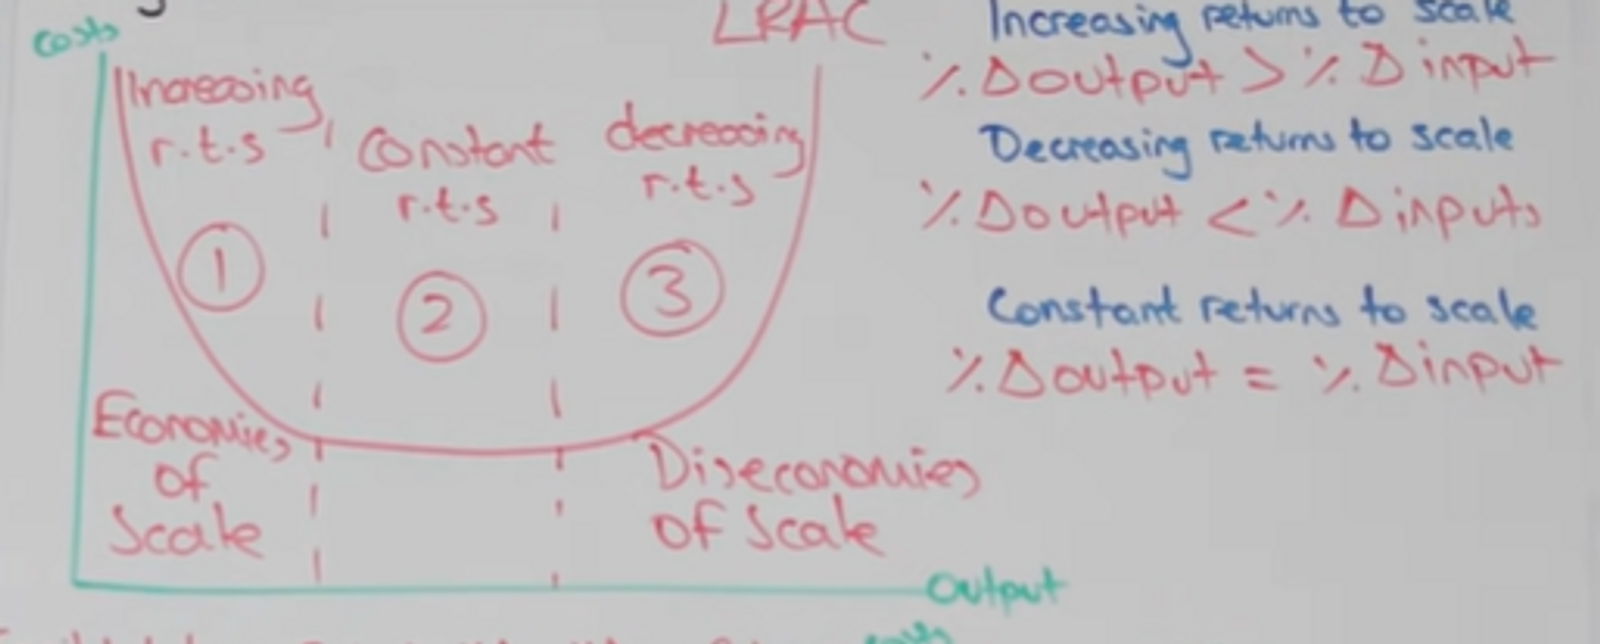
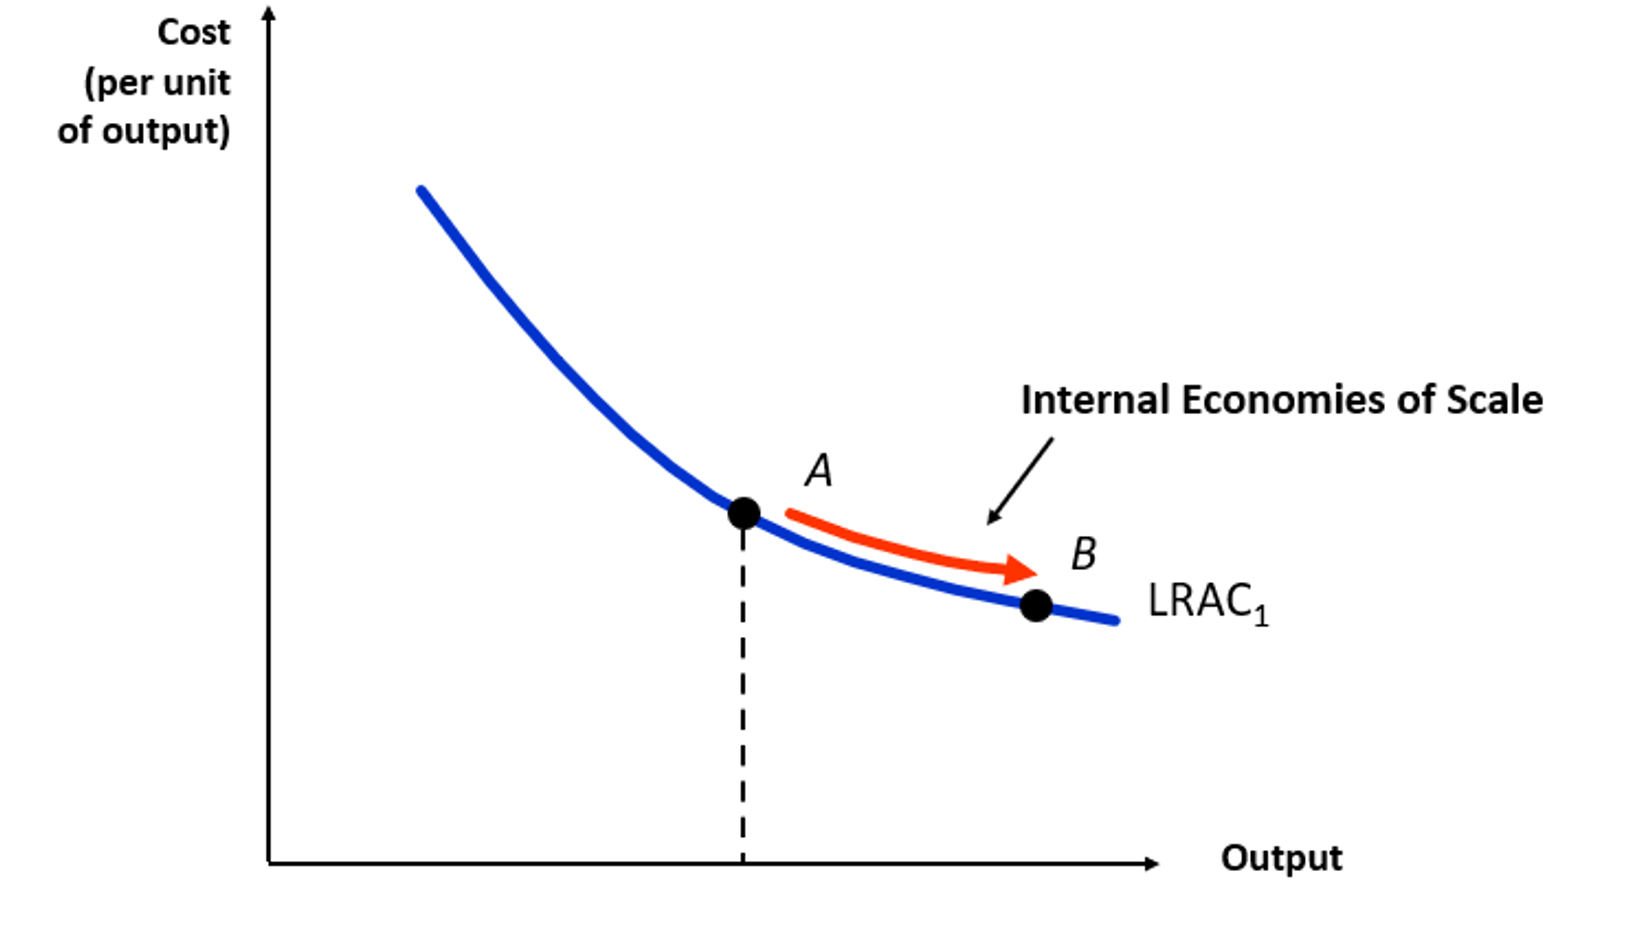
Economies of scale
draw this on a diagram

A reduction in LRAC as output increases
26
New cards
<p>Internal Economies of Scale Anagram<br></p>

Internal Economies of Scale Anagram

Really Fun Mums Try Making Pies
27
New cards
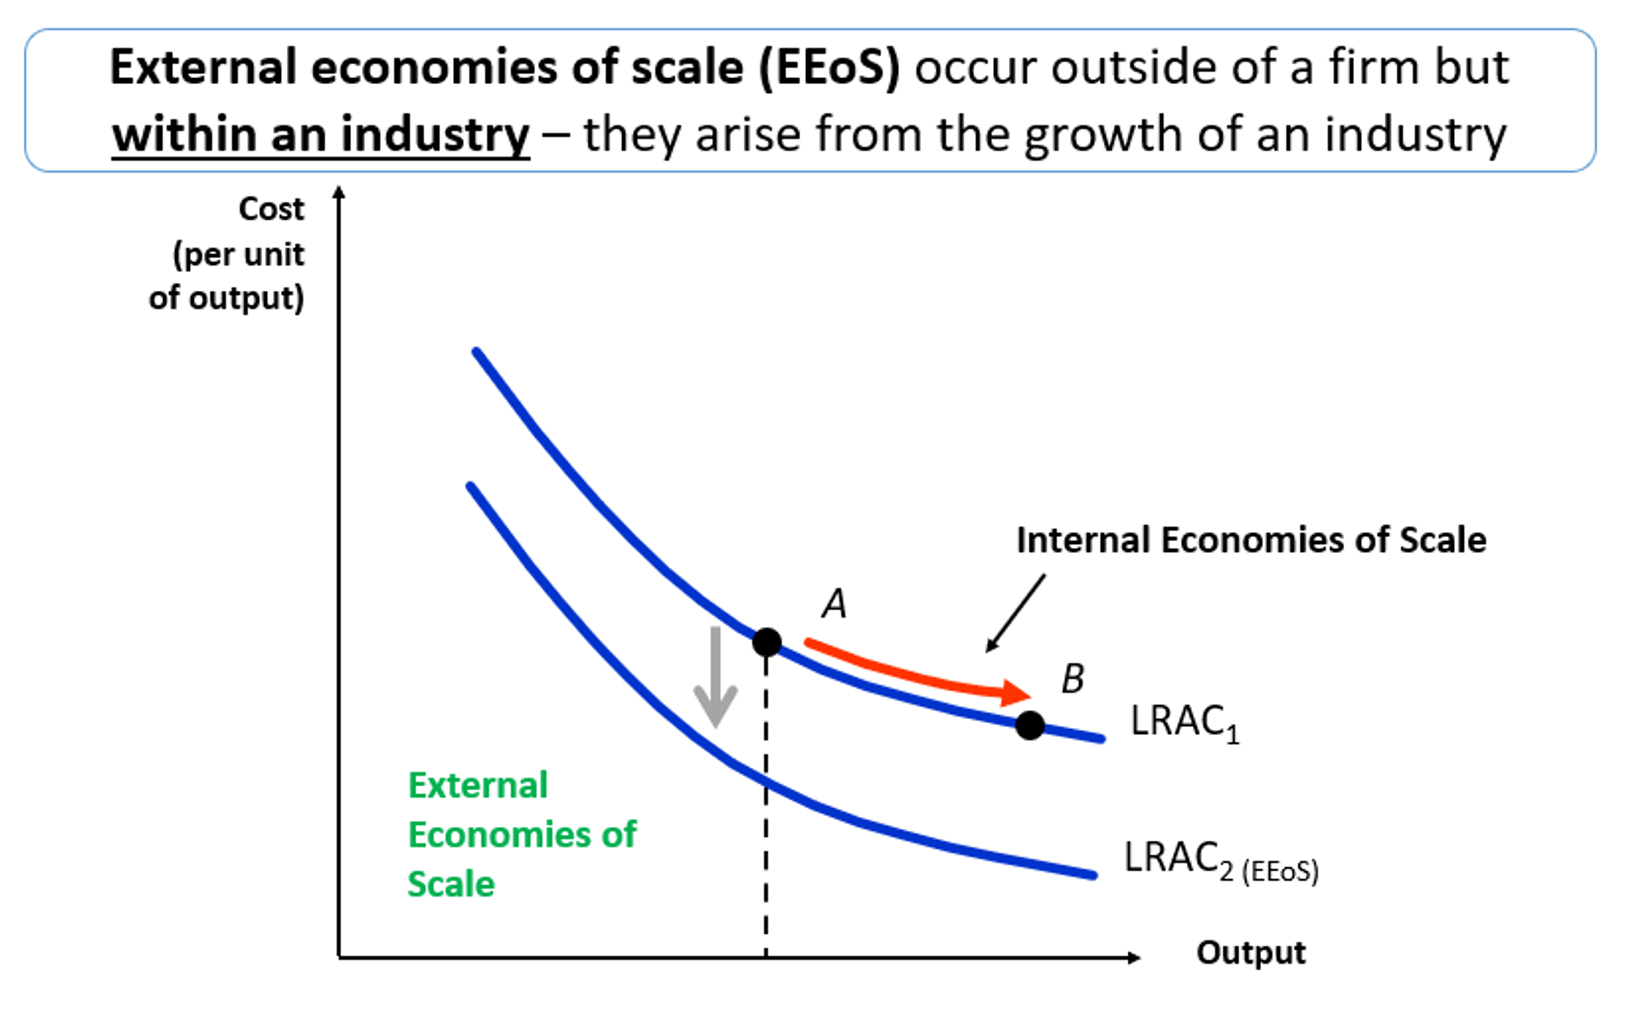
<p>External Economies of Scale 3 reasons&gt;</p><p>Draw this on a diagram </p>

External Economies of Scale 3 reasons>

Draw this on a diagram

  1. better transport infrastructure

  2. Component suppliers move closer

  3. research and development firms move

28
New cards
Reasons for Diseconomies of Scale Anagram
CCCM
29
New cards
Draw the Long Run Average Cost Curve
knowt flashcard image
30
New cards
The minimum efficient scale
the lowest level of output required to exploit full economies of scale
31
New cards
Total Revenue
The total income generated from selling
32
New cards
Average Revenue
The revenue per unit sold
33
New cards
Marginal Revenue
the change in total revenue for every additional unit of output
34
New cards

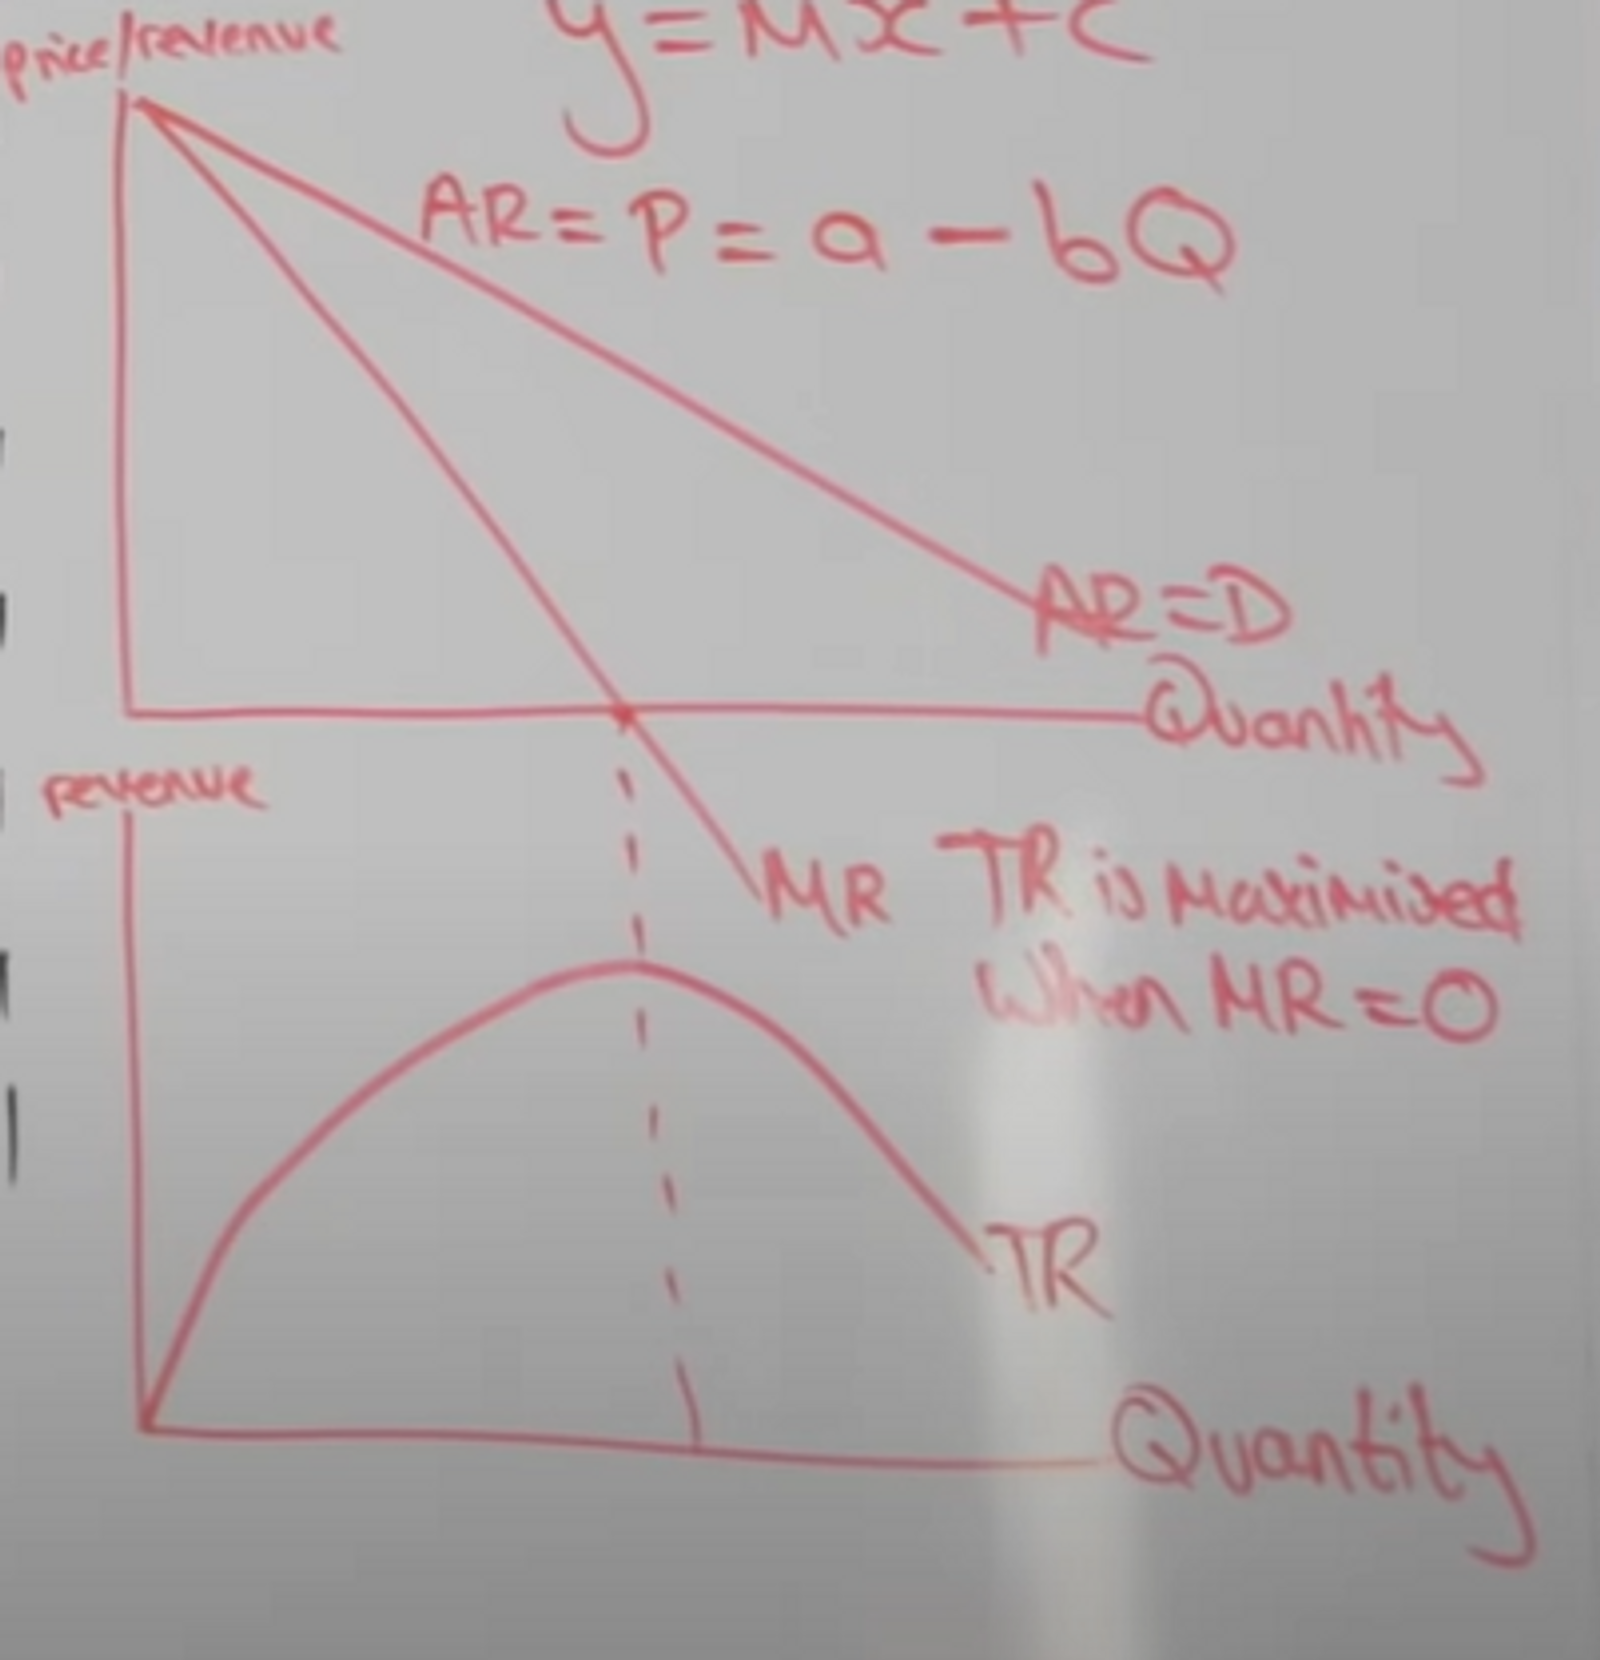
Draw the AR,MR,TR curves for an imperfect market
knowt flashcard image
35
New cards
Draw the AR,MR,TR curves with elasticities and explain

1. When TR is at its maximum ( and MR is 0), demand is unit elastic
2. To the left PED is elastic as decreasing the price will cause a more than proportionate increase in sales and TR will increase
3. To the right, PED is elastic as decrease the price will cause a less than proportionate increase in sales and TR will decrease
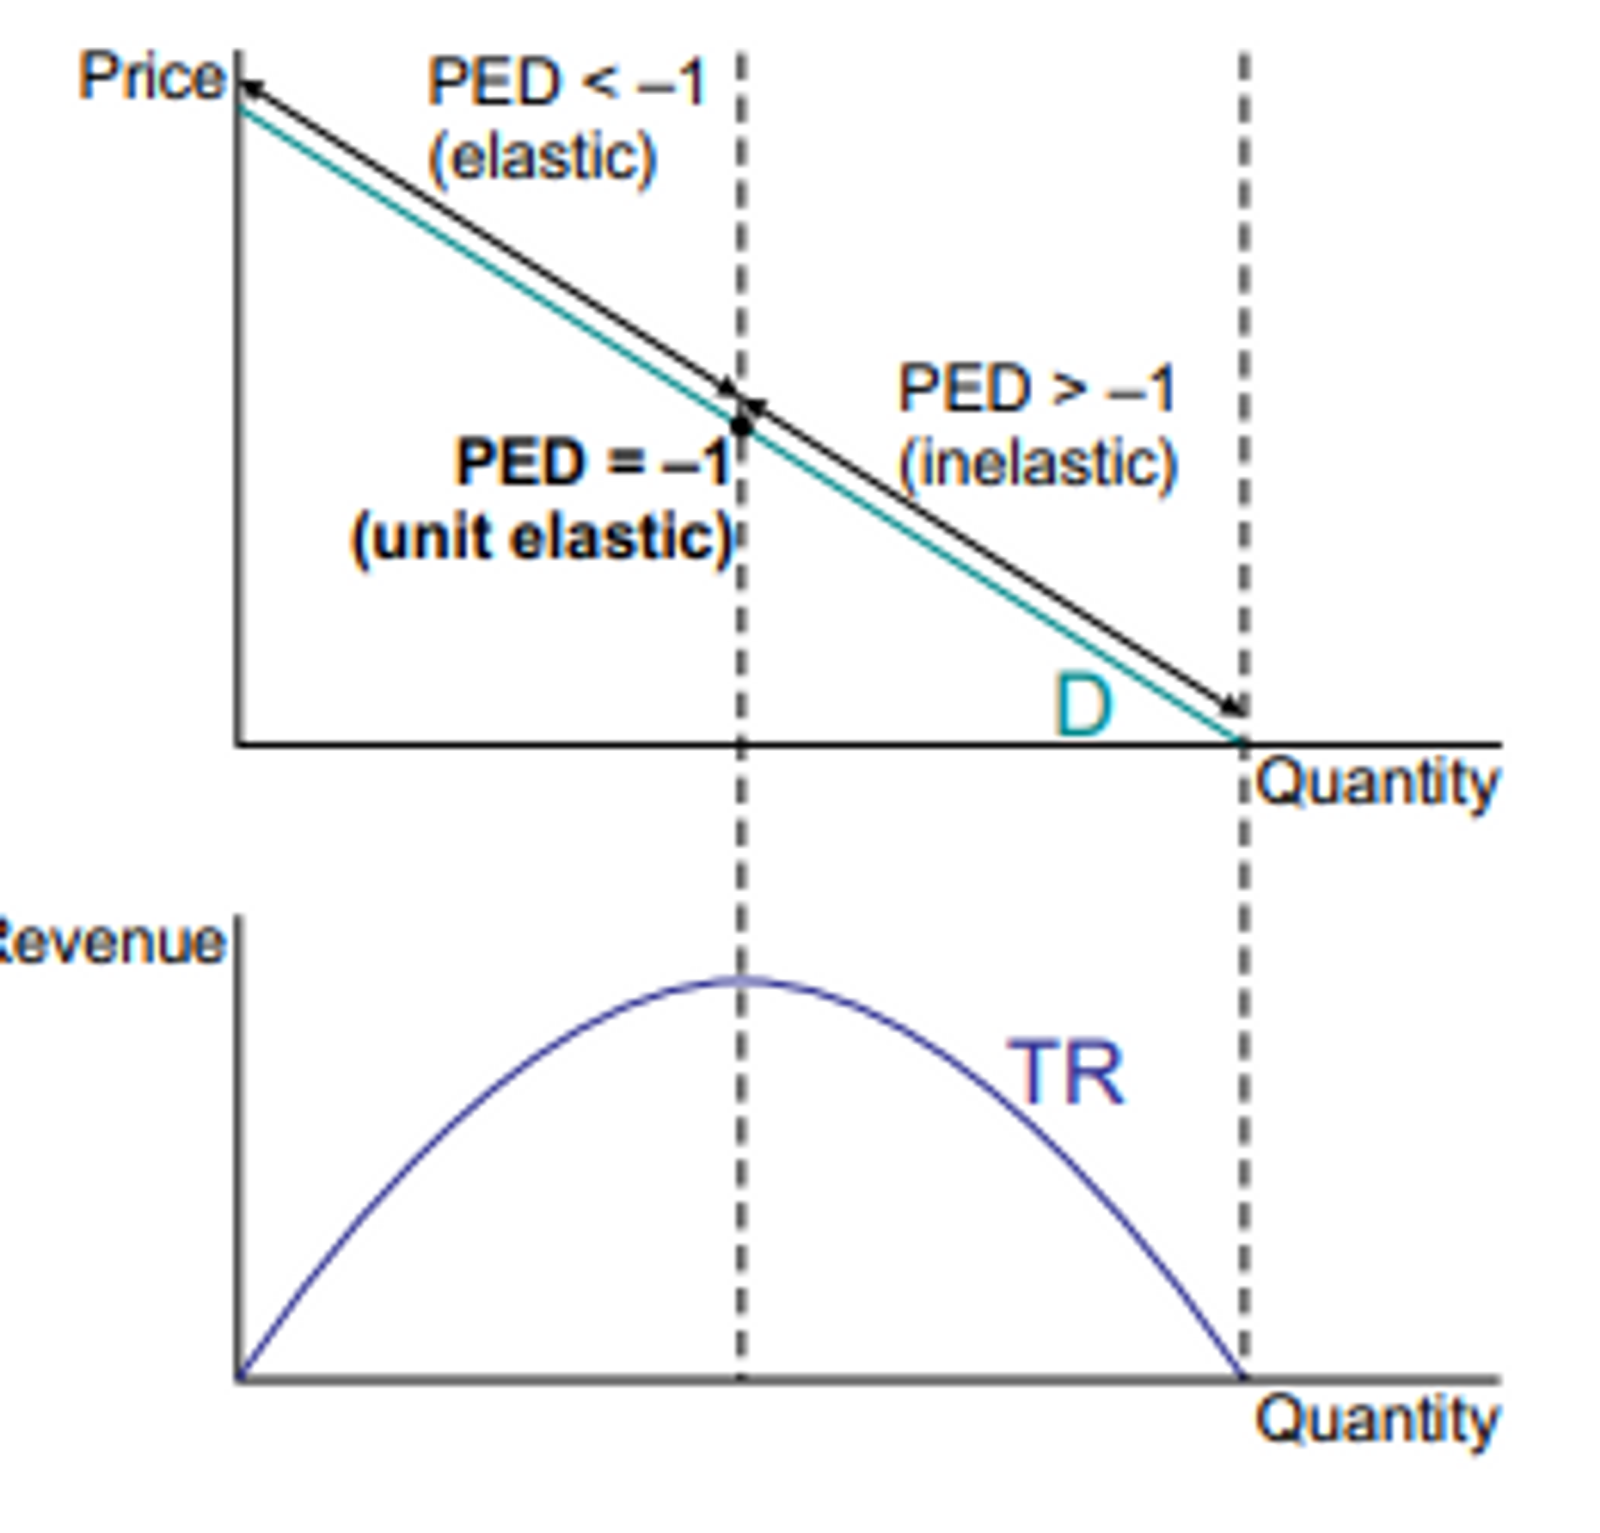

1. When TR is at its maximum ( and MR is 0), demand is unit elastic
2. To the left PED is elastic as decreasing the price will cause a more than proportionate increase in sales and TR will increase
3. To the right, PED is elastic as decrease the price will cause a less than proportionate increase in sales and TR will decrease
36
New cards
normal profit
The minimum level of profit required to keep the factors of production in their current use AR=AC
37
New cards
Supernormal Profit
Any profit made above normal profit AR>AC
38
New cards

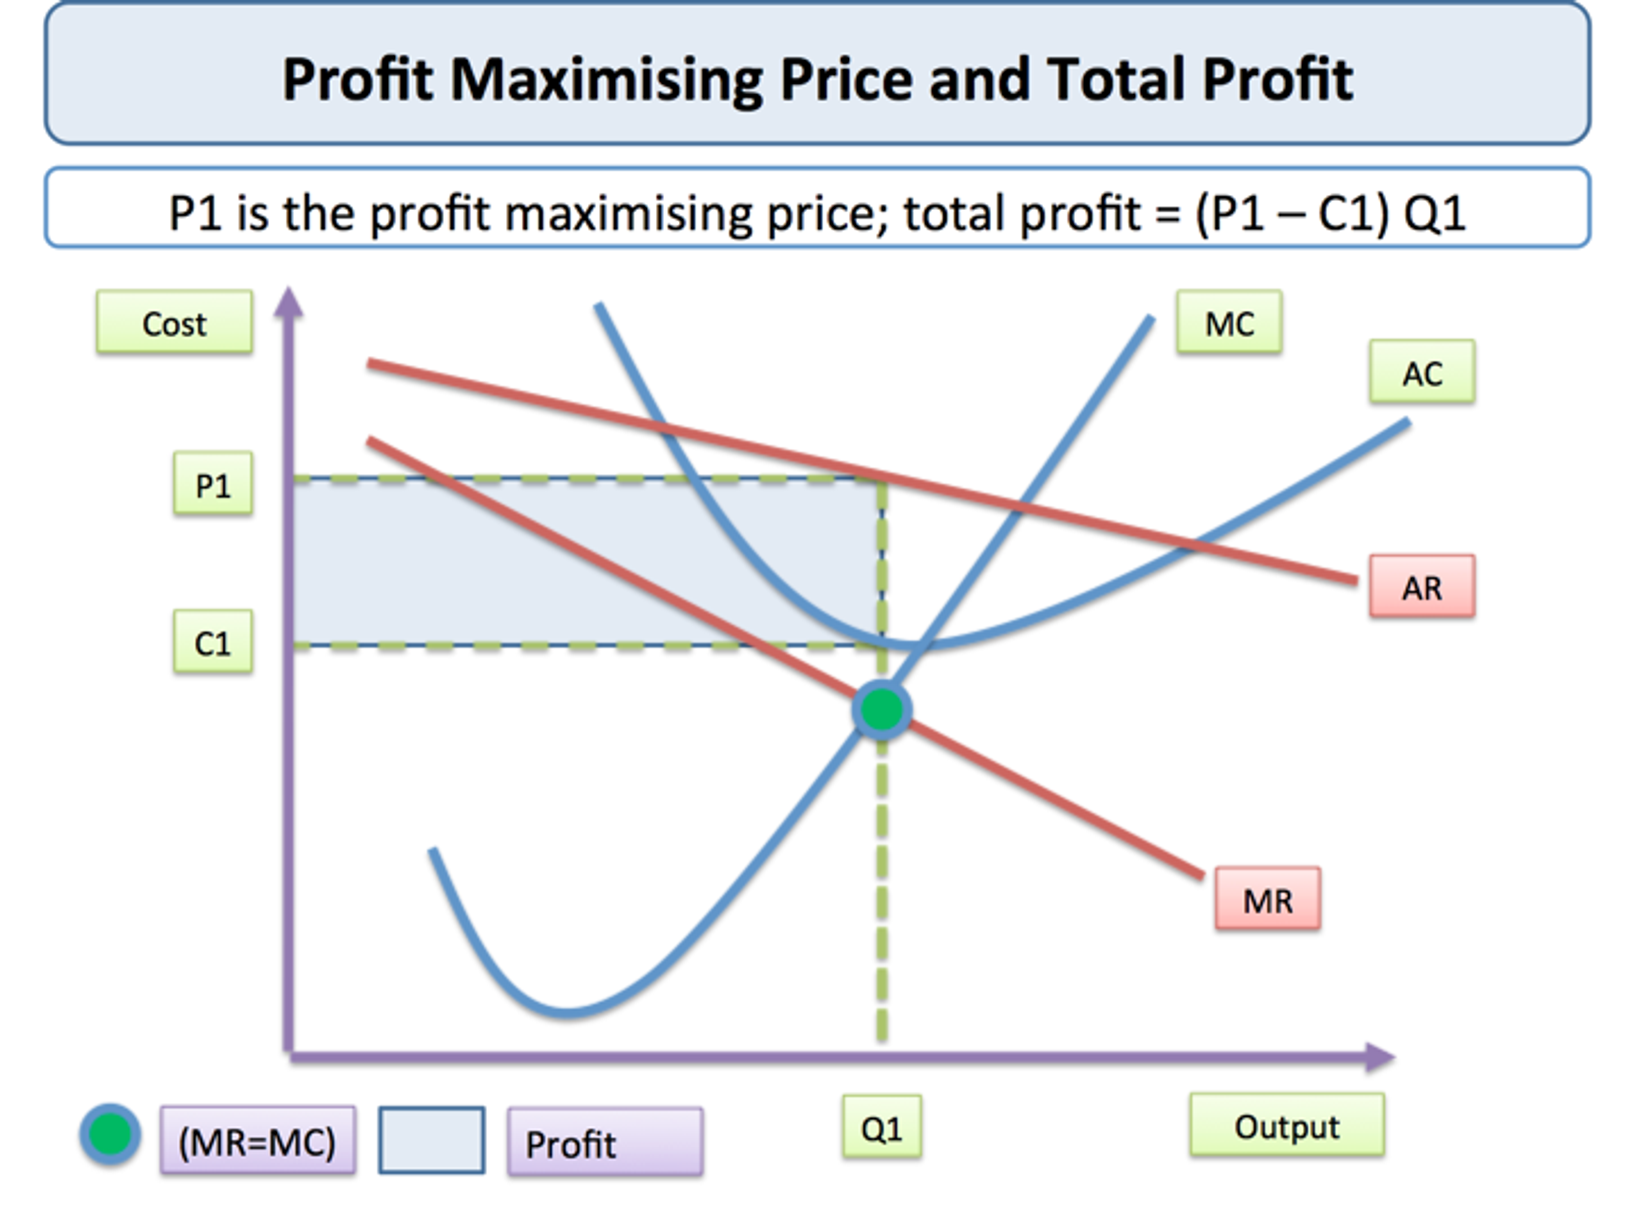
Draw Max Revenue, Max Profit, Max Sales, Allocative efficiency, with profits
knowt flashcard image
39
New cards
Where is max profit and why
MC=MR, The cost of producing an extra unit is covered by the marginal revenue
40
New cards
Where is maximum sales
AR=AC
41
New cards
Where is allocative efficiency and why
MC=P, the price that consumers are willing and able to pay
42
New cards
Innovation
transforming an invention into commercial reality
43
New cards

What is an economic good?

a good or service that has utility which has an opportunity cost

44
New cards

What is a capital good

one that is used to make consumer goods and services

45
New cards

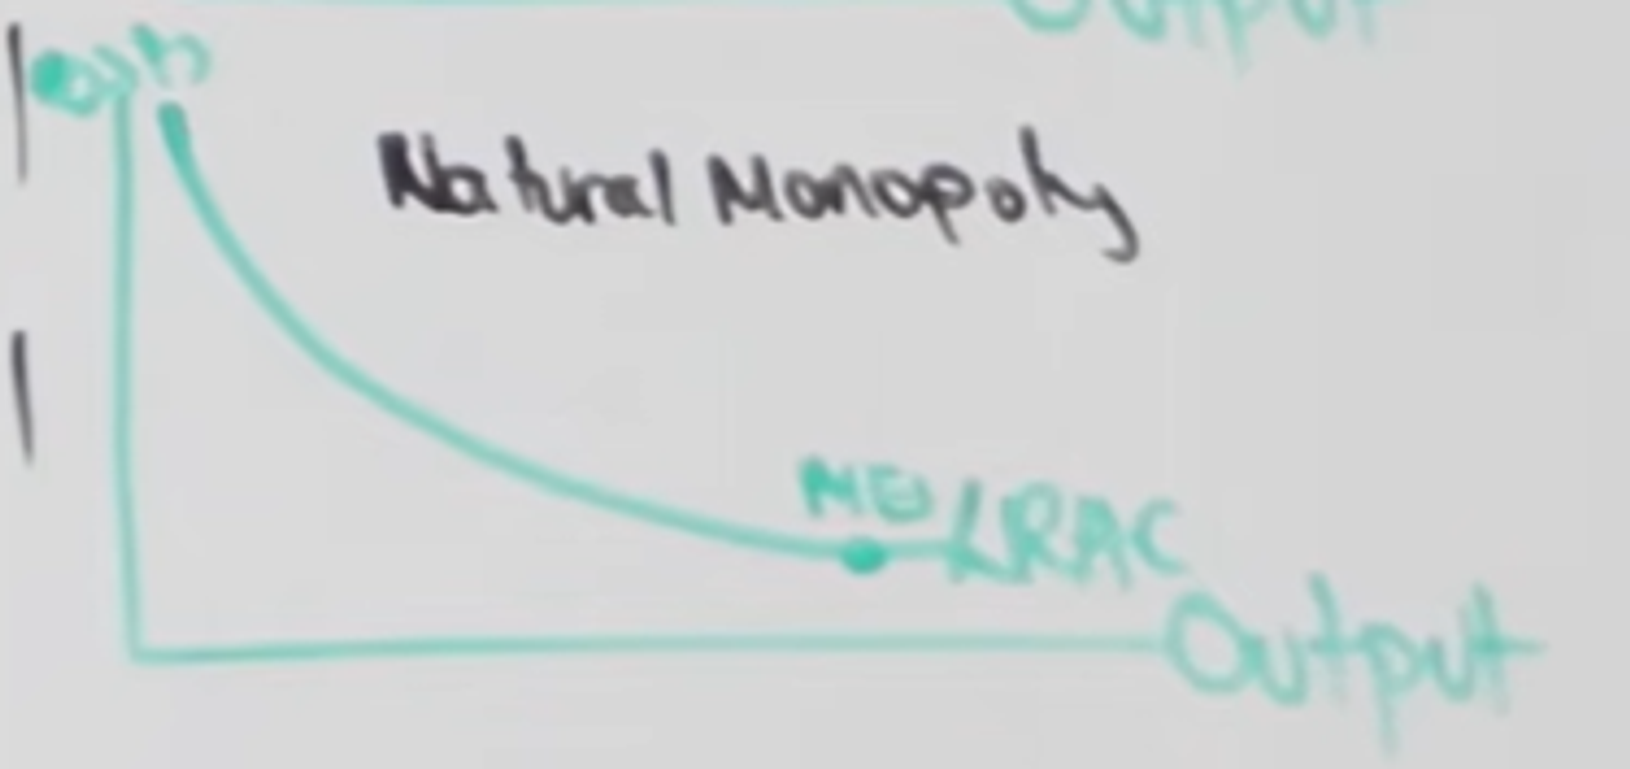
Draw the long run average cost curve for a natural monopoly and explain it

→ a natural monopoly has very high fixed costs

→ it would take a huge level of output to minimise its average cost

→ therefore, the curve is constantly downwards sloping

→ potential for economies to scale is very big
<p>→ a natural monopoly has very high fixed costs</p><p>→ it would take a huge level of output to minimise its average cost</p><p>→ therefore, the curve is constantly downwards sloping</p><p>→ potential for economies to scale is very big</p>
46
New cards

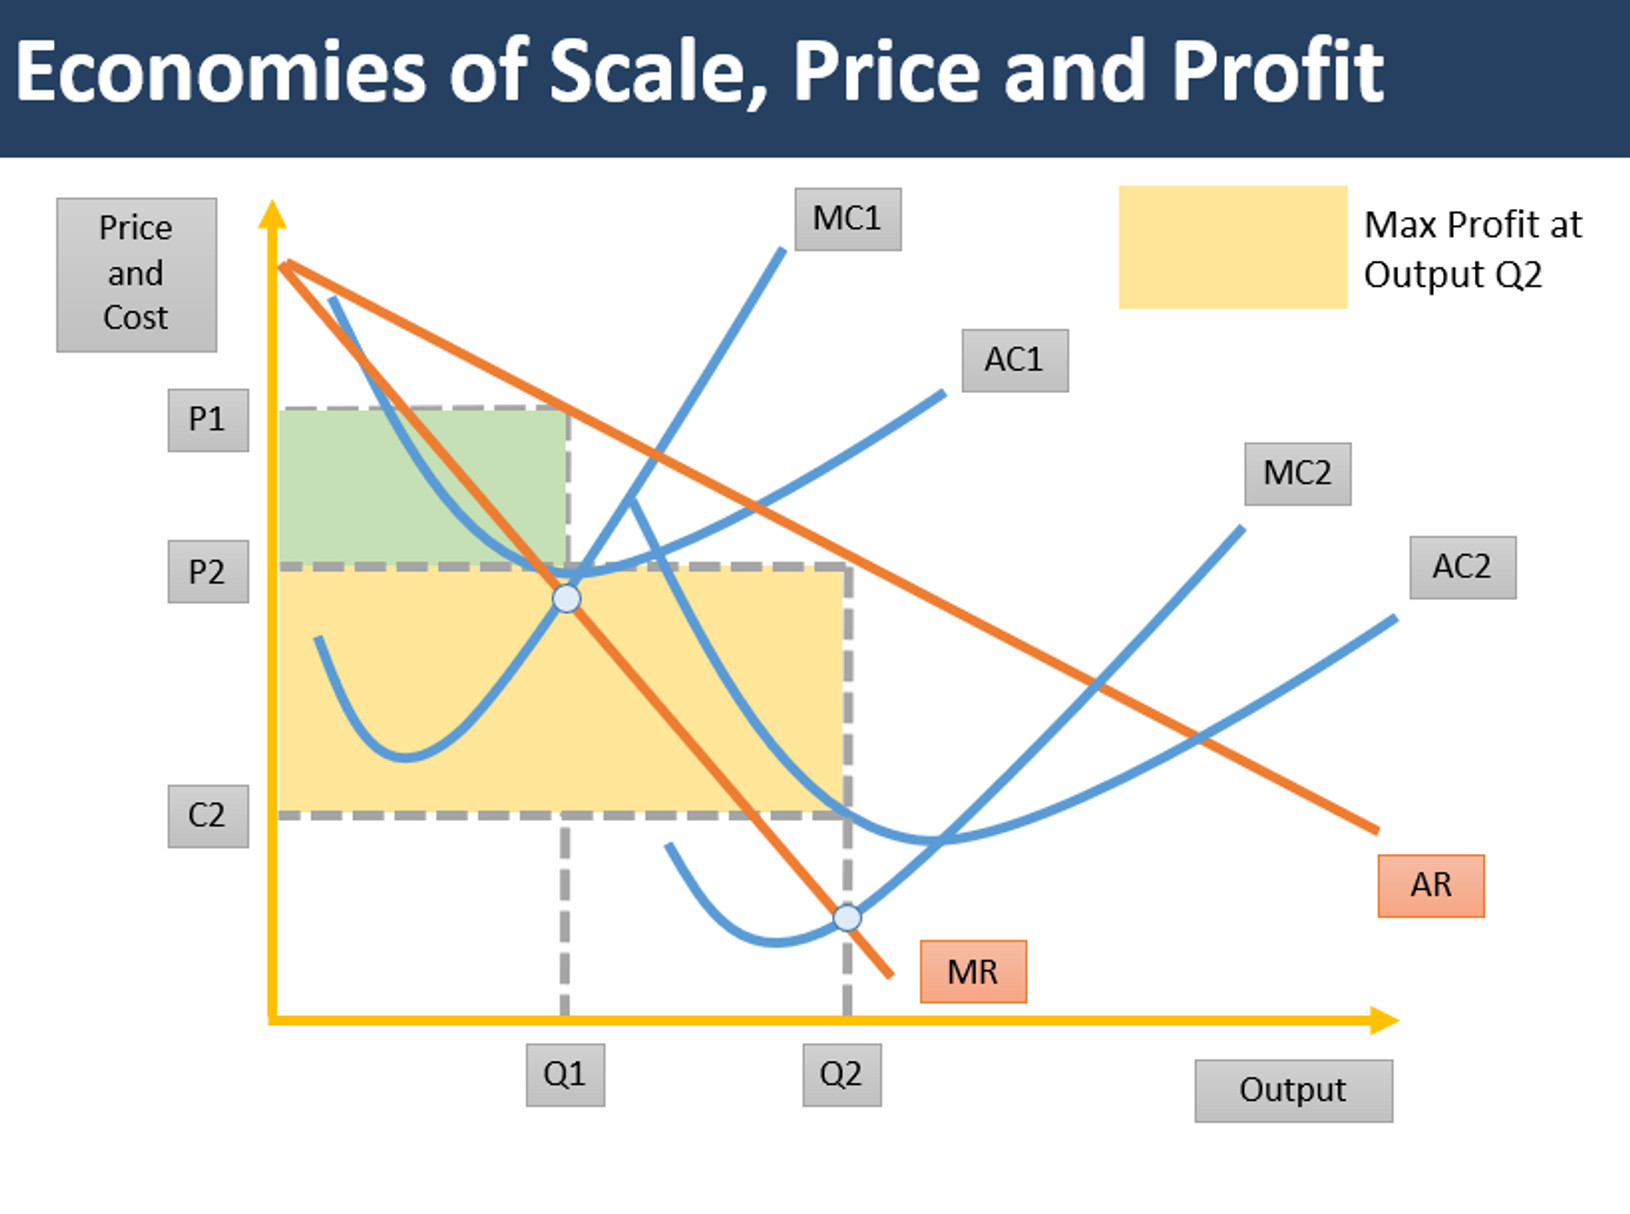
Draw economies of scale on a cost, revenue, production diagram (monopoly/monopolistic competition)

  • higher output

  • lower maximising price

  • higher profit

  • higher producer surplus

  • higher consumer surplus

<ul><li><p>higher output</p></li><li><p>lower maximising price</p></li><li><p>higher profit</p></li><li><p>higher producer surplus</p></li><li><p>higher consumer surplus</p></li></ul>
47
New cards

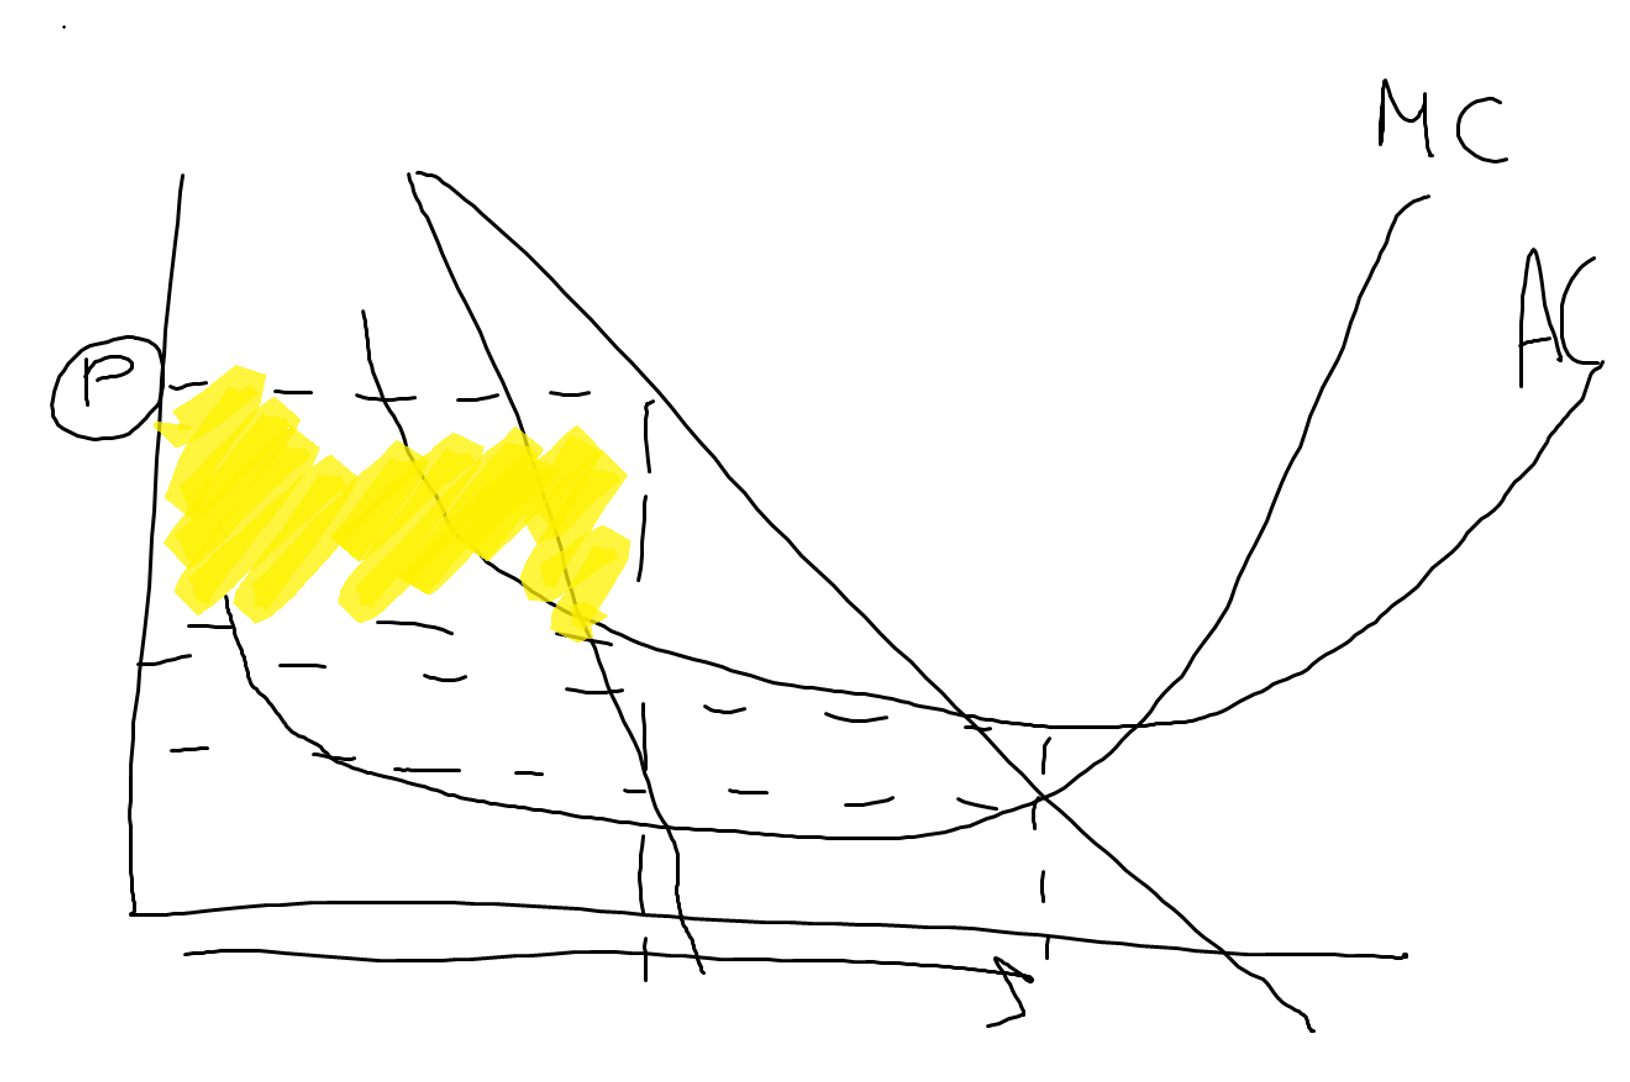
Draw and explain why natural monopolies may not want to be allocatively efficient

If a natural monopoly were operating at allocative efficiency MC=P, they would be making a loss (abnormal profit) A fair price would be AC=AR, they would breakeven and make normal profit.

firms are more likely to maximise their profits (highlighted) , as to charge a fair price, they have to sell a very large quantity
<p>If a natural monopoly were operating at allocative efficiency MC=P, they would be making a loss (abnormal profit) A fair price would be AC=AR, they would breakeven and make normal profit.</p><p>firms are more likely to maximise their profits (highlighted) , as to charge a fair price, they have to sell a very large quantity</p>
48
New cards

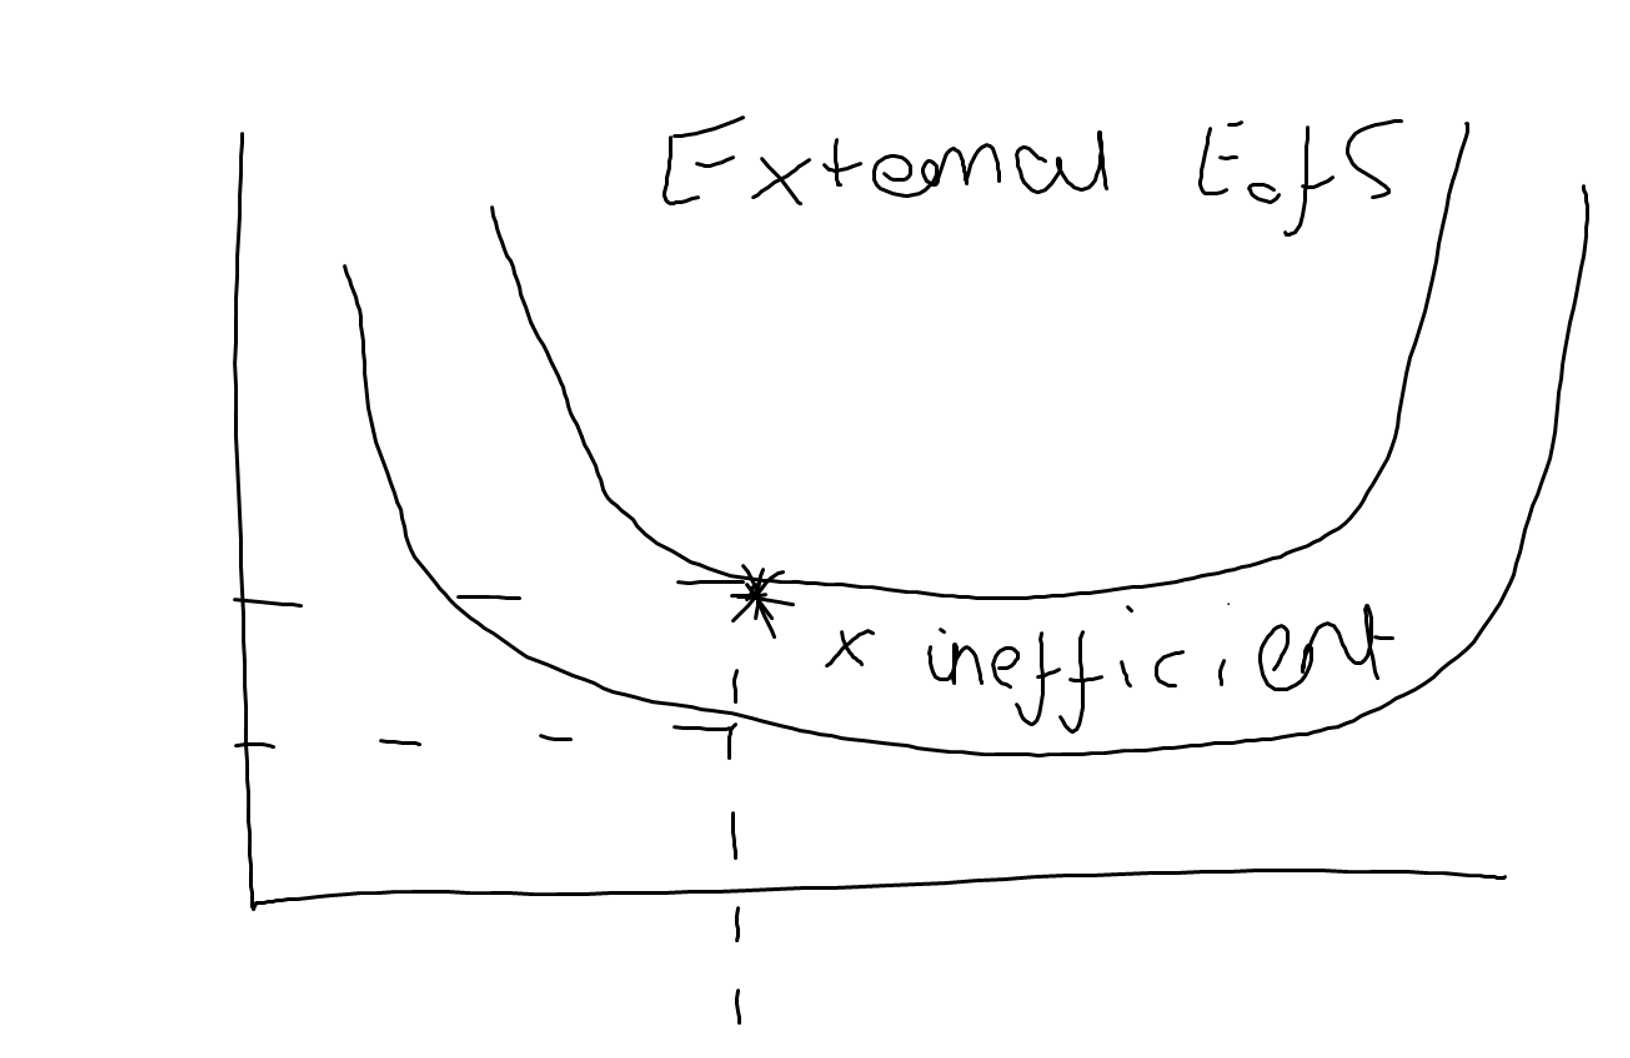
Draw x inefficiency on an LRAS diagram for a monopoly and explain the consequences of it

→ X inefficiency means that LRAS may increase and the firms may experience external diseconomies of scale. They may not have control over them:

  • lack of funding

  • suppliers moving further away

  • lack of infrastructure

  • R&D

  • education and training

<p>→ X inefficiency means that LRAS may increase and the firms may experience external diseconomies of scale. They may not have control over them:</p><ul><li><p>lack of funding</p></li><li><p>suppliers moving further away</p></li><li><p>lack of infrastructure</p></li><li><p>R&amp;D</p></li><li><p>education and training</p></li></ul>
49
New cards

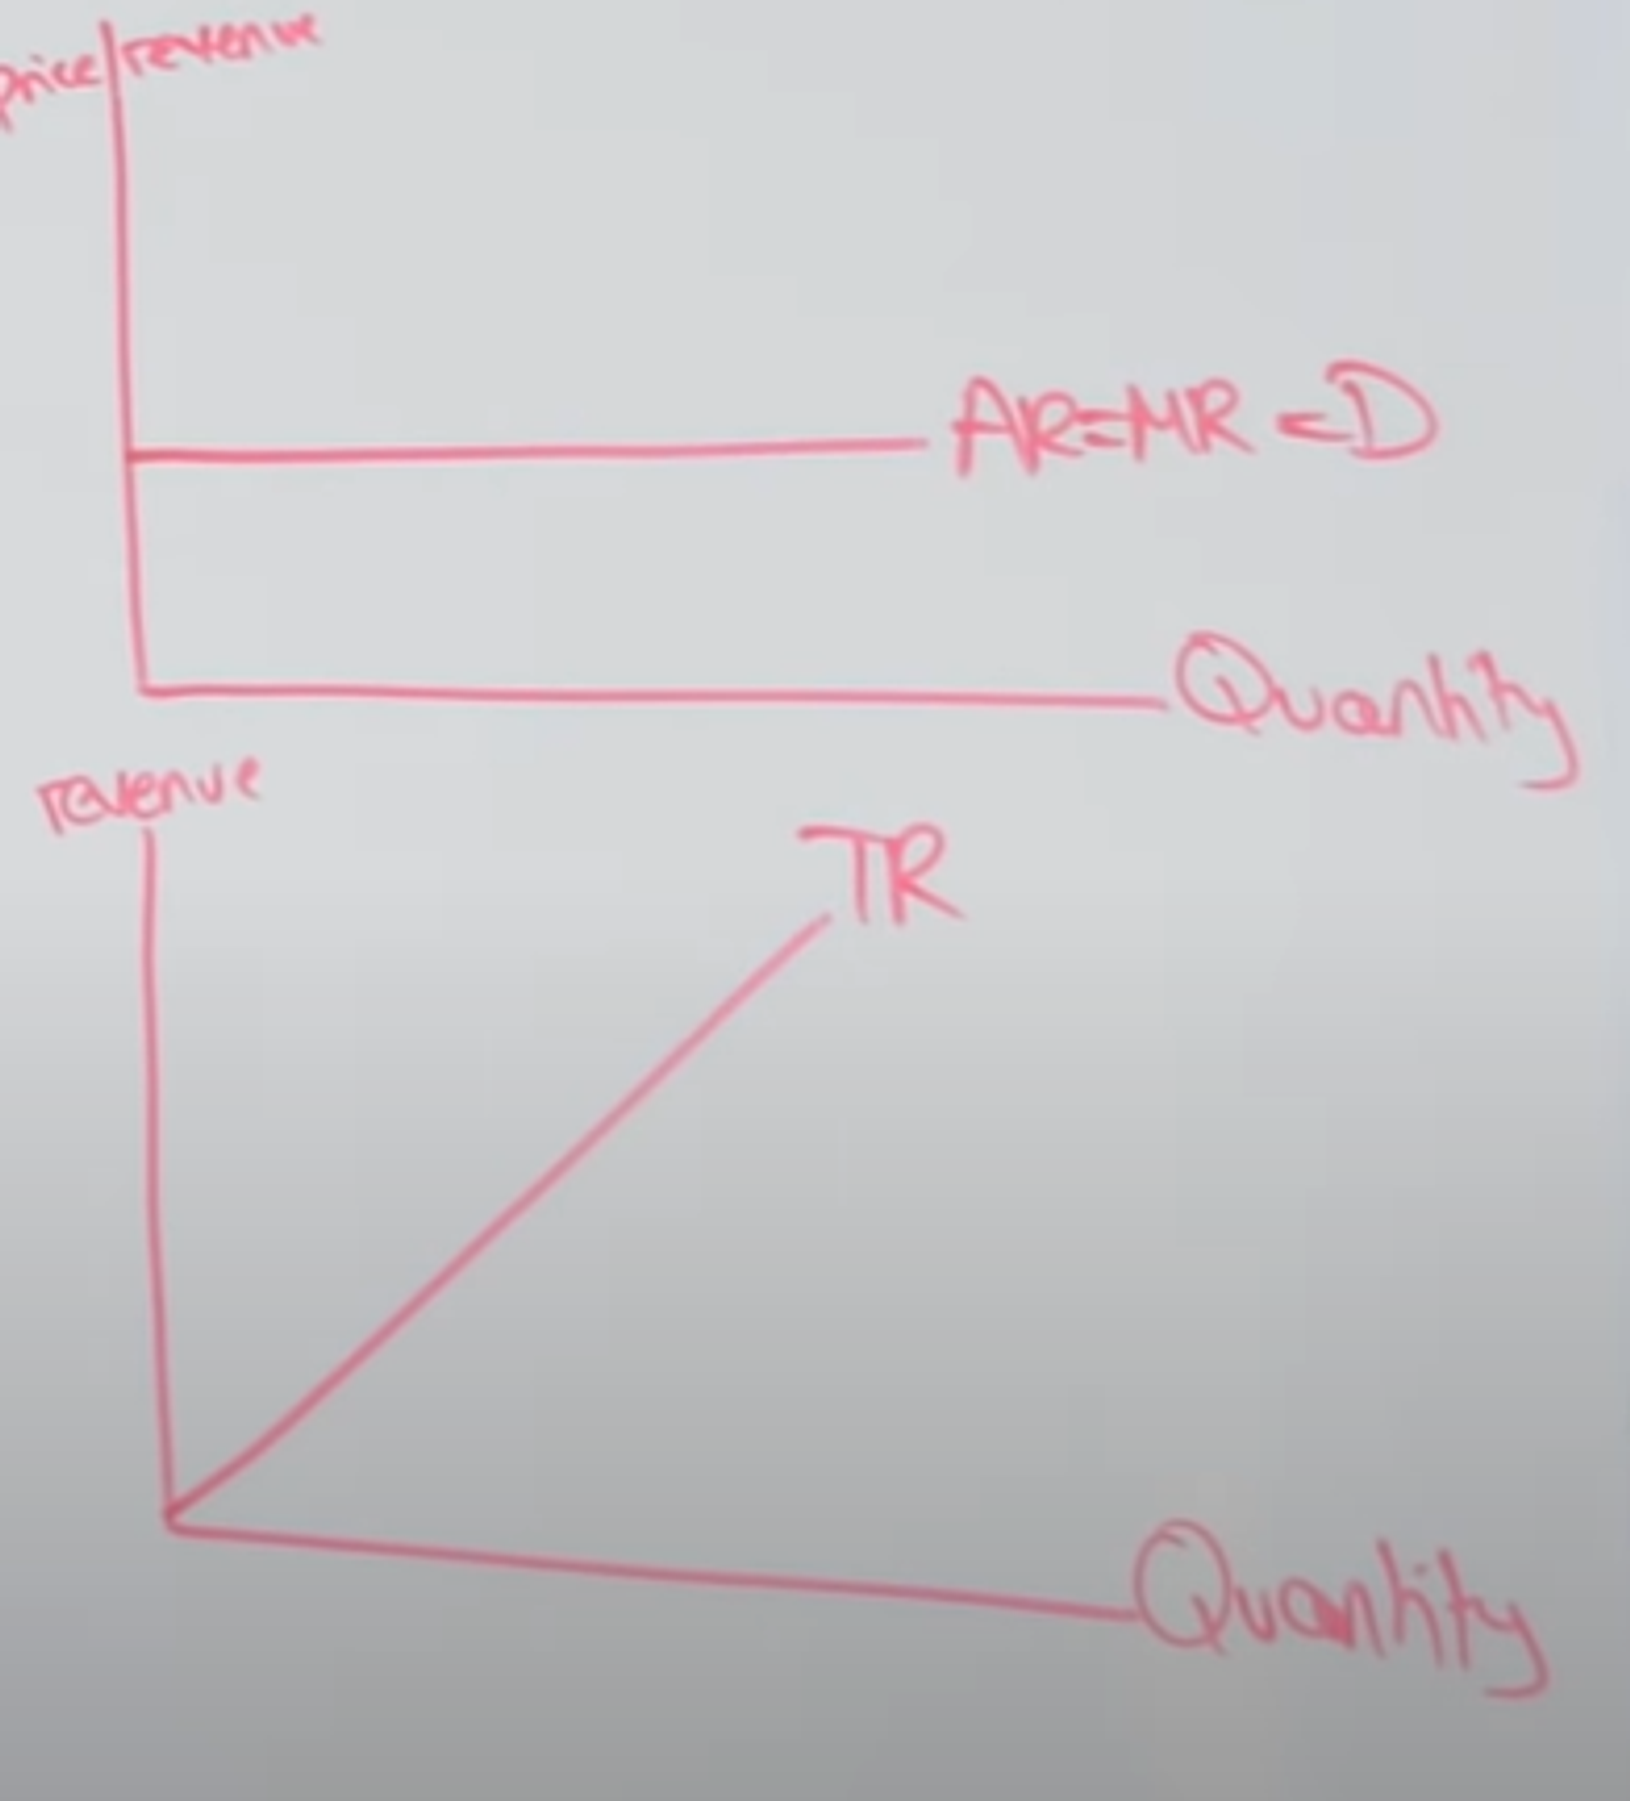
Draw revenue curves for a perfect competition markets. What type of elasticity is the D curve

→ a perfectly elastic demand curve
<p>→ a perfectly elastic demand curve</p>
50
New cards

What is creative destruction

Innovation can lead to creative destruction and destroy whole markets e.g. the development of cars has destroyed public transport markets in some areas

  • Music and book retailing (Amazon)

  • Music and Streaming (Spotify)

  • Media and Entertainment (Netflix, Youtube)