Two paired continuous variables
1/4
There's no tags or description
Looks like no tags are added yet.
Name | Mastery | Learn | Test | Matching | Spaced | Call with Kai |
|---|
No analytics yet
Send a link to your students to track their progress
5 Terms
TWO PAIRED CONTINUOUS VARIABLES
What does a paired samples t-test evaluate? (t.test() or pairedSamplesTTest())
Formal name: Student’s paired samples t-test
It compares the means of two related groups (e.g., before vs. after measurements on the same subjects).
H₀: the mean difference between the paired groups is zero
the difference between the population means for both samples is zero
H₁: the mean difference is not zero
the difference between the population means for both samples is not zero
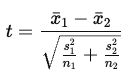
What is the test statistic for a paired samples t-test and how are degrees of freedom calculated?
dˉ = mean of the differences
sd = standard deviation of the differences
n = number of paired observations
*Values further away from zero (i.e., higher absolute values) correspond to a lower probability of H0 being true
Degrees of freedom: df = N−1
N is the number of observations in the data set
*exact rejection regions depend on degrees of freedom
What is Cohen’s d and how is it interpreted for paired samples t-tests? - Effect size
Cohen’s d measures the size of the mean difference:
0.20 = small effect
0.50 = medium effect
0.80 = large effect
*larger values correspond to a greater difference difference in means
What assumptions does the paired samples t-test have?
The differences between paired observations are normally distributed
Check with: Shapiro-Wilk test, histogram, Q-Q plot
If normality is violated: use the Wilcoxon signed-rank test (wilcox.test())
(???? chat said:)
Observations within pairs are related; observations across pairs are independent