PsyStat | M3
1/34
There's no tags or description
Looks like no tags are added yet.
Name | Mastery | Learn | Test | Matching | Spaced |
|---|
No study sessions yet.
35 Terms
Correlational Method
two different variables are observed to determine whether there is a relationship between them.
Correlation
an expression of the degree and direction of correspondence between two things
Correlation Coefficient ( r )
It is a number that provides an index of the strength of the relationship between two variables
Positive Correlation
two variables simultaneously increase or simultaneously decrease. (direct relationship)
Negative Correlation
one variable increases while the other decreases. (inverse relationship)
• It does not imply causation.
• (r) ranges from -1 to +1
Little Correlation
0.0 - ±0.2
Weak Correlation
±0.2 - ±0.4
Correlated
±0.4 - ±0.7
Strong Correlation
±0.7 - ±0.8
Very Strong Correlation
±0.9 - ±1.0
High Correlation
Between ±0.8 to ±1.0
Moderately High Correlation
Between ±0.6 - ±0.79
Moderate Correlation
Between ±0.4 - ±0.59
Low Correlation
Between ±0.2 - ±0.39
Negligible Correlation
Between ±0.1 - ±0.19
Experimental Method
• One variable is manipulated while another variable is observed and measured.
• To establish a cause-and-effect relationship between the two variables, an experiment attempts to control all other variables to prevent them from influencing the results.
Manipulation
Control
2 characteristics of Experimental Method
Manipulation
The researcher manipulates one variable by changing its value from one level to another.
Control
The researcher must exercise control over the research situation to ensure that other, extraneous variables do not influence the relationship being examined.
N
Population
n
Sample Size
X
Score
∑
Summation
Summation
sum of scores
Summation
often included with several other mathematical operations, such as multiplication or squaring. To obtain the correct answer, it is essential that the different operations be done in the correct sequence.
1. Any calculation contained within parentheses is done first.
2. Squaring (or raising to other exponents) is done second.
3. Multiplying and/or dividing is done third. A series of multiplication and/or division operations should be done in order from left to right.
4. Summation using the Σ notation is done next.
5. Finally, any other addition and/or subtraction is done.
Order of Mathematical Operations
Stem and Leaf Display
• In 1977, J.W. Tukey presented a technique for organizing data that provides a simple alternative to a grouped frequency distribution table or graph (Tukey, 1977).
Stem
Leaf
The first digit (or digits) is called the _____,and the last digit is called the ______.
Percentiles
It is an expression of the percentage of people whose score on a test or measure falls below a particular raw scorer’s .
Percentage Correct
an expression of the number of items answered correctly, multiplied by 100 and divided by the total number of items.
Real Limit
the boundaries of intervals for scores that are represented on a continuous number line. The ________ separating two adjacent scores is located exactly halfway between the scores.
Upper real limit
Low real limit
The _____________ is at the top of the interval, and the _____________ is at the bottom.
Rank or Percentile Rank
defined as the percentage of individuals in the distribution with scores at or below the particular value.
percentile
When a score is identified by its percentile rank, the score is called a
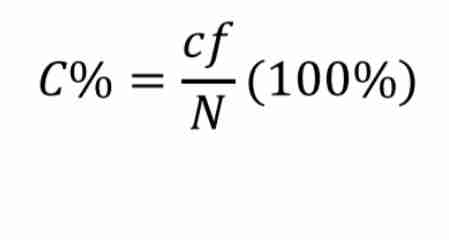
Cumulative percentage
