Unit 1 Precalculus
 Call Kai
 Learn
Learn Practice Test
 Spaced Repetition
 Match
Match Flashcards
 Knowt Play
1/23

Earn XP
Description and Tags
Key Vocabulary Terms and Questions for Unit 1 AP Precalculus Test
Name | Mastery | Learn | Test | Matching | Spaced | Call with Kai | Chat |
|---|
No analytics yet
Send a link to your students to track their progress
24 Terms
Relation
A set of ordered pairs, where each pair consists of an input and an output value, often representing a relationship between two quantities.
Function
A specific type of relation where each input is associated with exactly one output in the range, typically described by a formula or equation.

Polynomial Function
The graph crosses the x-axis up to n times and has up to n-1 vertices. The domain is all real numbers. The range would be the values greater/lesser than the minimum/maximum points.

Quadratic Function
Form: y = ax²+bx+c
The graph changes direction at its one vertex. The domain is all real numbers. The range would be the values greater/lesser than the vertex depending on whether it is a minimum or maximum point.
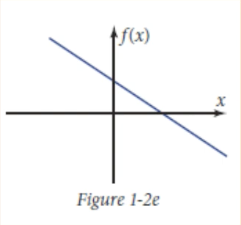
Linear Function
Form: y = ax+b
The straight-line graph, f(x), changes at a constant rate as x changes. The domain is all real numbers. The range is not always real numbers because if the slope is 0, the range will only be b.

Differences Table
Way of analyzing a function by looking at its rate of change. One must have equal length input intervals to use a differences table. We don’t use slope, but something similar since we are essentially calculating rates of change.

Direct Variation
The straight-line graph goes through the origin. The domain is all real numbers. It can be ANY power of x. It can be a quadratic or cubic or anything that goes through the origin.

Power Function
Form: y = ax^b
The domain depends on the value of b. It is completely dependent on the b number on what the graph will look like. For positive integer values of b, the domain is all real numbers; for negative integer balues of b, the domain is x ≠ 0.

Inverse Function
Form: y = a/x or a/x^-n
f(x) varies inversely with x (or with the nth power of x). For positive values of n, domain is x ≠ 0. For real-world applications, domain is x > 0.

Rational Function
Form: y = n(x)/d(x) where n and d are polynomial functions
Has a discontinuity (asymptote or missing point) where the denominator is 0; it may have horizontal or other asymptotes.
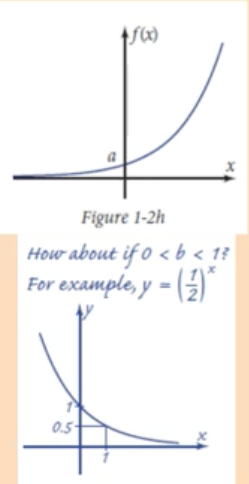
Exponential Function
Form: y = a*b^x where a ≠ 0, b > 0, b ≠ 1
f(x) varies exponentially with x. Graph crosses the y-axis at f(0) = a and has the x-axis as an asymptote.

Differences Table for Exponential Functions
The differences are dependent on the b factor. For example, if b was 2, the differences would all be 2 times the previous difference.
Boolean Variable
Equals 1 if a given condition is true and 0 if that condition is false.

Graphing Boolean Restrictions
Follow the images’ method
Increasing Function
If input values increase, the output values always increase. Given a and b are in the interval, if a < b, then f(a) < f(b).
Decreasing Function
If input values increase, the output values always decrease. Given a and b are in the interval, if a < b, then f(a) > f(b).

Concave Up
Rate of change is increasing.

Concave Down
Rate of change is decreasing.
Concave Up
Sample Table of Values.
Concave Down
Sample Table of Values.
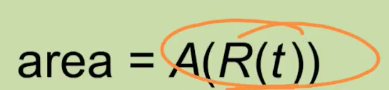
Composition of Functions
Something like f(g(x)).
Inverses Rule
The graphs of inverses are reflections over the line y = x.
Parametric Function
Simple way to plot the graph of the inverse of a function. Here, x and y are both expressed in terms of some third variable, usually t which is known as the PARAMETER. The variable t is often the independent variable in real-world applications because it is time or such variable.
Parametric Equation Form
X1T = T, Y1T = original function (replace variable with T), X2T = original function (replace variable with T), Y2T = T. Note: Put domain in Tmin and Tmax in Window in calculator. And when dealing with quadratic business, always find out vertex which will help in finding the range.