Descriptive Statistics
1/58
There's no tags or description
Looks like no tags are added yet.
Name | Mastery | Learn | Test | Matching | Spaced | Call with Kai |
|---|
No analytics yet
Send a link to your students to track their progress
59 Terms
Population
Is a complete set of persons or objects that possess some common characteristics that is of interest to the researcher.
Target, Accessible Population
The population for a study usually is described as being composed of two groups?
Target Population
Which is also called the universe is composed of the entire group of people or objects to which the researcher wishes to generalize the findings of the study.
Consists of people or things that meet the designated set of criteria of interest to the researcher.
Accessible Population
It is aggregate of cases that confirm to designated criteria and are also accessible as subjects for study.
By identifying the group from which the study sample was chosen, the investigator about the conclusion of the generalize ability of research findings.
Sample
May be defined as representative unit of target population which is to be worked upon by researchers during their study.
Quantitative researchers
Often select samples that will allow them to achieve stating conclusion validity and generalize their result. They therefore develop a sampling plan that specifies in advance how study participants are to selected and how many to include.
Qualitative researchers
Make sampling decision during the course of data collection based on information & theoretical need & typically do not develop a formal sampling plan in advance.
Principles of Sampling
Principle or Law of statistical regularity
Large sample size
Random Selection
Principle of inertia of large numbers
Principle of validity
Principle of optimization
Principle or Law of statistical regularity
Principles of Sampling
This law is based upon mathematical theory of probability. It is based upon the following two conditions.
Large sample size and random collection
Large sample size
Principles of Sampling: Principle or Law of statistical regularity
As the sample size increases, the true characteristics of the population are more likely to reveal.
Random Selection
Principles of Sampling: Principle or Law of statistical regularity
The sample should be selected randomly in which each and every unit of the universe has an equal chance of being selected.
Principle of inertia of large numbers
Principles of Sampling
It is based upon the concept that as the sample size increases the better results we will get. For example if we have to study the weight of the students studying in a college then fairly adequate sample of the students help us to arrive at good results.
Principle of Validity
Principles of Sampling
if valid tests are derived only then sampling design is termed as valid.
Principle of Optimization
Principle of Sampling
this principle states that with the help of sample one must be able to get optimum results with maximum efficiency and minimum cost.
Sample
A subgroups of the members of population chosen to participate in the study.
Only a handful of units of population
It focus on making interferences about population.
Data collection is sampling survey or sampling.
Population
Refers to collection of all elements possessing common characteristics that comprise the universe.
Each and every unit of the group
It focus on identifying the characteristics
Data collection is complete enumeration or census
Data
Is any facts, observations, or information collected together for reference or analysis which is used as a basis for decision making.
Variable
Any characteristic which changes its values.
Examples: height, weight, sex, marital status, eye color.
It can be classified as Qualitative or Quantitative.
Constant
A characteristic which does not changes its value or nature.
Example: height of a person after 25 years of age.
Types of Variables
Dependent
Independent
Confounding
Dependent Variable
A variable that depends on other variables.
Outcome
Predicted
Independent Variable
Variables that does not depend on other variables.
Explanatory
Predictor
Risk Factor
Influencing Factor
Confounding Variable
Variable/s that correlates (directly or indirectly) with both the independent variable and dependent.
Nuisance variable
Interfering variable
Covariate
Two types of data
Qualitative Data
Quantitative Data
Qualitative Data
It is non numerical data that can be arranged into categories.
This data is also called as Categorical data.
Examples: gender of an individual, nationality of a player grade in examination.
Quantitative Data
It is a numerical data that consists of counts or measurements.
Examples: weight of person, examination marks, profit of a salesman.
Categorical
Nominal ( No Order)
Dichotomous, binary, binomial
Polychotomous
Ordinal (Ordered)
Answers “what?”
Qualitative data is categorized
Numerical
Continuous
Interval
Ratio
Answers “how many?”
Quantitative data is measured
Discrete and continuous
Quantitative data can further be classified as?
Discrete data
Takes on only a finite or countable number of values. These are usually whole numbers.
Examples: population of a country, number of cases of certain disease, number of student in a class.
Continuous Data
Takes all possible values in a certain range and thus have an infinite number of values. This data does not contain any gaps, breaks or jumps.
Examples: height of a person, temperature at a certain place, agricultural production.
Binomial Data
This type of data has only two possible outcomes in each trial, like yes/no, success/failure, or win/lose. Think of it as a choice between two distinct options.
Example: When you toss a coin, it lands on either Heads or Tails. There’s no middle ground or other option – just two possible results.
Polychotomous Data
This data type has more than two categories, but there’s no specific order among the options. It’s like choosing from a list where each option is distinct but equal in rank.
Example: Choosing a favorite fruit: Apple, Banana, Orange, Grape. Each fruit is a separate choice, and none is ranked above the other.
Ordinal Data
This data type has a clear order or ranking among the categories, but the spacing between the levels isn’t equal. It’s like a ladder where each rung represents a different level, but the distance between them isn’t fixed.
Example: Rating a product on a scale like Poor, Fair, Good, Very Good, Excellent. These ratings show a progression, but you can’t say the difference between “Good” and “Very Good” is the same as between “Fair” and “Good.”
Interval Data
Has equal spacing between values, meaning the difference between units is consistent. However, interval data doesn’t have a true zero – zero is just another point on the scale, not an absence of what’s being measured.
Example: Temperature in Celsius: 0°C, 10°C, 20°C. Each interval (10°C) is equal, but 0°C doesn’t mean “no temperature” – it’s just another point on the scale.
Ratio Data
Has equal intervals and a true zero, meaning zero signifies the absence of what’s being measured. This allows for direct comparisons, like saying something is “twice as much.”
Example: Height: 0 cm, 50 cm, 100 cm. Here, 0 cm means no height (true zero), and you can say 100 cm is twice as tall as 50 cm.
Principals of data presentation
To arrange the data in such a way that it should create interest in the reader's mind at the first sight.
To present the information in a compact and concise form without losing important details.
To present the data in a simple form so as to draw the conclusion directly by viewing at the data.
To present it in such away that it can help in further statistical analysis.
Tabular, Graphical
Two types of presentation of data
Simple, complex
Two types of tabular
Graphical for quantitative data
Presentation of data includes:
Histogram
Frequency polygon
Frequency curve
Line chart
Normal distribution curve
Cumulative distribution curve
Scatter diagram
Graphical for qualitative data
Presentation of data includes:
Bar chart
Pictogram
Pie chart
Map diagram
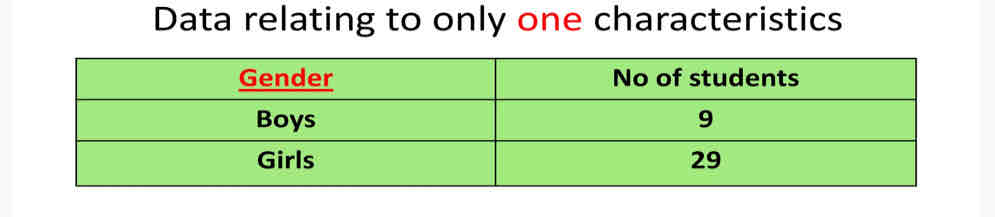
Simple Tables
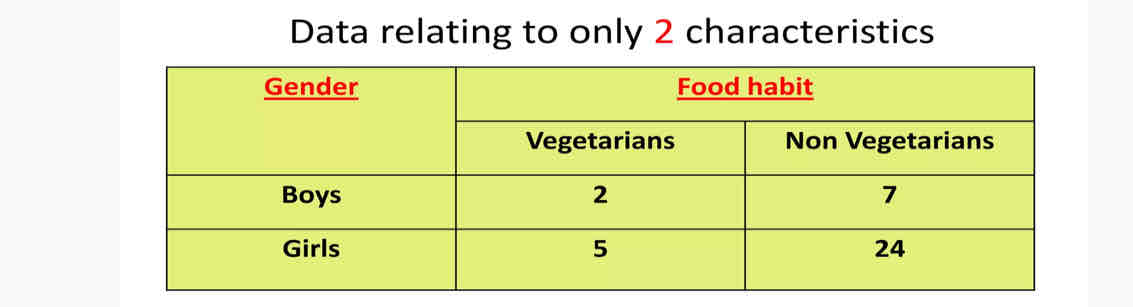
Double Table
Triple Table
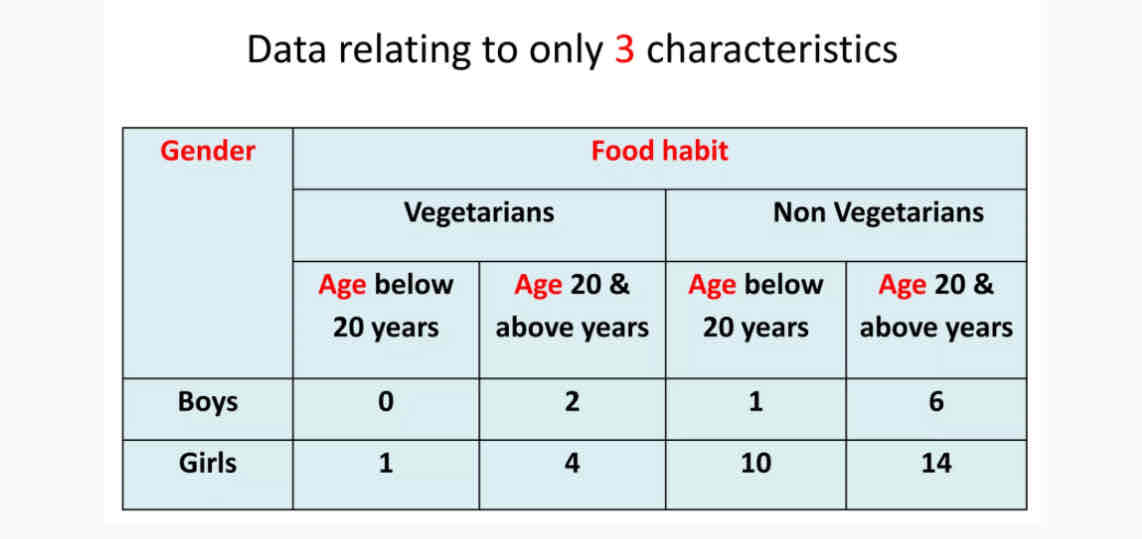
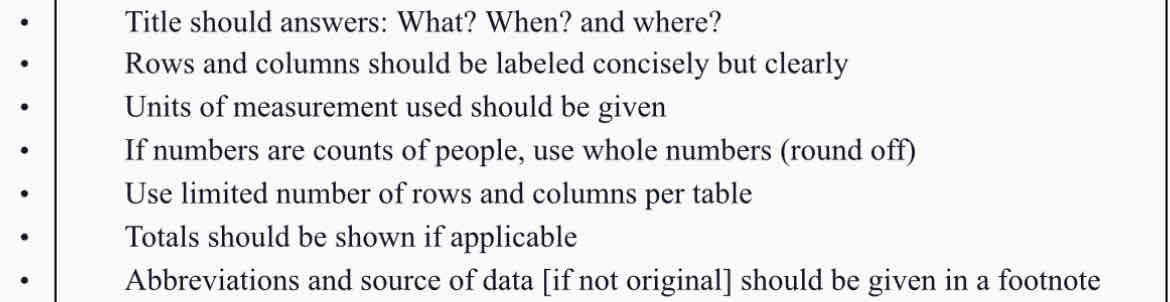
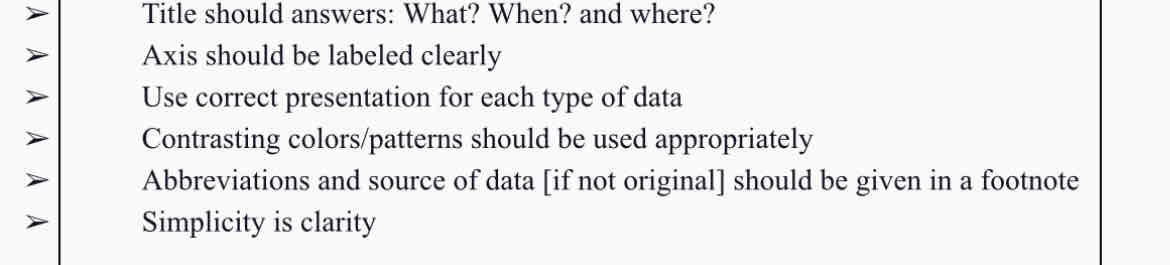
Pointers to remember for tables
Graphs and charts
Rapid grasp of data
Visually attractive
Tells more in less
Common types of graphs
Histogram
Line graph
Graphs
Its use is for plotting quantitative data using a coordinate system.
Histogram
Graphs
Used for presenting frequency distrubution
Line graph
Graph
Used to present more than one set of data in terms of frequency distribution
are used to display the comparison between two variables which are plotted on the X-axis and Y-axis.
They organize and present data in a clear manner and show relationships between the data.
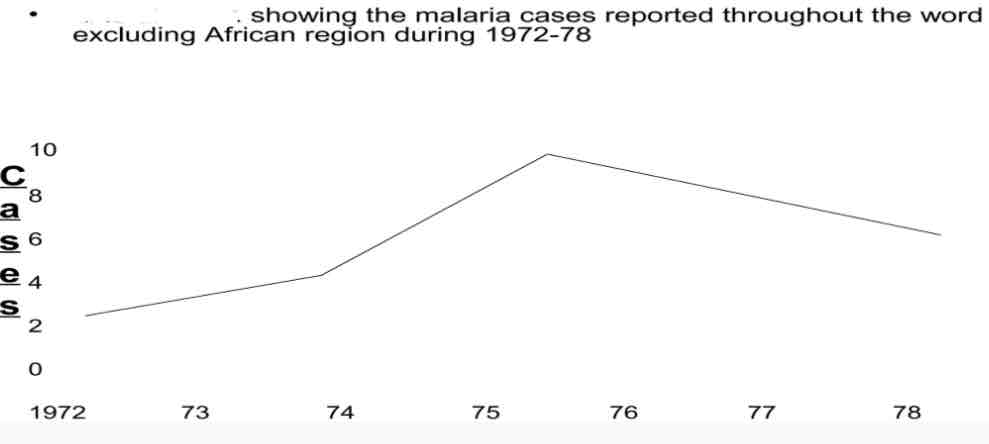
displays a change in direction.
It shows trend of an event occurring over a period of time to know whether it is increased or decreased. Eg: IMR, Cancer deaths etc.
Time, quantity
In Line graph, the X-axis represents measures of _____, while the Y-axis represents percentage or measures of ____.
Line Diagram
Are used to show the trend of events with the passage of time.
Charts
For plotting qualitative data using only one coordinate.
Common types of charts
Bar charts
Pie charts
Bar chart
Charts
Used to compare categories or groups
Pie chart
Charts
Used to illustrate the division of the whole into segments or sections
Pointers to remember for graph and charts
Statistical map or dot map
When statistical data refers to geographic or administrative areas, it is presented either as ________.
The shaded maps are used to present data of varying size. The areas are shaded with different colour or different intensities of the same colour, which is indicated in the key.
Scatter diagram
Show the relationship between the two variables.
e.g a positive correlation/ association between the intake of fat and sugar in the average diets of 41 countries.
If the dots cluster round a straight line, it shows evidence of a relationship of a linear nature.
If there is no such cluster, it is probable that there is no relationship between the variables.