exam 3 study pt 1
 Call Kai
 Learn
Learn Practice Test
 Spaced Repetition
 Match
Match Flashcards
 Knowt Play
1/18

Earn XP
Description and Tags
Observational & Single-Subject Research Designs ppt
Name | Mastery | Learn | Test | Matching | Spaced | Call with Kai | Chat |
|---|
No analytics yet
Send a link to your students to track their progress
19 Terms
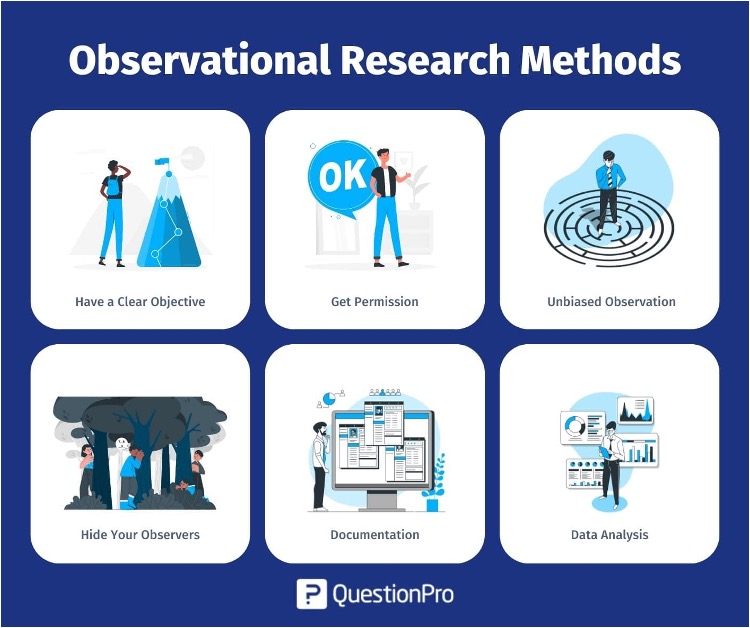
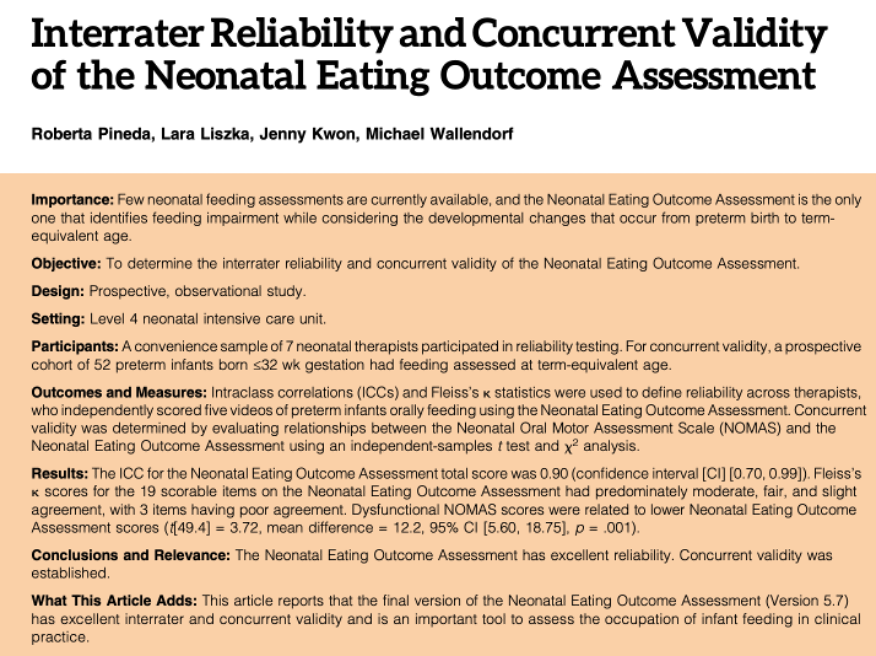
what is the purpose of an observational study and when would you use it
Observe what happens naturally without giving a treatment.
Researchers do not manipulate anything—they only collect information.
Use when:
You want to identify patterns or relationships.
Giving a treatment would be unethical or impossible.
You're generating hypotheses for future studies.
Key point: Observational studies cannot prove cause and effect because no intervention is given.
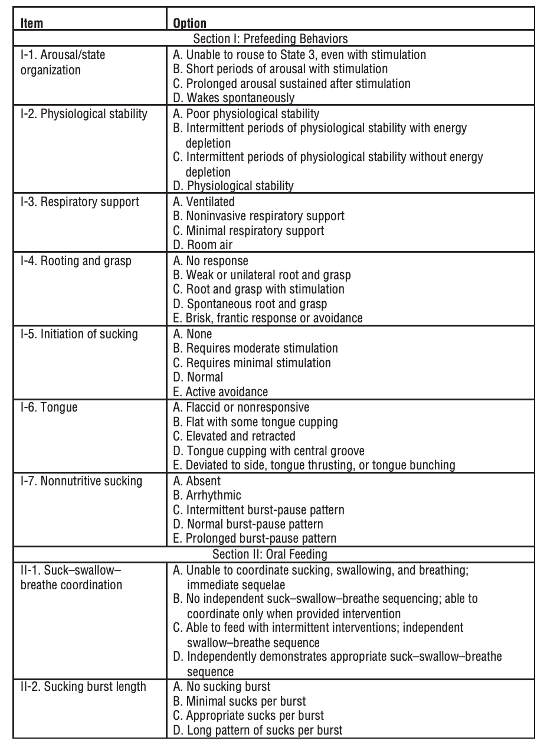
what is a prospective study, what threatens it
Present → Future
Researchers begin now and follow people over time.
threat» attrition
(more control clear sequence)
what is attrition
the gradual, steady reduction of something's size, numbers, or strength.
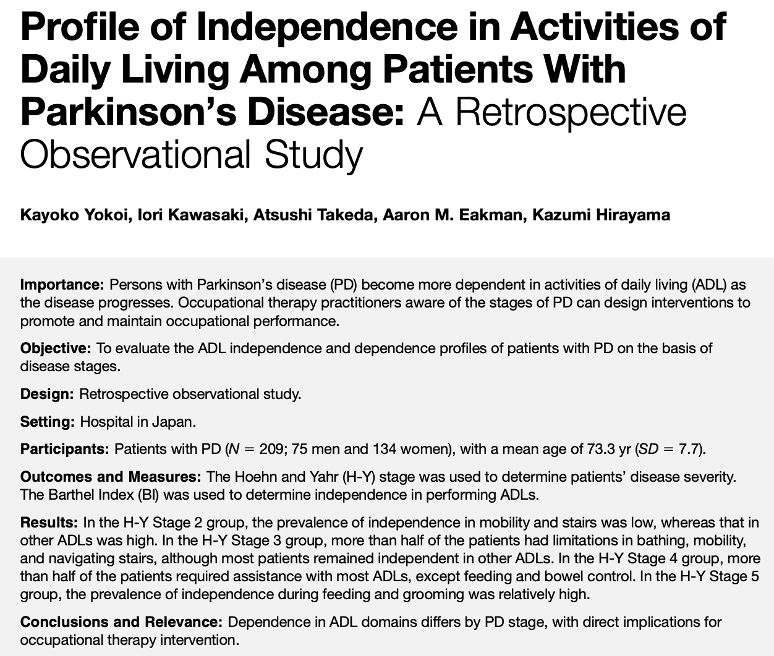
what is retrospective study and what threatens it
study that mines existing records/databases
threat»missing/inconsistent data
(cheaper, faster, larger N)
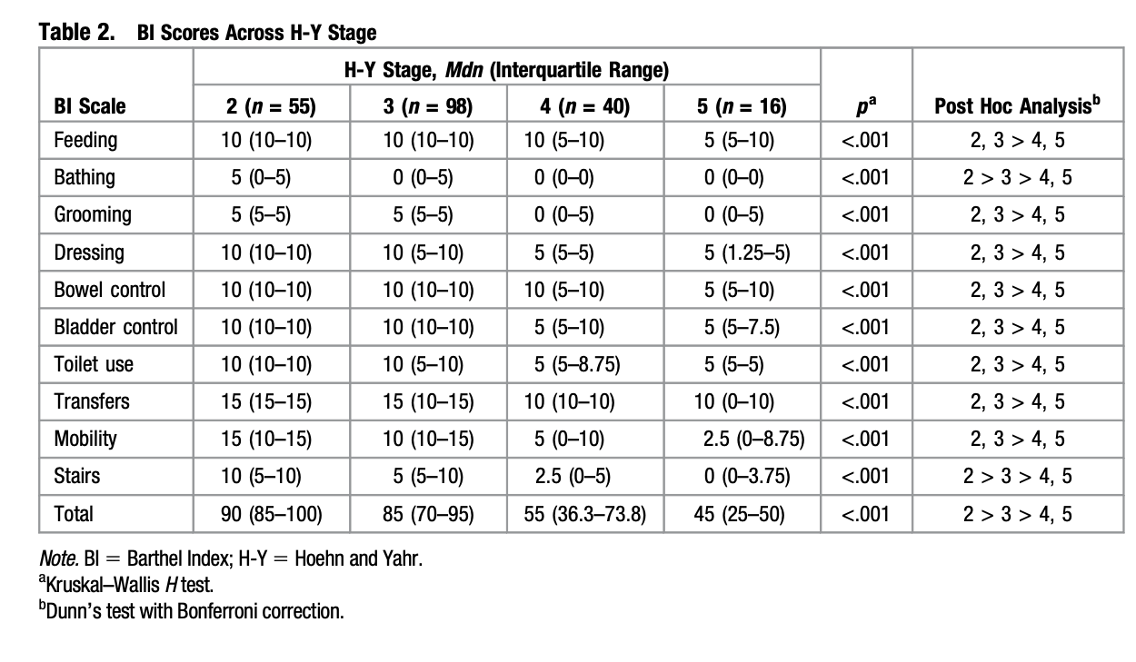
Define Cross sectional vs longitudinal
cross sectional» •data from different sources collected at same time; selection bias= biggest risk
longitudinal» •data from same source collected over period of time; watch for attrition & testing effects
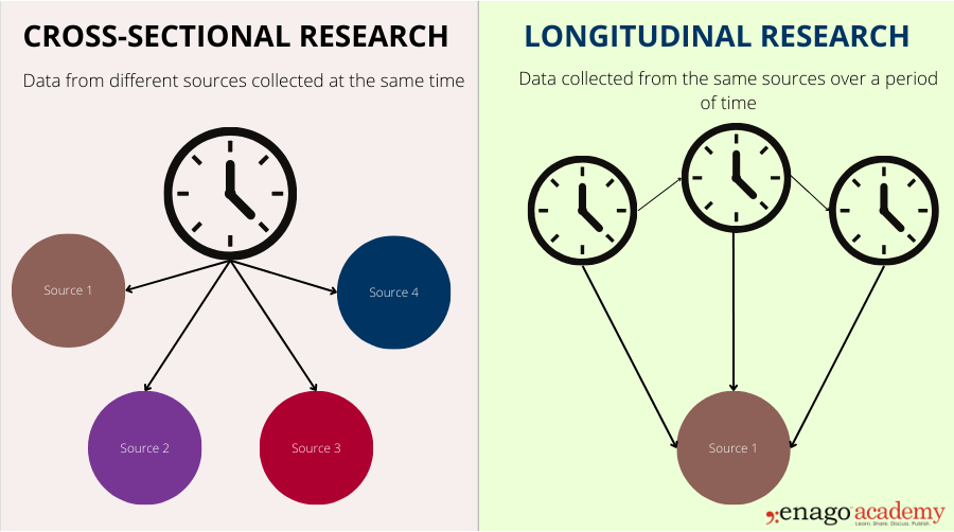
correlational study def
•strength/direction of association ®
Correlation does not equal causation
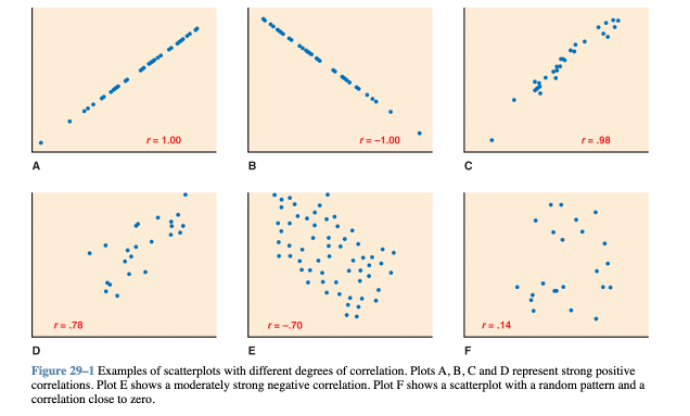
difference between the case control and cohort observational study designs
Case-control - studies start with the outcome (disease) and look backward for exposures,
cohort studies - start with the exposure and follow participants to see who develops the outcome.
what are common biases that occur
Selection bias: Participants aren't representative.
Recall bias: Participants remember past events inaccurately.
Interviewer bias: Interviewer's behavior influences responses.
Confounding: Another variable affects both exposure and outcome.
what fixes can someone do to reduce bias
Matching → balances confounders between groups.
Blinding chart reviewers → reduces reviewer bias.
Statistical adjustment → controls confounding.
Triangulation → uses multiple methods/data sources to confirm findings.
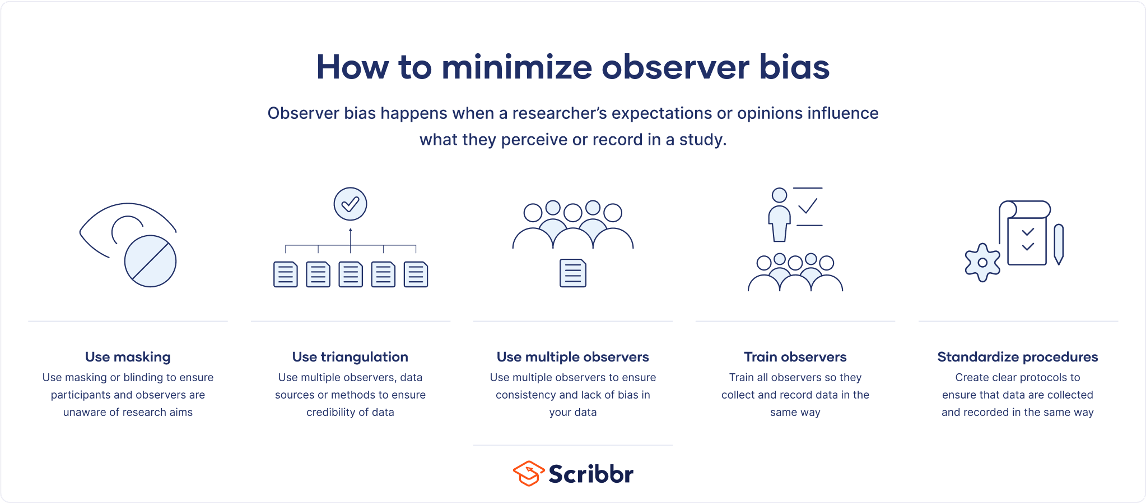
what are the single subject design core elements
Repeated measures = Measure many times, not once.
A = Baseline (no treatment).
B = Intervention (treatment).
Graph everything = Plot every data point and look for changes at the phase line.
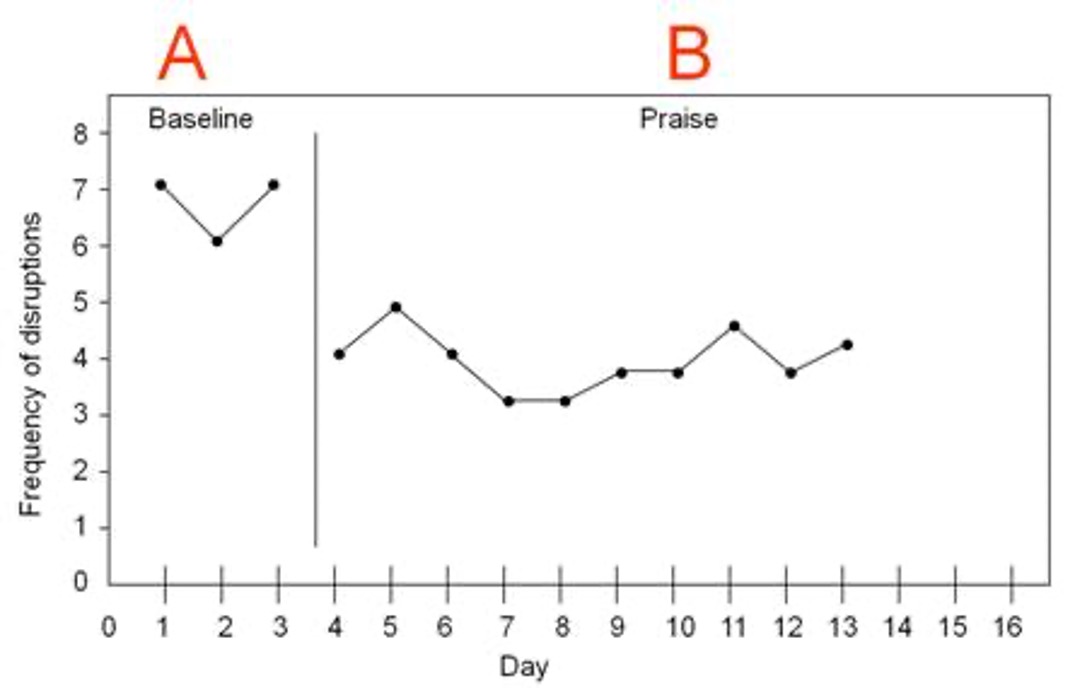
describe an A-B single study design
•Quick clinical feedback but weak internal validity : no control comparison
•Impossible for this design to claim causation
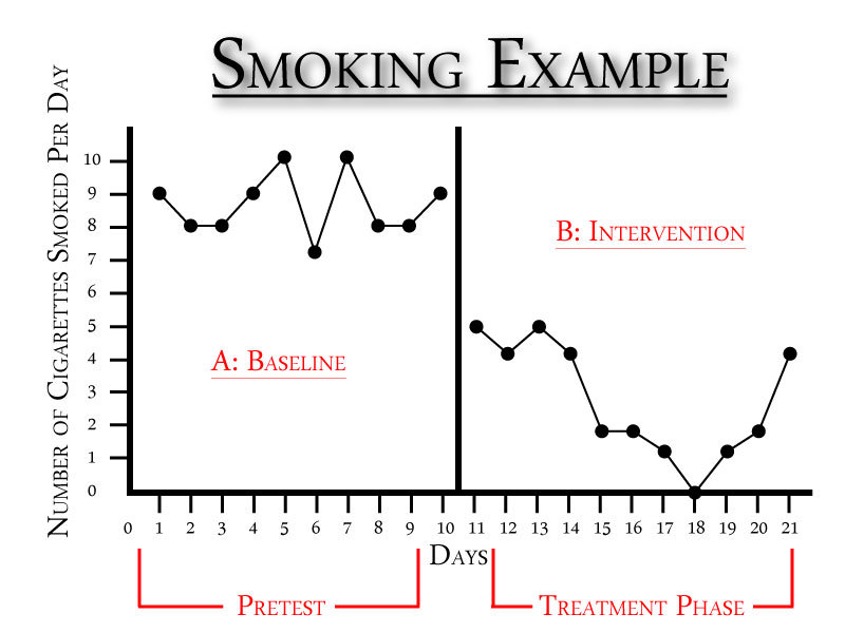
how can someone strengthen an A-B SSD
•repeat phases after return to baseline
•Effects more than one subject or more than one target outcome
• by Comparing 2+ interventions
Describe an A-B-A ssd
Shows how/if behavior reverses when treatment is removed. ( does this by adding a second baseline
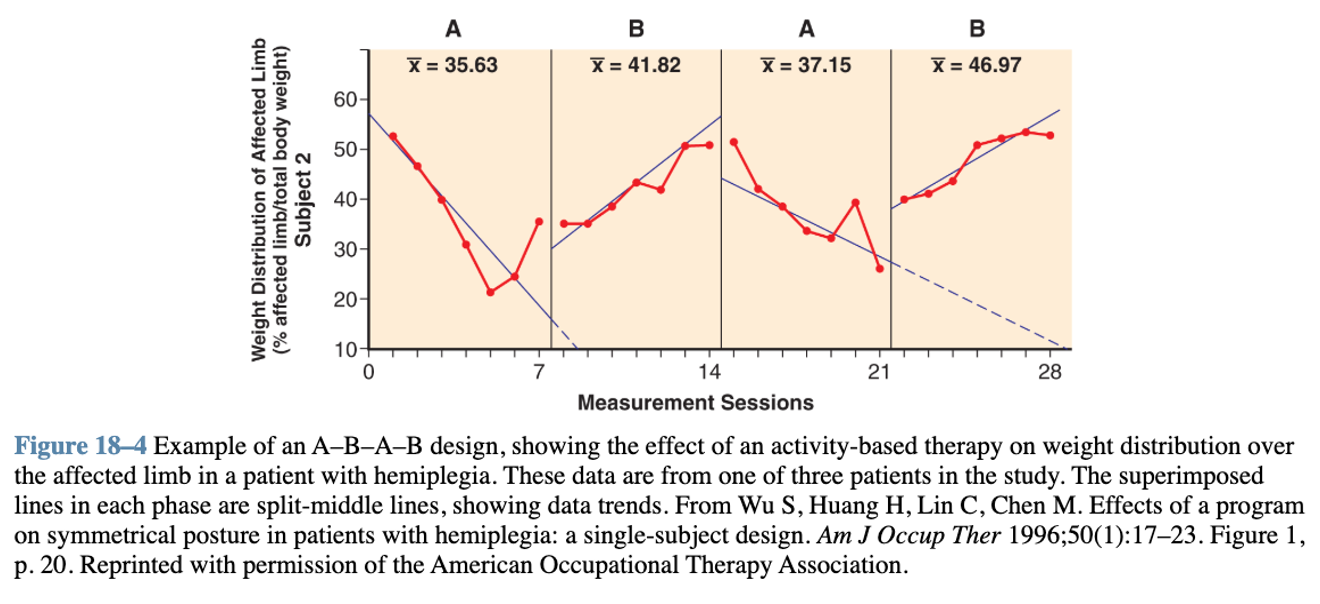
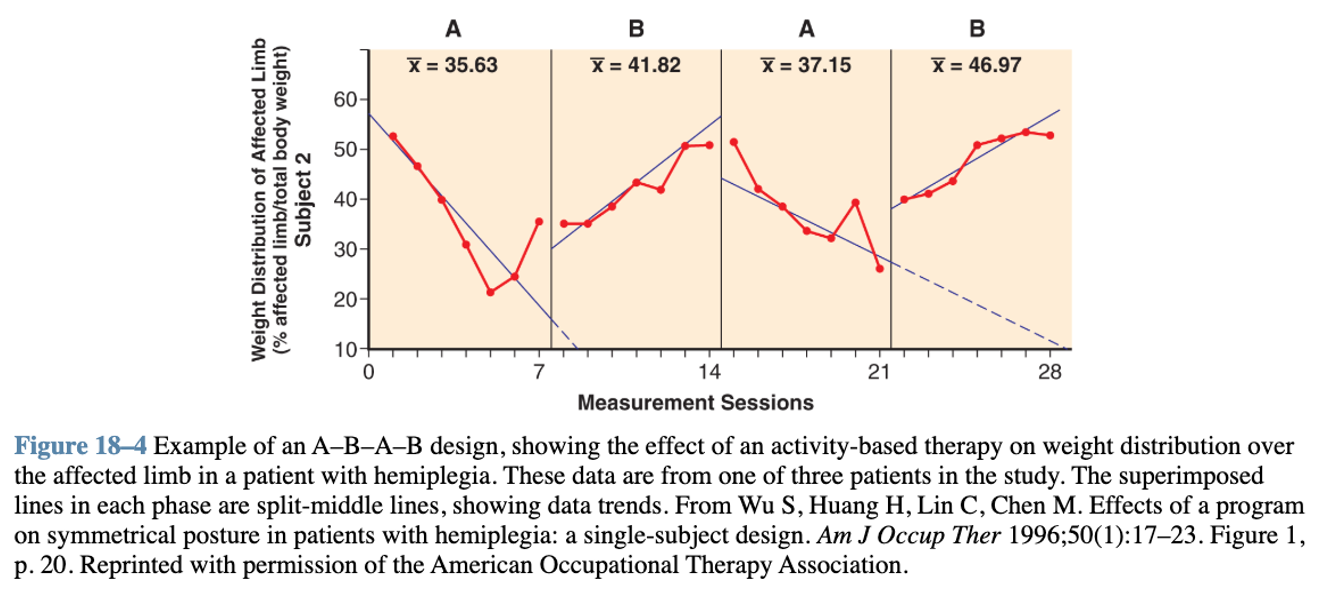
Describe an A-B-A-B ssd
GOLD STANDARD for reversible behaviors
•two chances to see effect
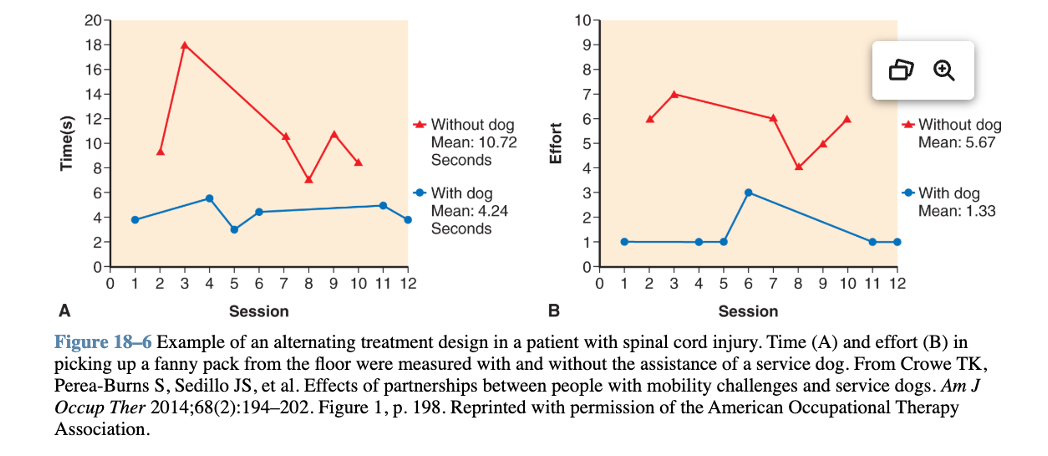
describe an alternating treatment ssd
Compares two interventions to determine which will be more effective
» also used for control and placebo treatments
describe an A-B-C-A ssd
compare two interventions sequentially after baseline
describe direct replication
Same design
Same type of participant
About 3 successful replications strengthen confidence.
describe systematic replication
Change one factor:
Different setting
Different therapist
Different age group
Shows results generalize.
external validity
transferability>
"thick" descriptions so that future researchers or practitioners can determine if the findings are applicable to them own specific settings or contexts.