Biostats unit 2
1/49
There's no tags or description
Looks like no tags are added yet.
Name | Mastery | Learn | Test | Matching | Spaced |
|---|
No study sessions yet.
50 Terms
Probability distribution
a statistical function that describes all the possible values and likelihoods that a random variable can take within a given range.
Combination
If a set consists of n objects, and we wish to form a subset of x objects from these n objects, without regard to the order of the objects in the subset
Nonnegative function
a probability distribution (sometimes called a probability density function) of the continuous random variable X if the total area bounded by its curve and the x -axis is equal to 1 and if the subarea under the curve bounded by the curve, the x -axis, and perpendiculars erected at any two points a and b give the probability that X is between the points a and b.
Sampling distribution
The distribution of all possible values that can be assumed by some statistic, computed from samples of the same size randomly drawn from the same population
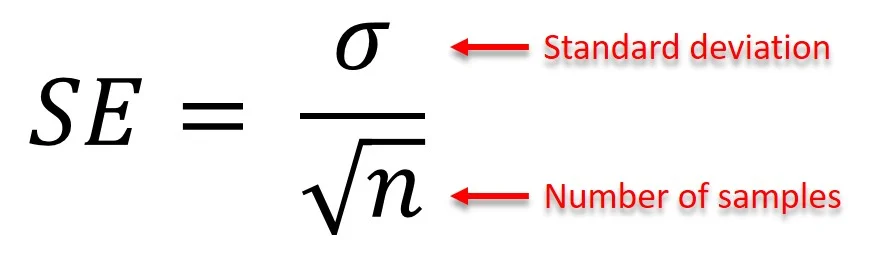
Standard error
The square root of the variance of the sampling distribution
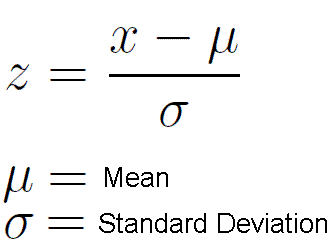
-use SE for sample means ) —> Z=x-u/SE
Statistical inference
1) allows us to answer probability questions about sample statistic
2) Provide necessary theory for making the statistical inference procedures valid
the procedure by which we reach a conclusion about a population on the basis of the information contained in a sample drawn from that population.
Point estimate
a single numerical value used to estimate the corresponding population parameter.
-the point estimate of the population mean is the sample mean
Interval estimate
consists of two numerical values defining a range of values that, with a specified degree of confidence, most likely includes the parameter being estimated.
Sampled population
the population from which one actually draws a sample.
Target population
the population about which one wishes to make an inference.
p hat (p̂)
sample proportion
p
population proportion
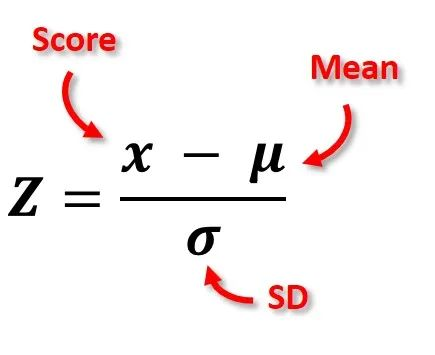
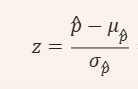
Z score equation
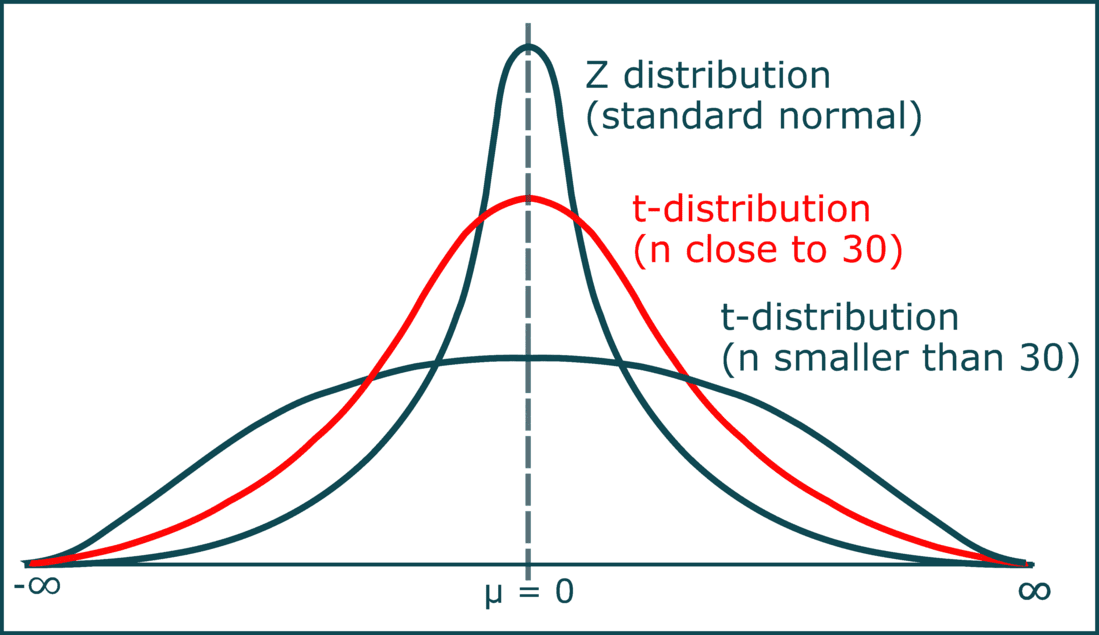
T-distribution
a continuous probability distribution that generalizes the standard normal distribution. Like the latter, it is symmetric around zero and bell-shaped.
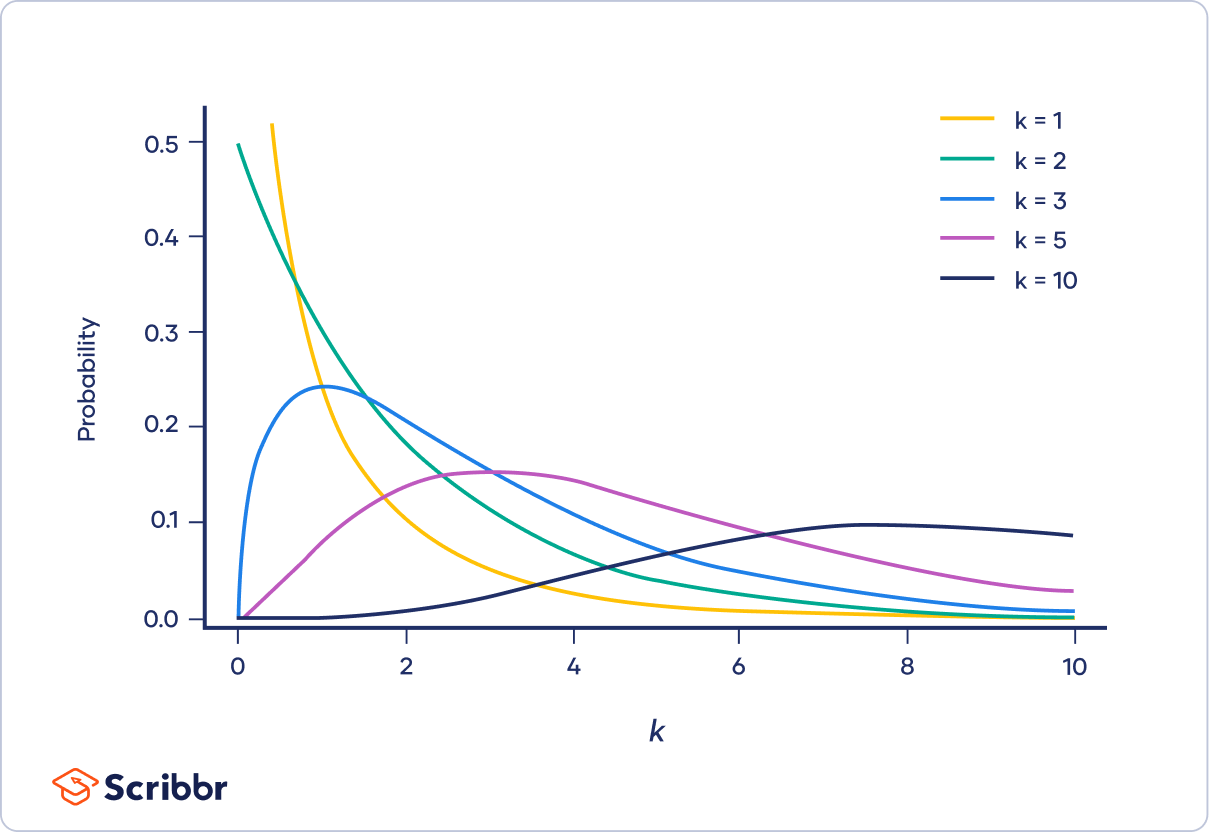
Chi square distribution
used for variances and frequencies
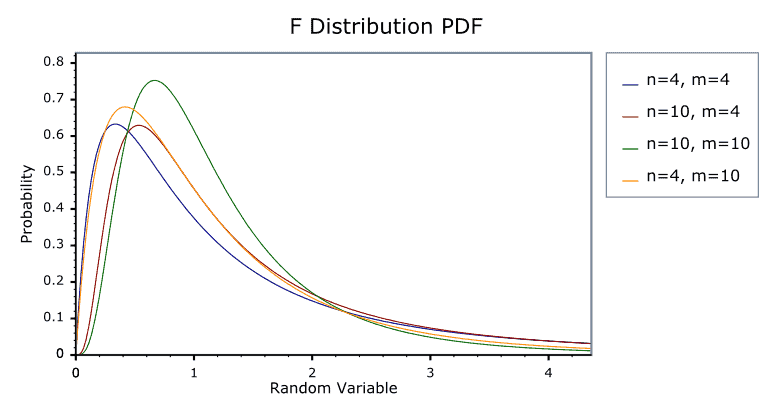
F-distribution
used for inferences on 2 unknown population variances
Estimator
unbiased if the expected value of the estimator is the value of the population parameter
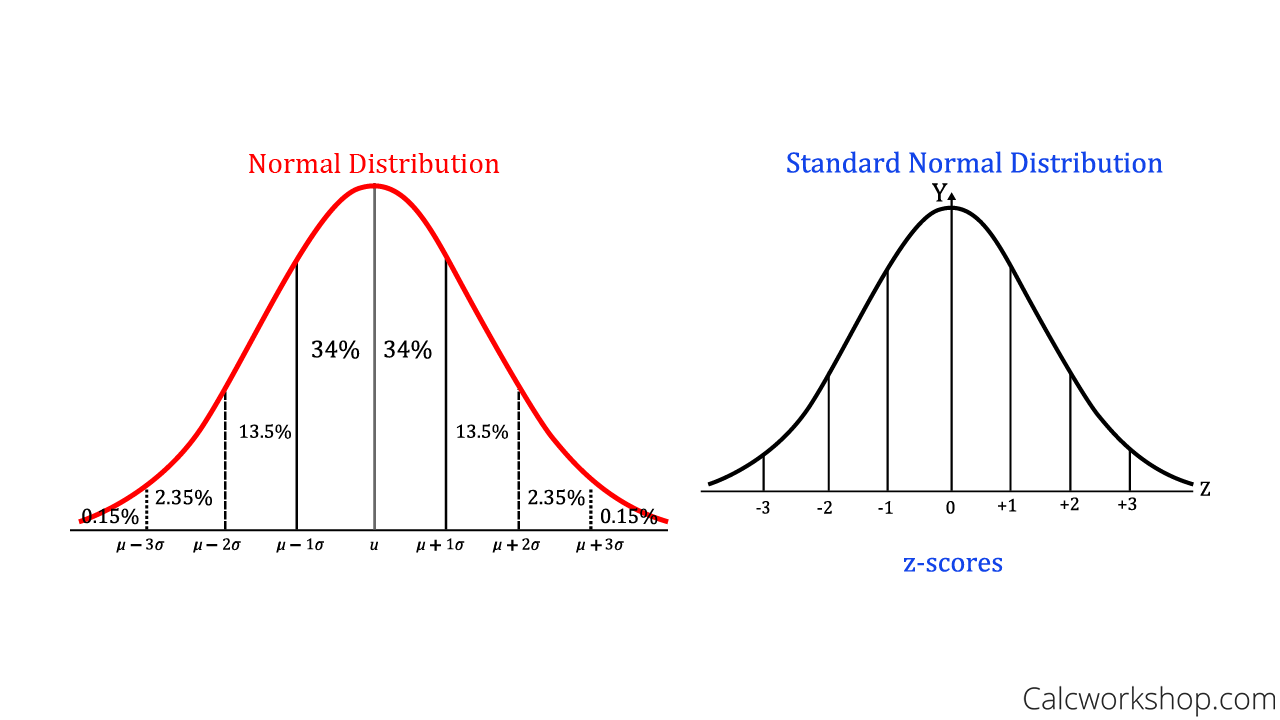
Normal curve
If P(z ≤ z₁) < 0.5 → Left side of the curve → Negative z1
If P(z ≤ z₁) > 0.5 → Right side of the curve → Positive z1
If P(z ≤ z₁) = 0.5 → z1=0 (exactly at the mean).
Mean symbol for pop

Standard deviation symbol
Z-score formula
o=for single data point
SE=for sample mean
Probability of success symbol
π
Probability distribution
All probabilities (P(X=x)) must be non-negative.
The total sum of probabilities (∑P(X=x)) must equal 1.
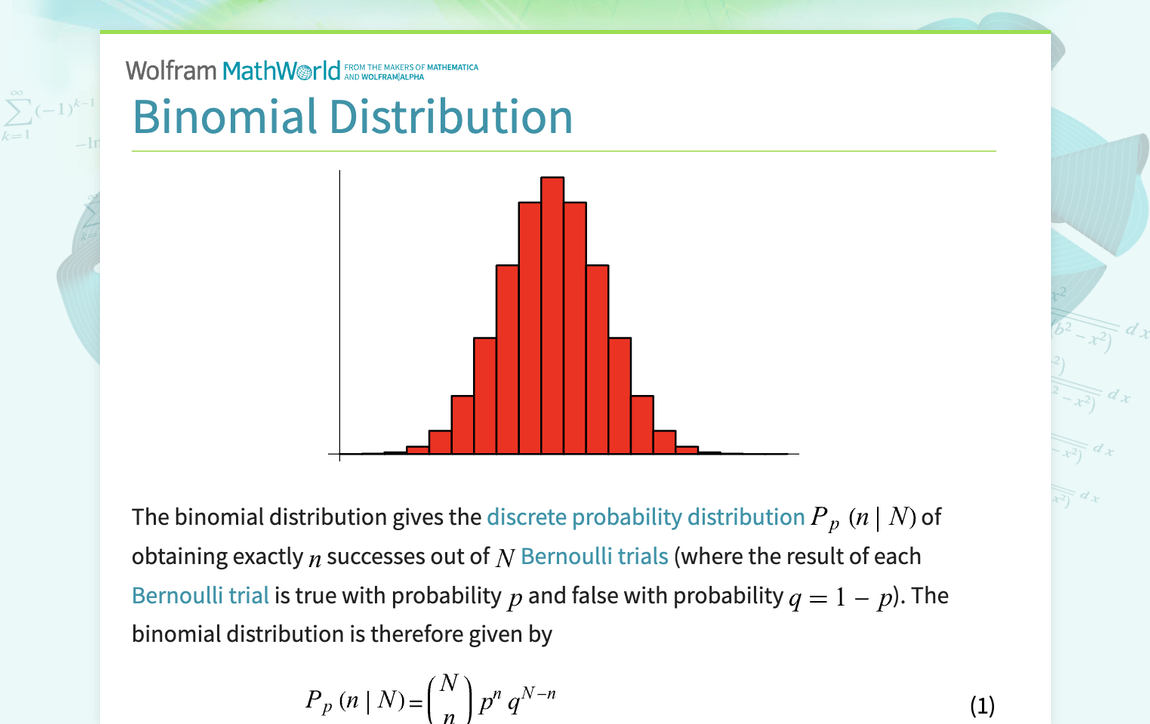
Bernoulli trial
When a random process or experiment called a trial can result in only one of two mutually exclusive outcomes (like heads or tails, dead or alive, sick or well)
The Bernoulli process
1) Each trial results in 1 of 2 possibly mutually exclusive outcomes one is denoted success and the other is failure
2) The probability of success, denoted by p, remains constant from trial to trial. The probability of failure is 1-p and if often denoted by q
3) The trials are independent, that is the outcome of any particular trial is not affected by the outcome of any other trial
Combinations
When order does not matter, those subsets are
Permutation
When order does matter, the arrangement is called
Binomial distribution
applies to an infinite or finite population where the sampling is done with replacement
Continuous random variable
one that can assume any value within a specified interval
Exp: weight, height, amount of drug in system, amount of HDL in blood
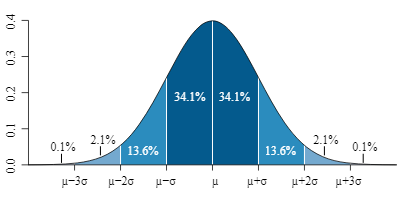
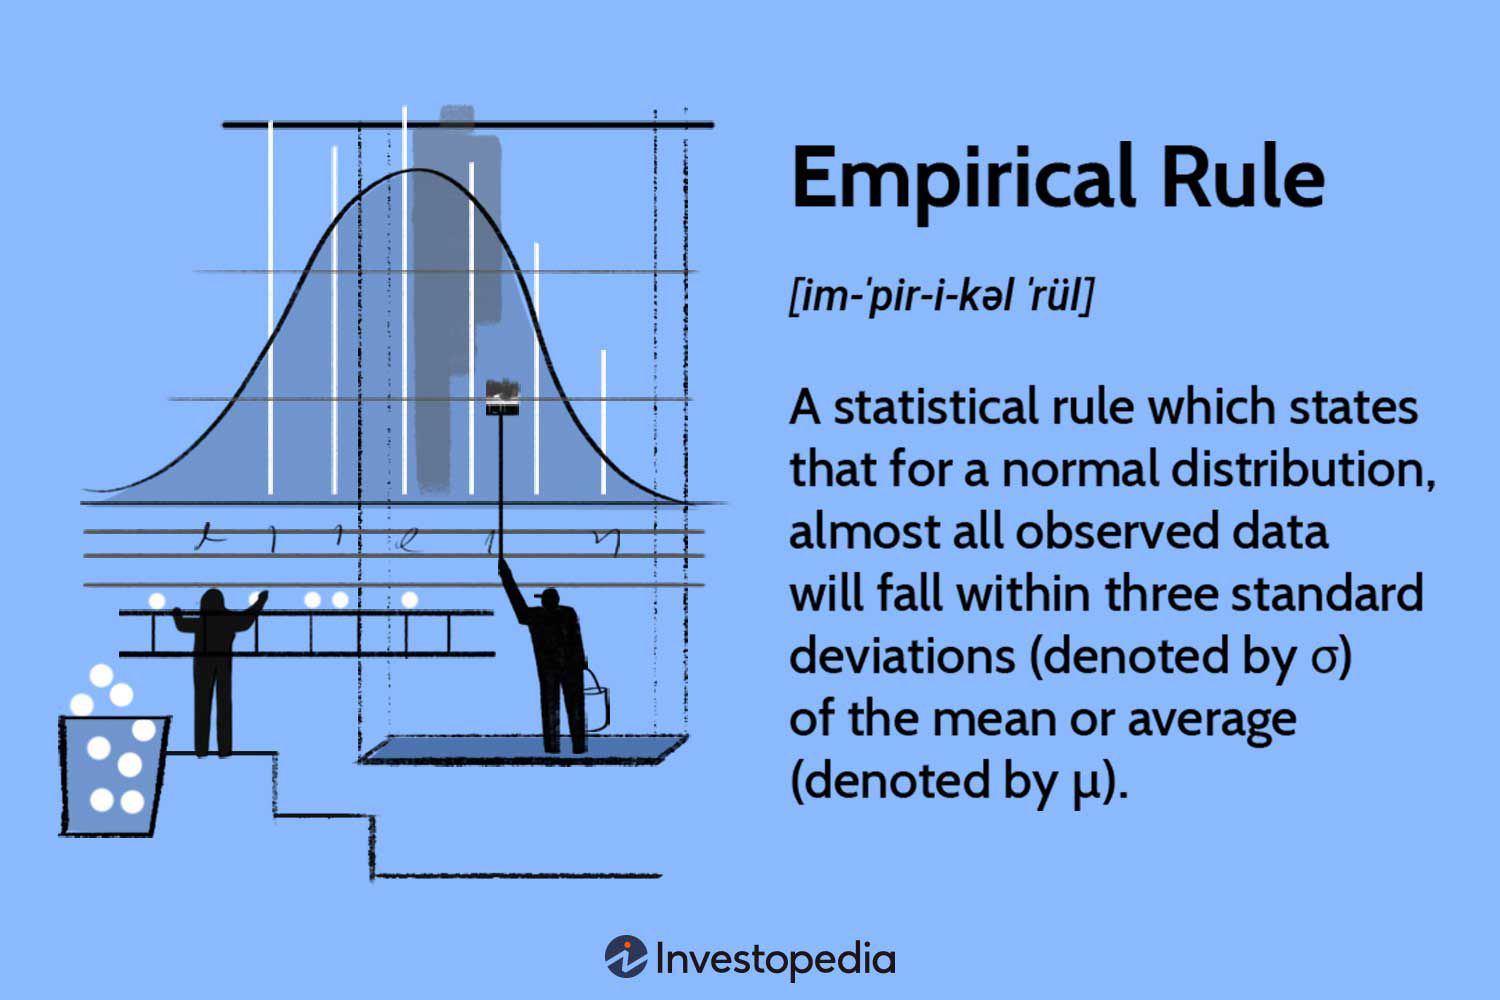
Normal distribution
1) Symmetric about mean
2) Mean=median=mode
3) Total area under curve above the x-axis is 1 sq-unit (since it’s a probability distribution) since it is symmetric 50% of the area is to left of the mean & 50% of the area is to the right of the mean
4) If we draw perpendicular lines 1 standard dev. on either side of the mean, the the area enclosed is about 68%. If we go out 2 standard dev. on each side we encompass about 95%
If we go out 3—> we get 99.7% of the area
(n)(p) >= 5
n(1-p) >=5
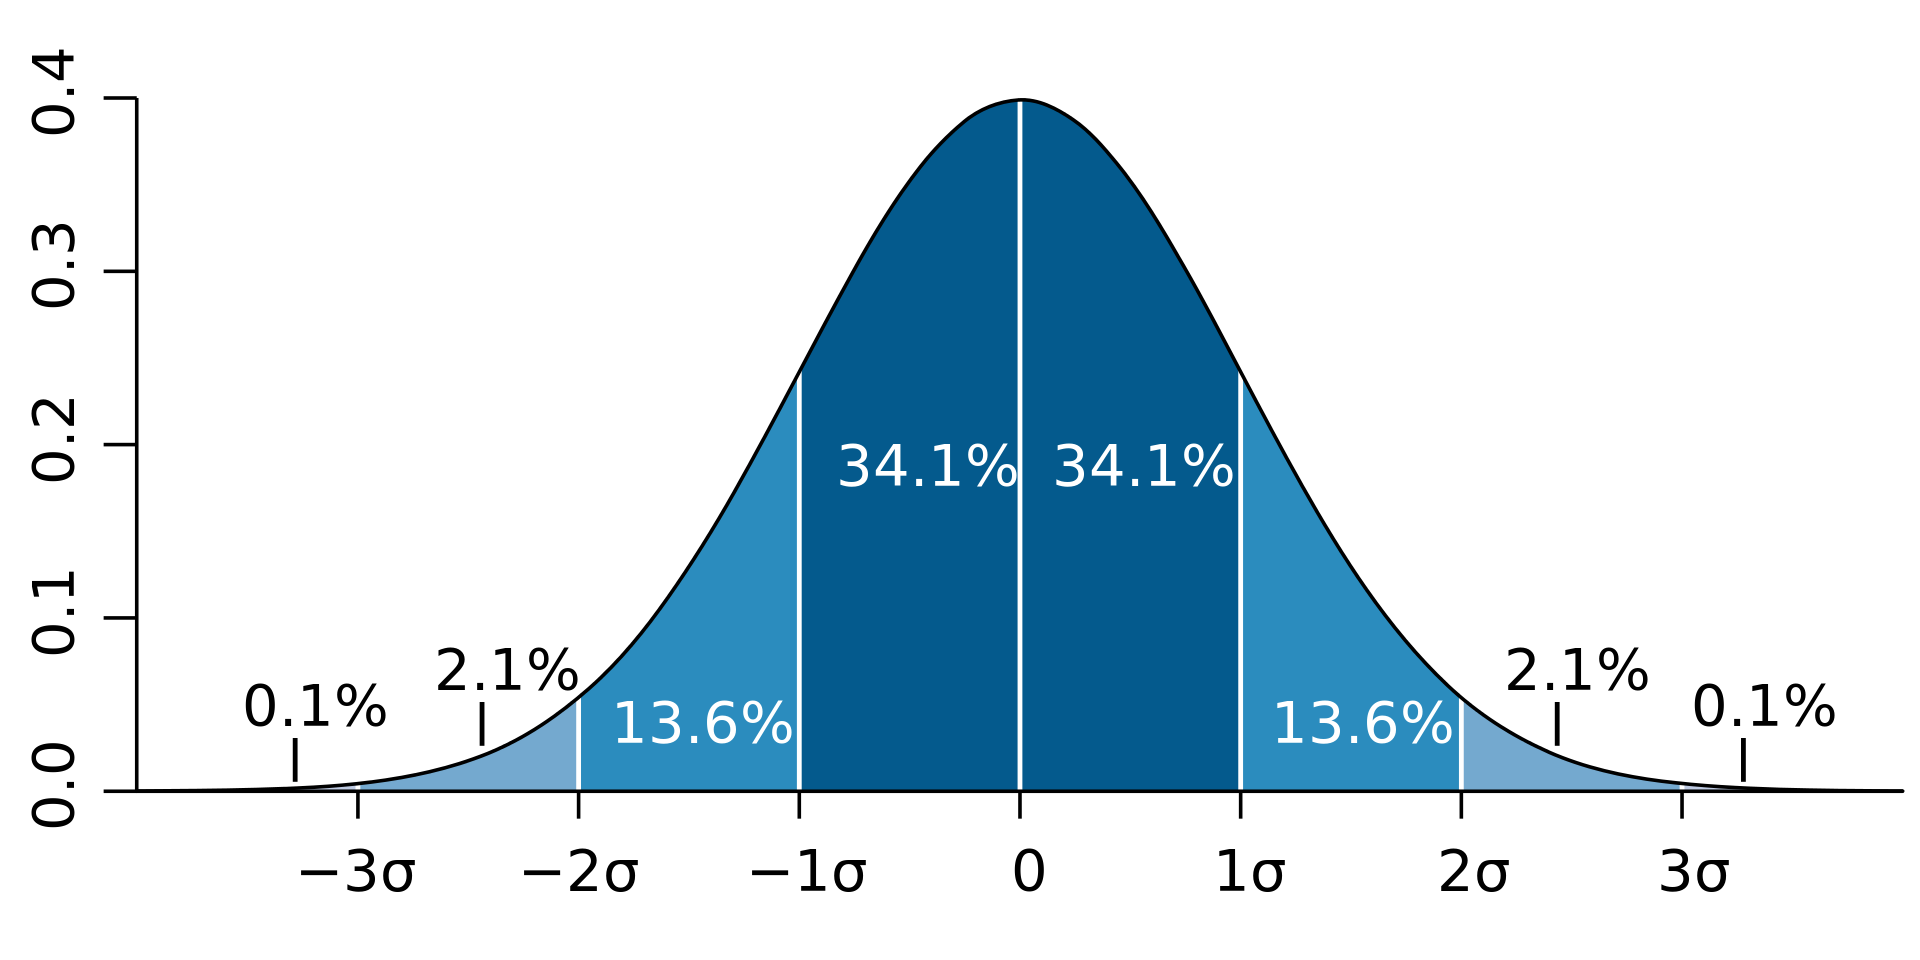
Empirical rule
-Completely determined by its parameters
-u determines location/center, the horizontal position number line
-o determines spread/width of the bell, how narrow/wide the bell is
-the smaller the value of sigma, the narrower the bell and vice versa
Sample proprtion
p hat
How do we create a sampling distribution of a discrete finite population?
1) From the finite pop of size N, randomly draw all possible samples of size n
2) Compute the sample statistic for each sample
3) Create a frequency distribution with the first column being the distinct values of the sample statistic and the second with the frequencies of these values
Discrete variable
a type of variable that can only take specific, separate values. Think of it as something you can count—like the number of books on a shelf, the number of people in a room, or the number of cars in a parking lot. You can't have half a car or 2.7 people, so the values are distinct and not continuous.
Central Limit Theorem
when you take a large enough sample from any population (no matter its shape), the distribution of the sample means will tend to look like a normal distribution (bell-shaped curve), even if the original population isn’t normally distributed. The sample means will have the same average (μ\mu) as the population and a smaller spread (standard error).
It’s the reason we can use normal distributions to make predictions and draw conclusions in statistics!
.90
1.645
.95
1.96
.99
2.576
Convert to Z-score
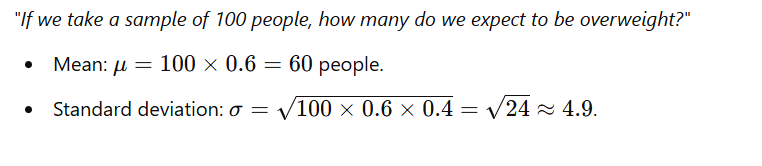
Working with counts
If you're counting how many individuals, use n×p and square root of np (1-p)
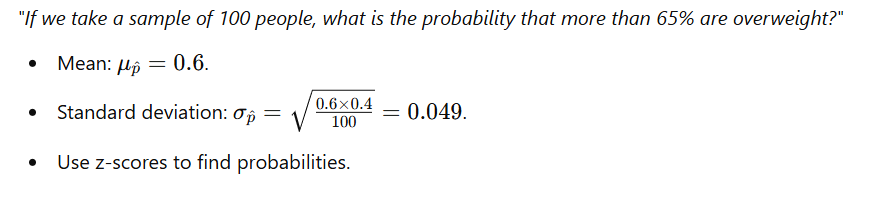
Working with proportions
If you're looking at the proportion of a sample, use p and square root of p(1−p)/n
Sample mean
x bar

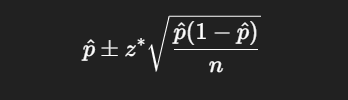
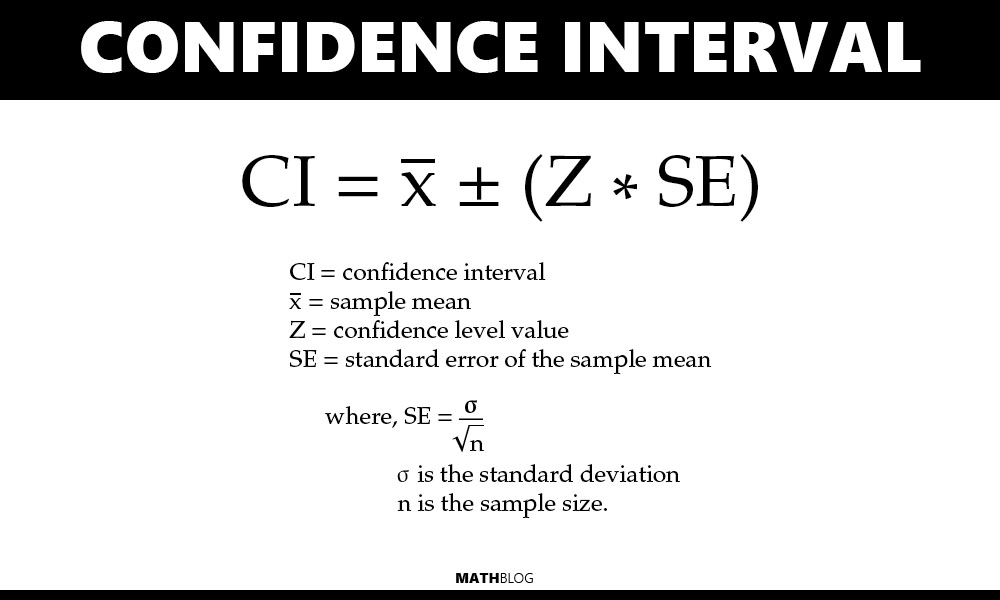
Confidence interval equation
Degrees of freedom
df=n-1
T distribution vs. Z distribution
Use a z-distribution when:
The population standard deviation is known:
You can calculate a z-score because you have precise information about the population's standard deviation.
For example, in quality control analysis, population parameters are often known.
Sample size is large:
Typically, n>30n > 30 is considered large enough for the Central Limit Theorem to apply, making the z-distribution appropriate.
Data is normally distributed or approximately normal:
Z-distributions assume normality and are suitable when the data meets this condition.
Use a t-distribution when:
The population standard deviation is unknown:
You use the sample standard deviation as an estimate, which introduces variability. The t-distribution accounts for this.
Sample size is small:
When n≤30n \leq 30, the t-distribution is more appropriate because smaller sample sizes are more prone to variability.
Data is normal or approximately normal:
Like the z-distribution, the t-distribution assumes normality but is more forgiving for small samples.
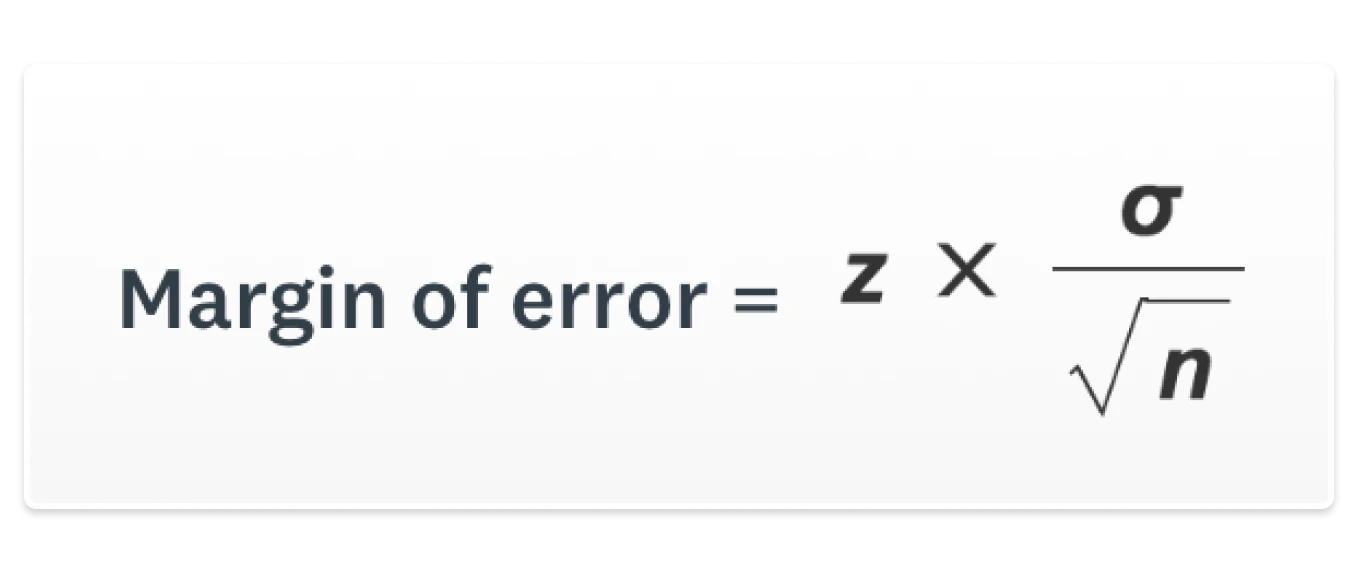
Precision of the estimate
-refers to margin of error
Variance of a binomial distribution
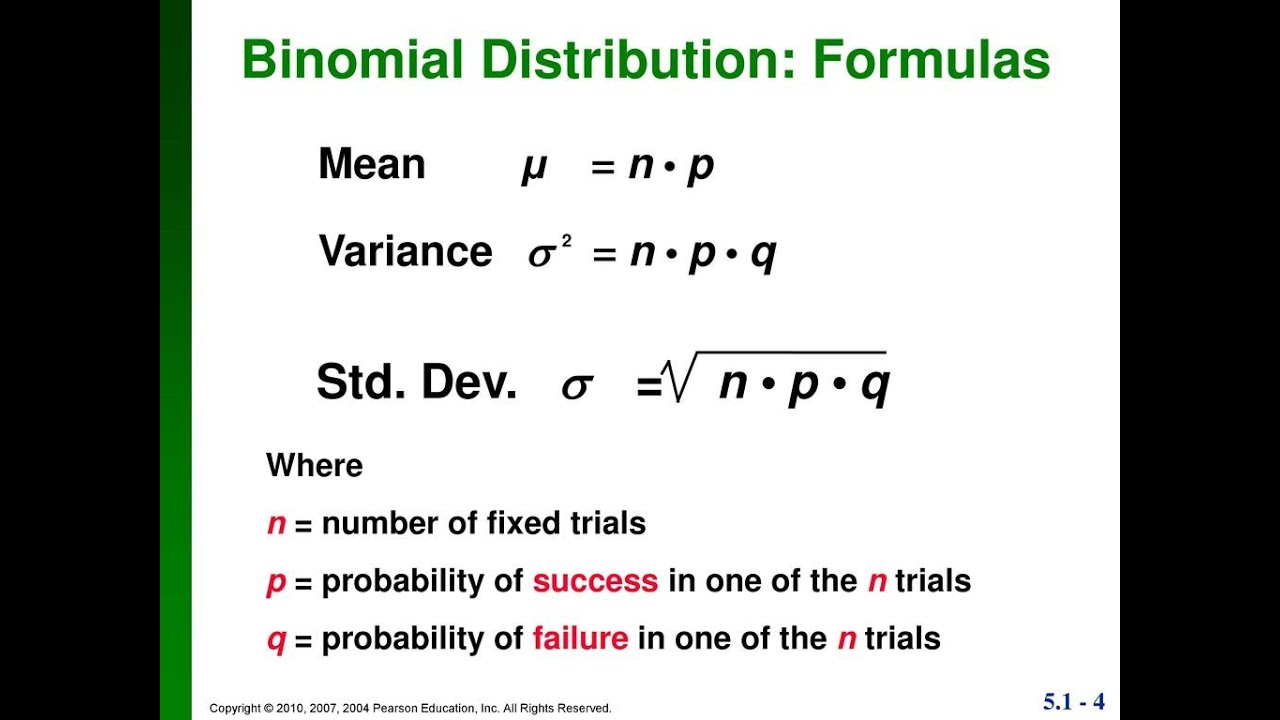
Expected value
E(x) = (n) (p)
When the sample size decreases…
the margin of error increases, which causes the confidence interval to widen.
Confidence interval for proportion