Chapter 27: The Impact of Climate Change on Ecological Systems
1/65
There's no tags or description
Looks like no tags are added yet.
Name | Mastery | Learn | Test | Matching | Spaced | Call with Kai |
|---|
No analytics yet
Send a link to your students to track their progress
66 Terms
Global climate change is
redundant
-----------------
WHY?
- change is inherent in Earths climate system
-----------------
EXAMPLES:
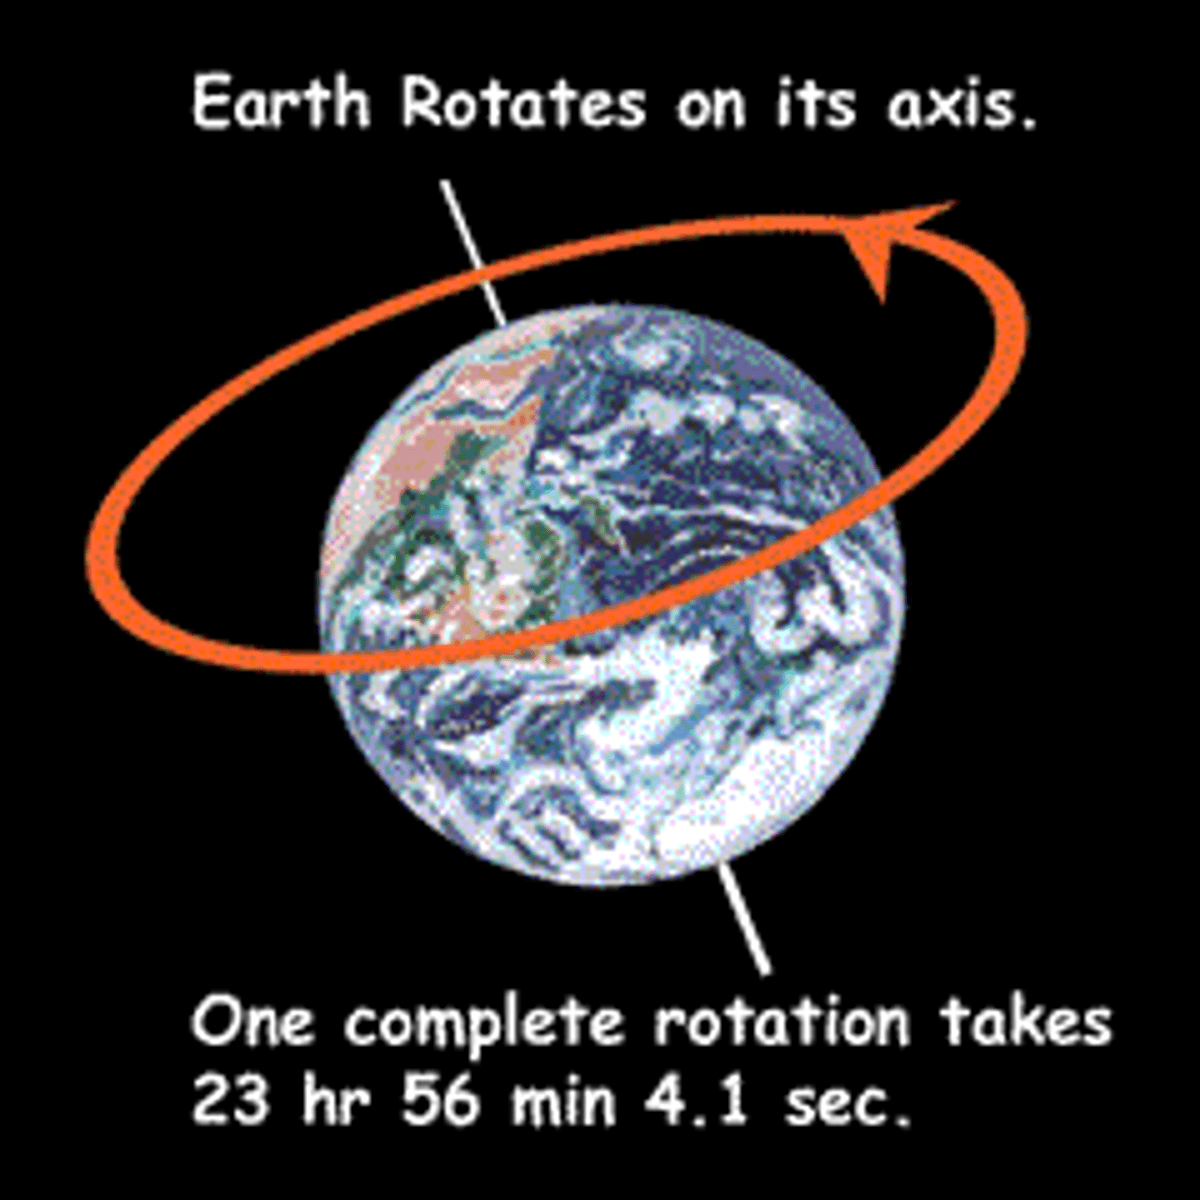
-Earths rotation
Earth's rotation
The amount of tilt in Earth's rotation affects the amount of sunlight striking the different parts of the globe, influencing patterns of global climate.
-----------------
FEATURES/FACTS
- responsible for the ice age
- tilt of Earth's axis varies from 22.1° to 24.5° during a cycle of 41,000 years
Industrial revolution began
the burning of fossil fuels
-----------------
RESULTED TO
- an exponential increase in the concentration of CO2 and other greenhouse gases in the atmosphere
(cause of warming over the past centuries)

Earth's climate has warmed
by an estimated 0.74°C over the past century
-----------------
FACTS:
The rate of warming during the latter period of the century has been approximately double that of the first, and it is believed to be greater than at any other time during the last 1000 years.
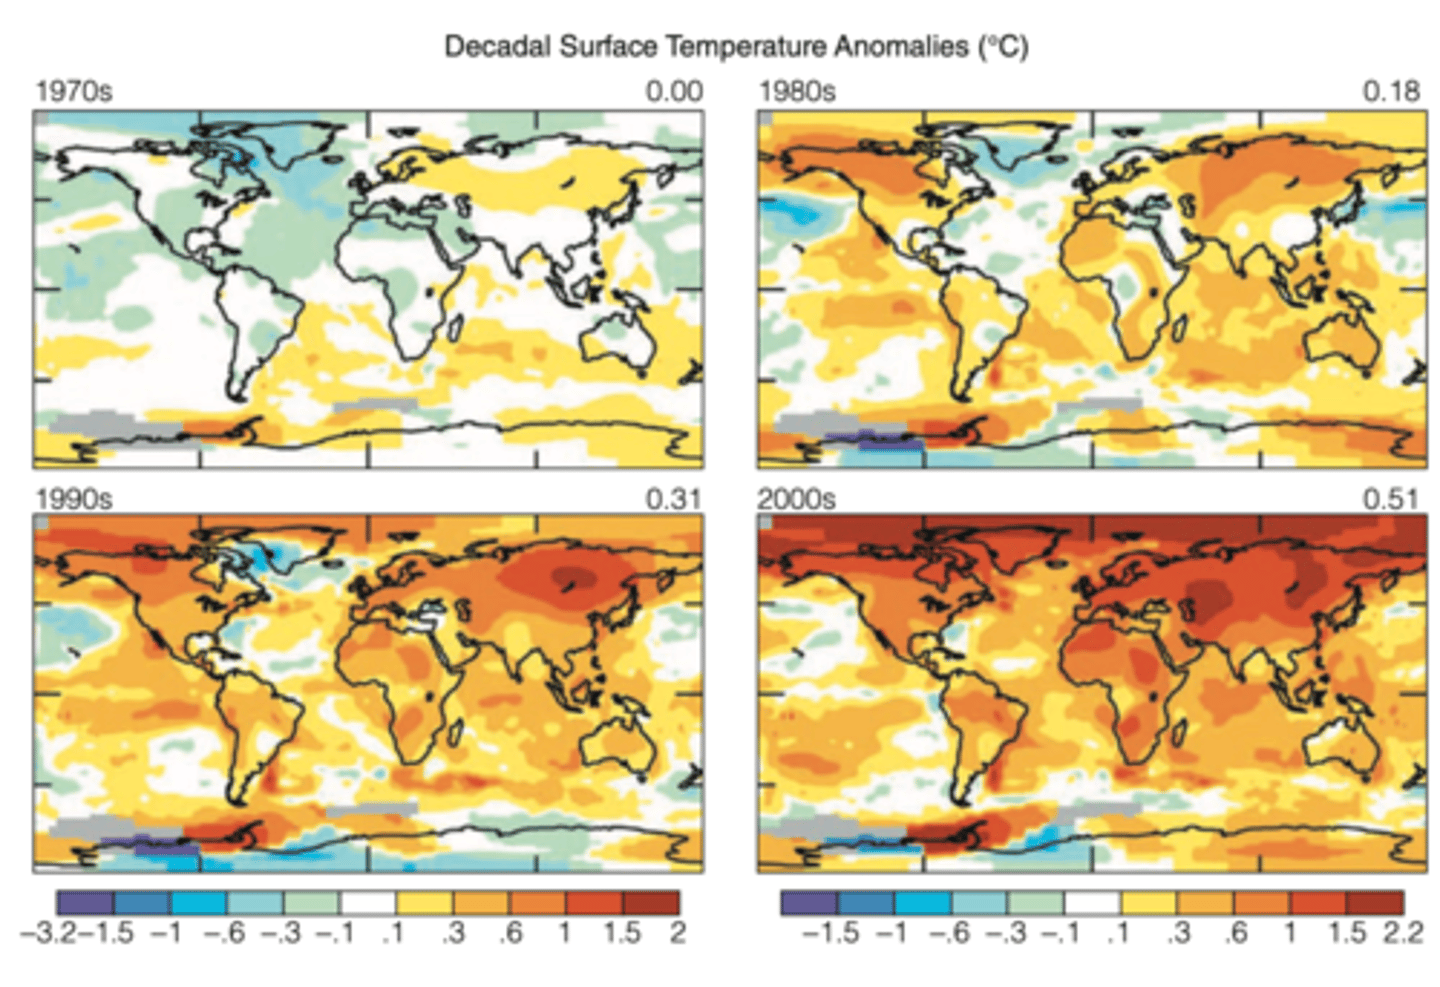
Changes in temperature
have not been distributed equally across the Earth's surface
-----------------
FACTS:
- the regional changes have been highly heterogeneous
- the greatest warming has occurred in the polar regions
Why does the polar regions have the greatest warming?
a lot more water mass in the South Pole which has an effect on the North Pole
Temperature changes throughout the seasons
- the winter months show the greatest warming
- diurnal temperature ranges have decreased
- Minimum temperatures have risen twice as fast as maximum
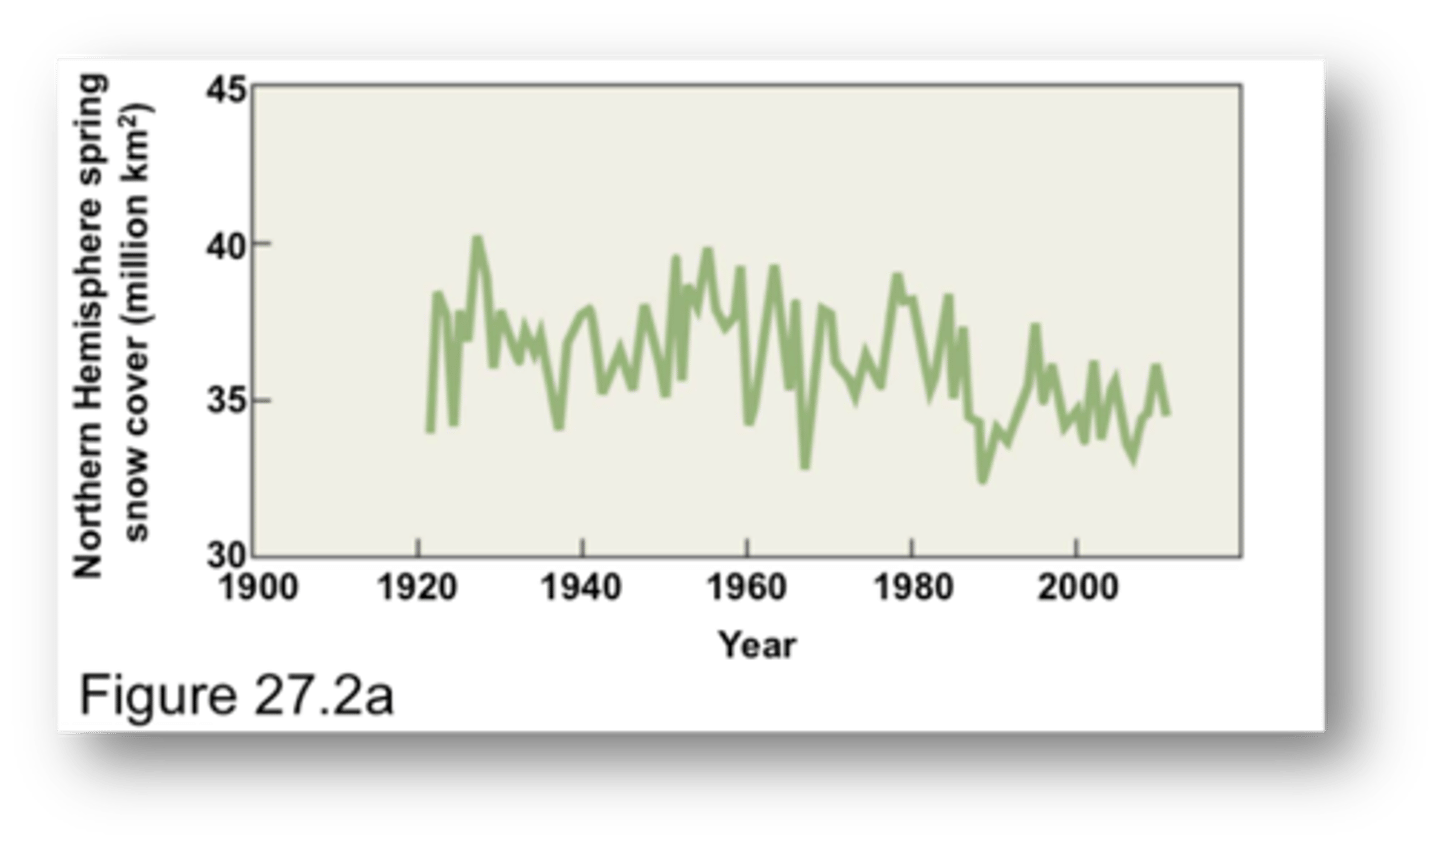
Changes in Earth's surface energy balance and associated warming have influencd
features of the global climate system in addition to surface temperatures.
- satellite data reveals a 10% decrease in snow cover and ice extent since the late 1960s
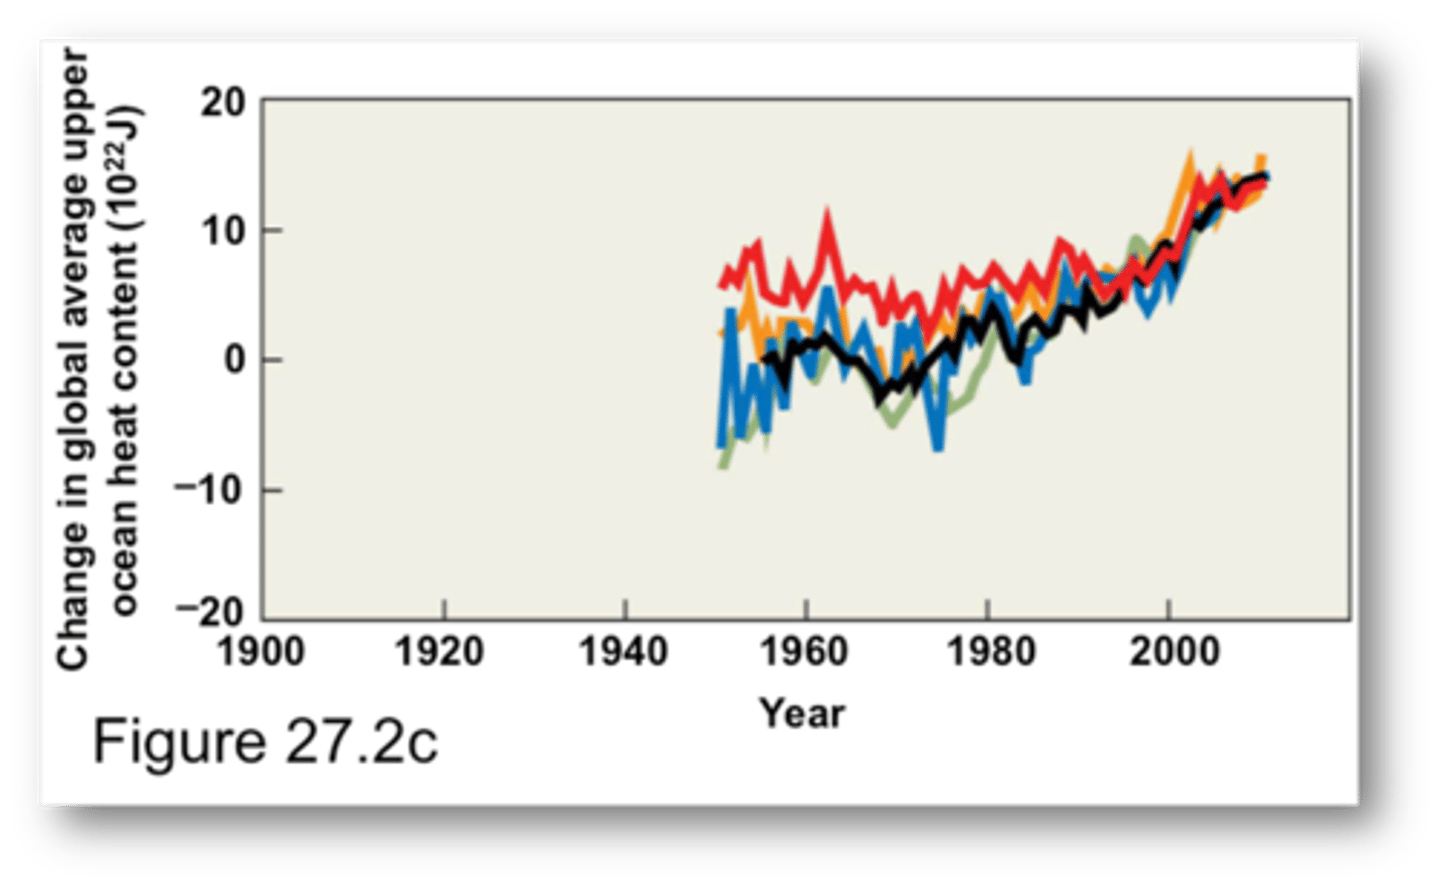
Changes have not been limited to the land surface
Since 1961 the avg. global ocean temperature has increased to a depth of at least 3000 meters
-----------------
- the ocean has been absorbing more than 80% of the heat added to the climate system
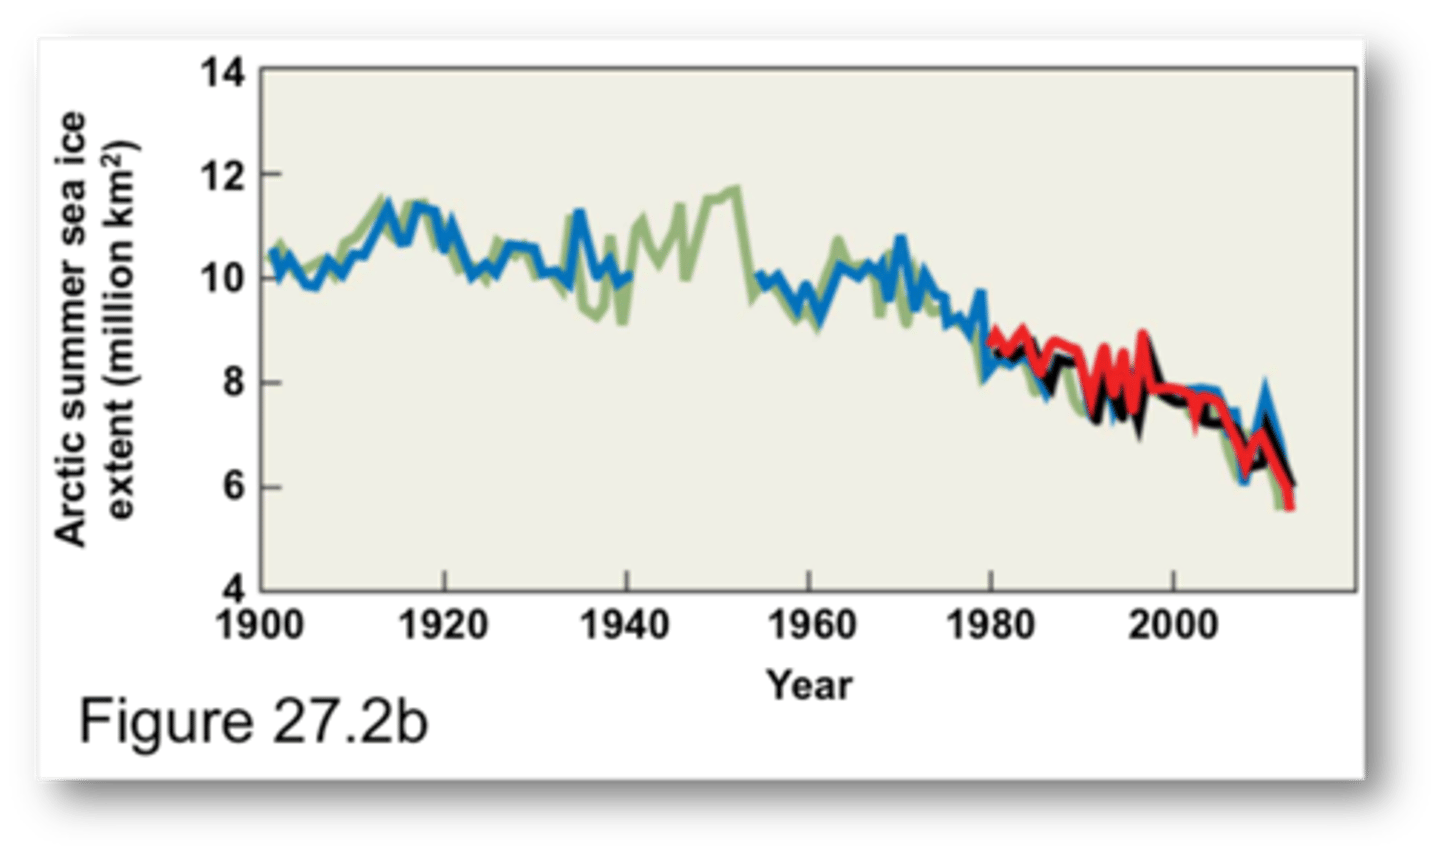
Warming of the ocean surface has
been largest over the Arctic Ocean where satellite data since 1978 show the annual average Arctic sea ice extent has shrunk by 2.7% per decade
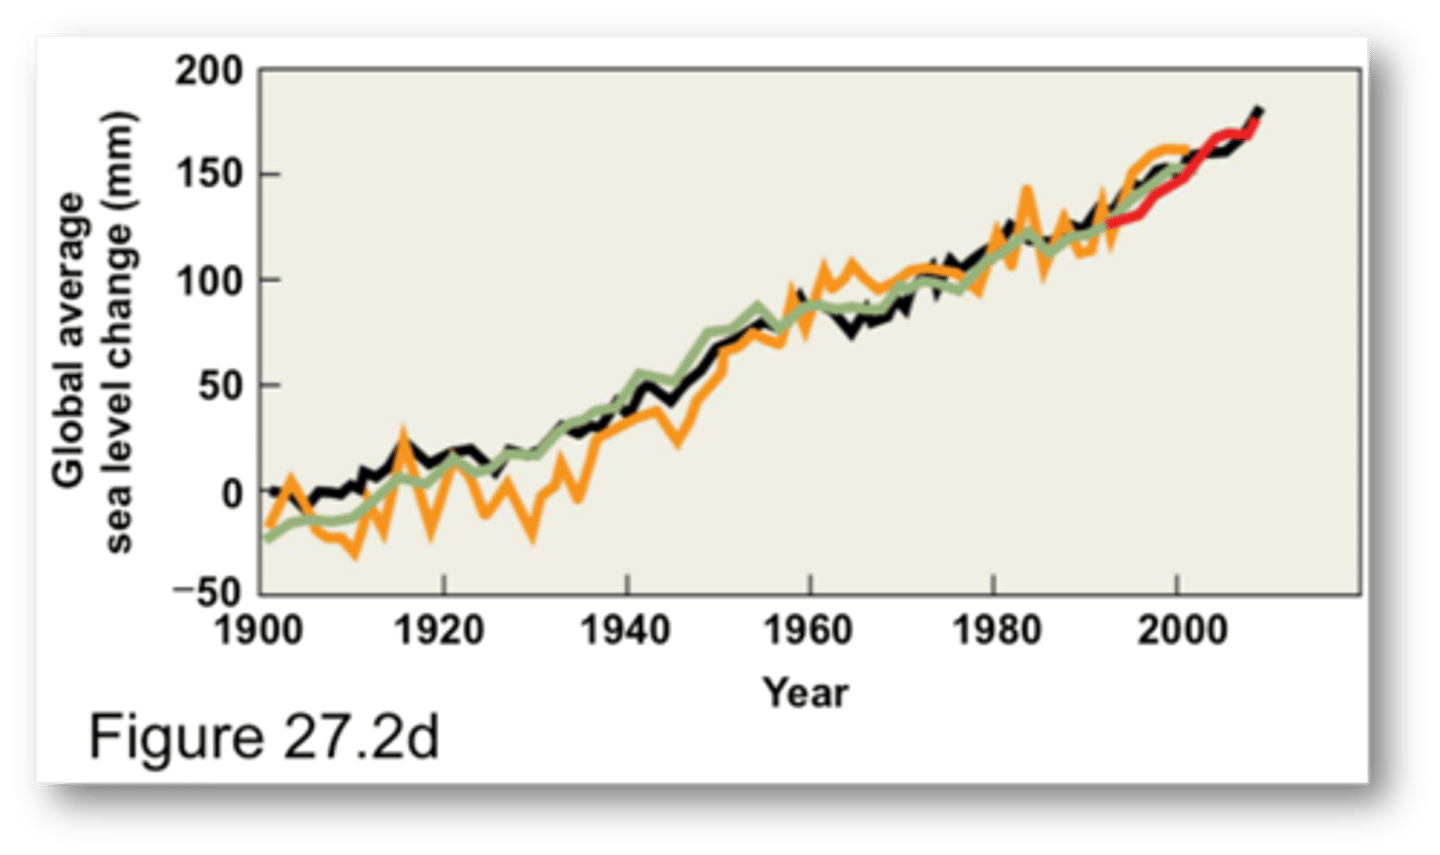
the ocean warming has caused
seawater to expand, contributing to sea level rise
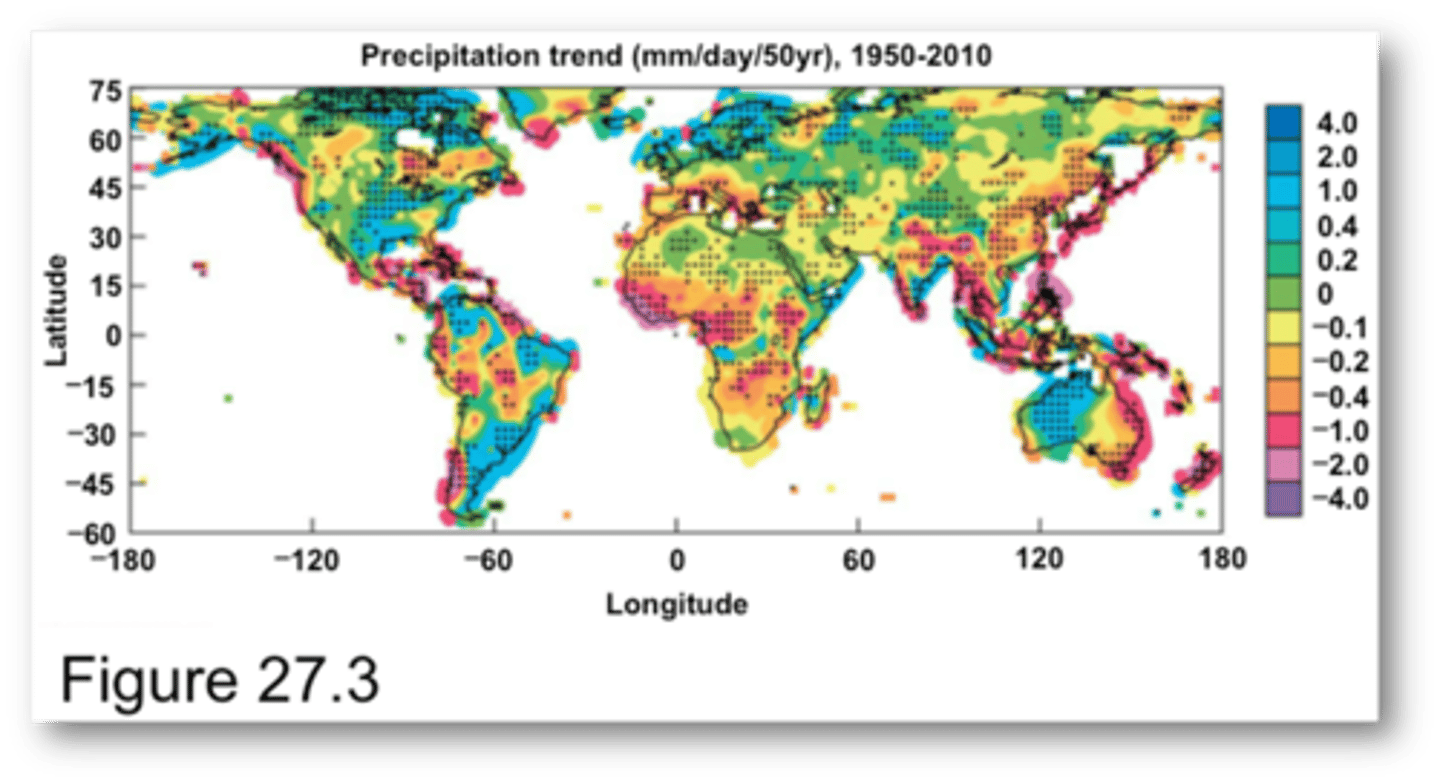
Changes in the precipitation have also
been neither spatially nor temporally uniform
Endotherms
thermoregulation process of maintaining body temperature through internally generated metabolic heat
-----------------
FACTS:
- have a generally constant body temperature
Ectotherms
thermoregulation process of maintaining body temperature through the exchange of thermal energy with the surrounding environment
Environmental temperatures
affect heat exchange with the environment
-----------------
TREND WITH BODY SIZE:
- the larger the body more difficult to cool down
Geographic trend for average boy size (Endothems)
body size to increase with decrease mean annual temperature (or increasing latitude)
-----------------
EXAMPLE STUDY:
- in both birds and mammals, a smaller body size is more energetically efficient in a warm climate
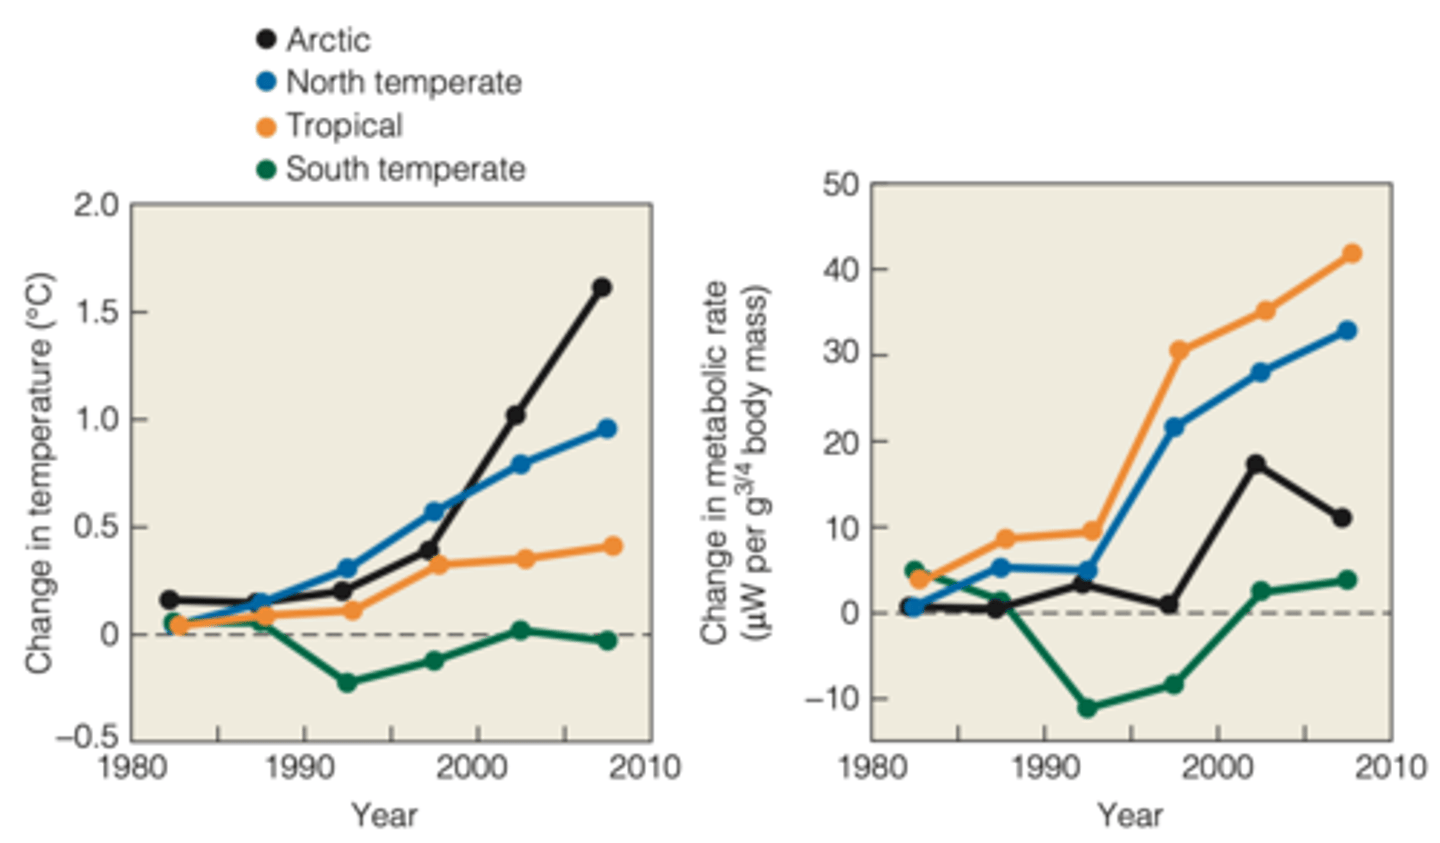
Environmental changes for Ectotherms
have a direct effect on body temperature and metabolic rates

If higher temperatures near the upper terminal tolerance limit of a species, then
further warming could exceed that limit
-----------------
EXAMPLE STUDY:
- M. Dillon published data on a diverse array of ectothermic animals to derive general metabolic rates from global temperature data
(data was gathered from 1961-2009 using 3186 weather stations)

What is the problem with increased metabolic rate?
- leads to increased need for food and increased vulnerability to starvation if food resources do not increase
- could lead to reduced energy allocation for reproduction
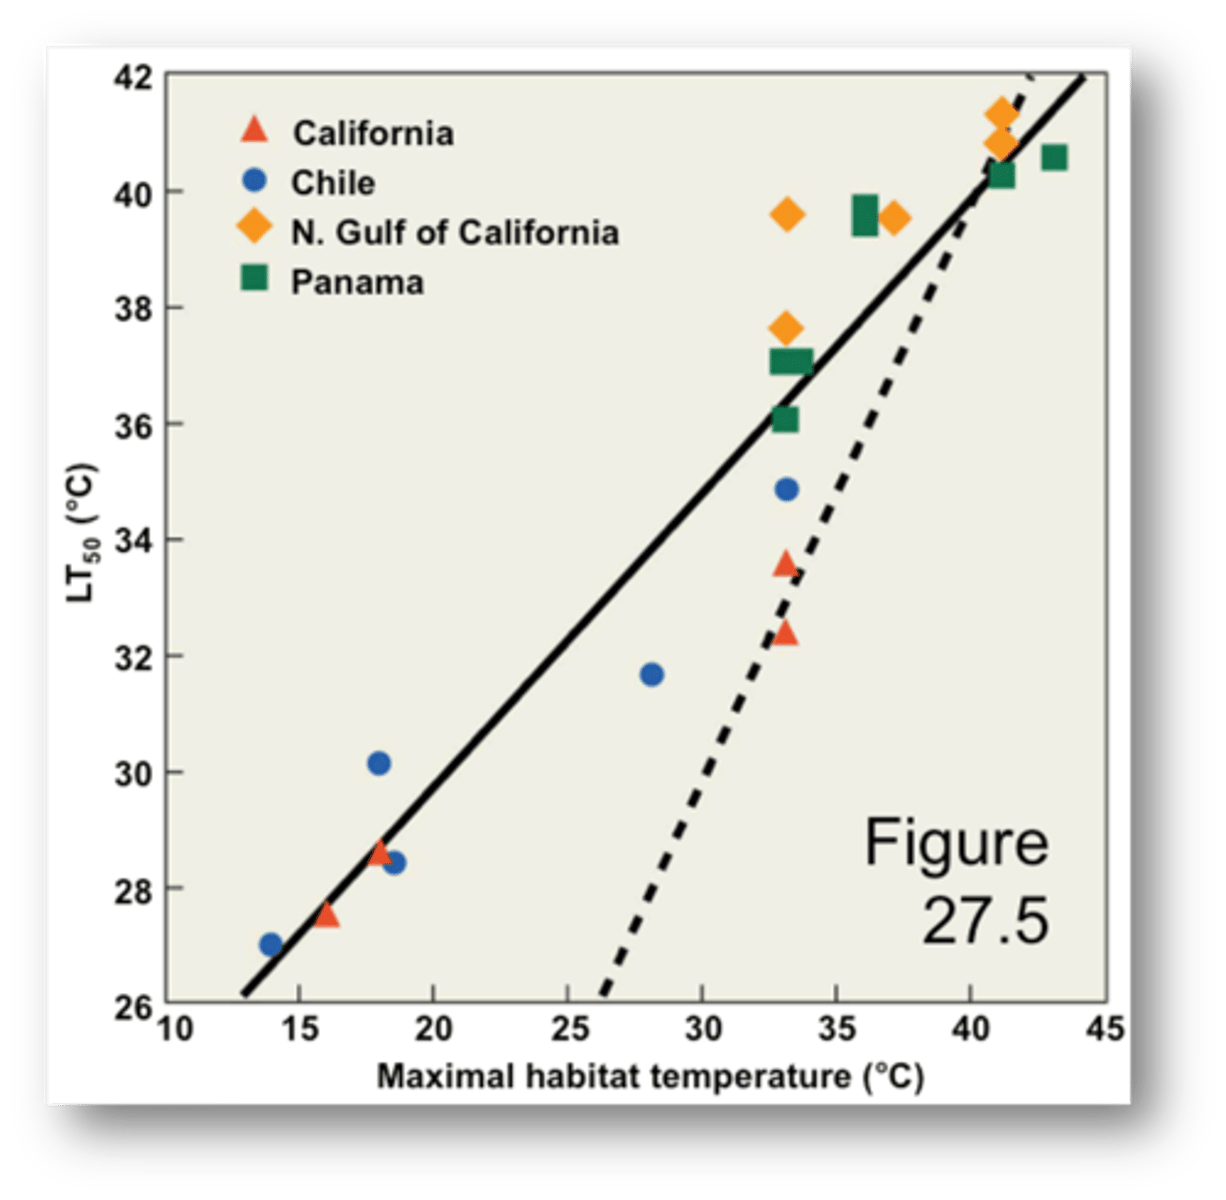
Thermal tolerance limits of species are closely aligned with
prevailing temperatures of the environments which they inhibit
-----------------
WHAT IS THIS GRAPH TELLING US?
- crabs living in warmer environments can withstand warmer temperatures
-----------------
WHICH POPULATION IS MOST SUSCEPTIBLE TO GLOBAL WARMING?
- C (California) because its LT 50 is very close to its current maximal habitat temperature
investigating impacts of recent
climate change on terrestrial plant species is more complicated
-----------------
HOW?
- response of plants to changes in both temperature and precipitation is influenced by atmospheric CO2 levels
(temperature an CO2 levels have risen in parallel)
In the more mesic regions of Eastern North A.
The analysis of tree rings has shown an increase in the length of the growing season (defined by the dates of the first and last frost of the year)
-----------------
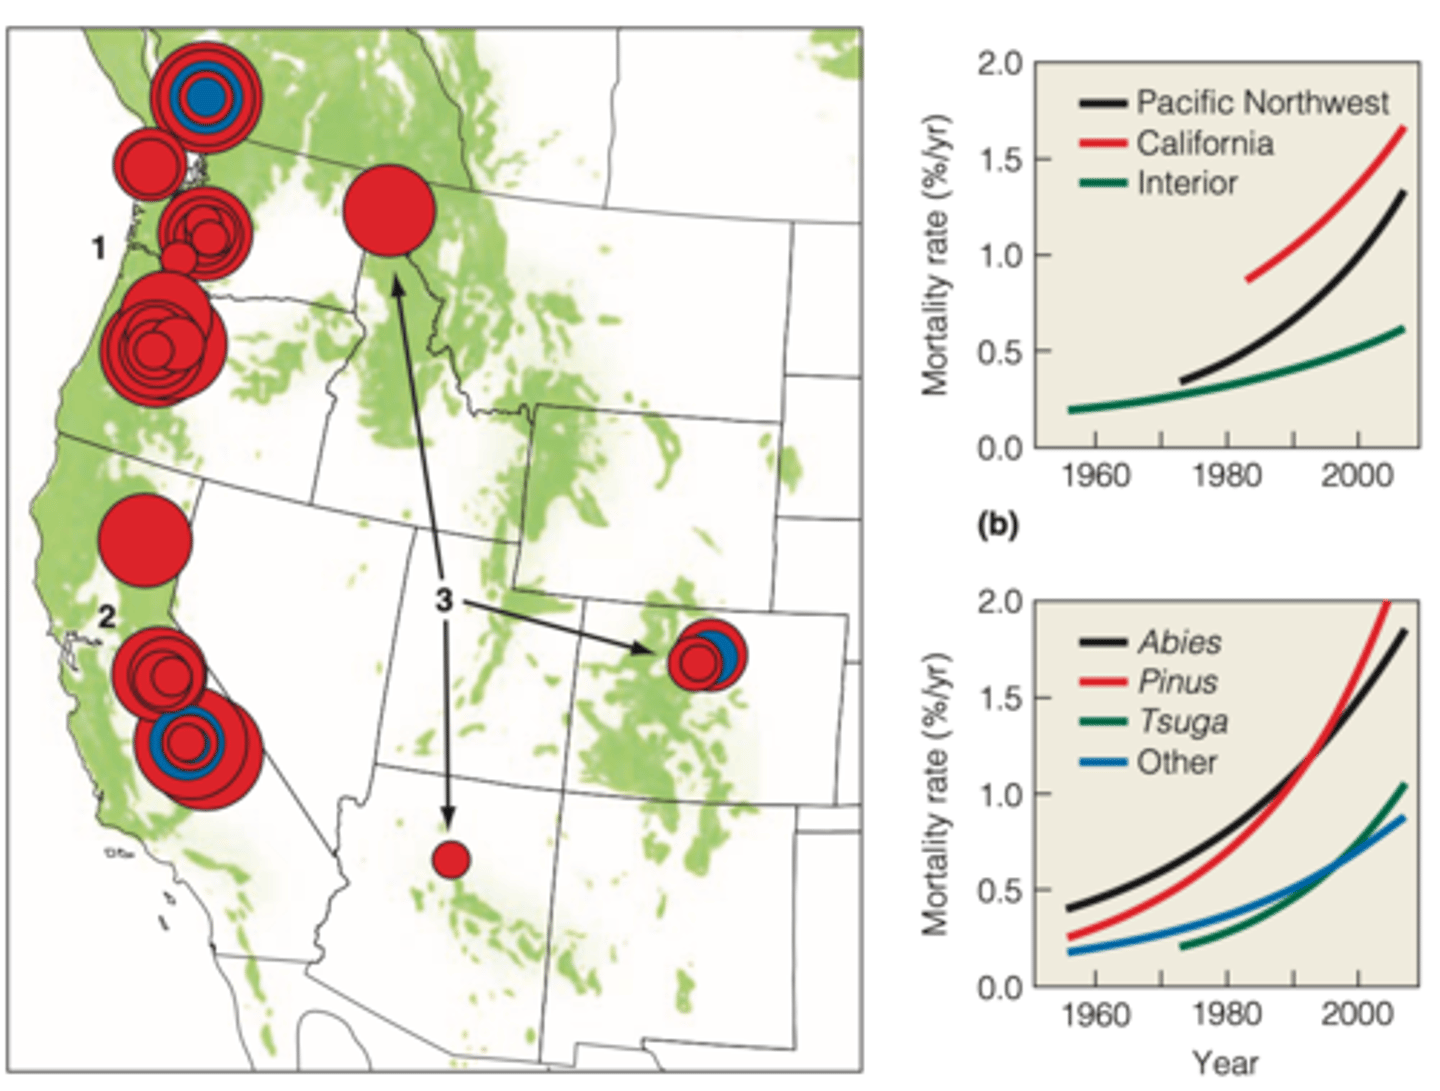
WESTERN NORTH A.
- increasing water deficits associated with warming have led to an increase in tree mortality
Tropical rainforest of Costa Rica show
a decrease in the growth rate of six rain forest tree species
- A similar trend was seen for dominant grass (C4) in the short grass prairies of the great plains
Whats going. on in these systems in Costa Rica?
Why has climate change had a negative effect?
- Associated with increasing minimum daily temperature (temperature at night)
- This results in higher rates of respiration
Phenology
the timing of seasonal activities of plants and animals
-----------------
WHICH PROCESS AND ACTIVITIES IS RELATED TO PHENOLOGY?
- hibernation
- migration
- reproduction/mating
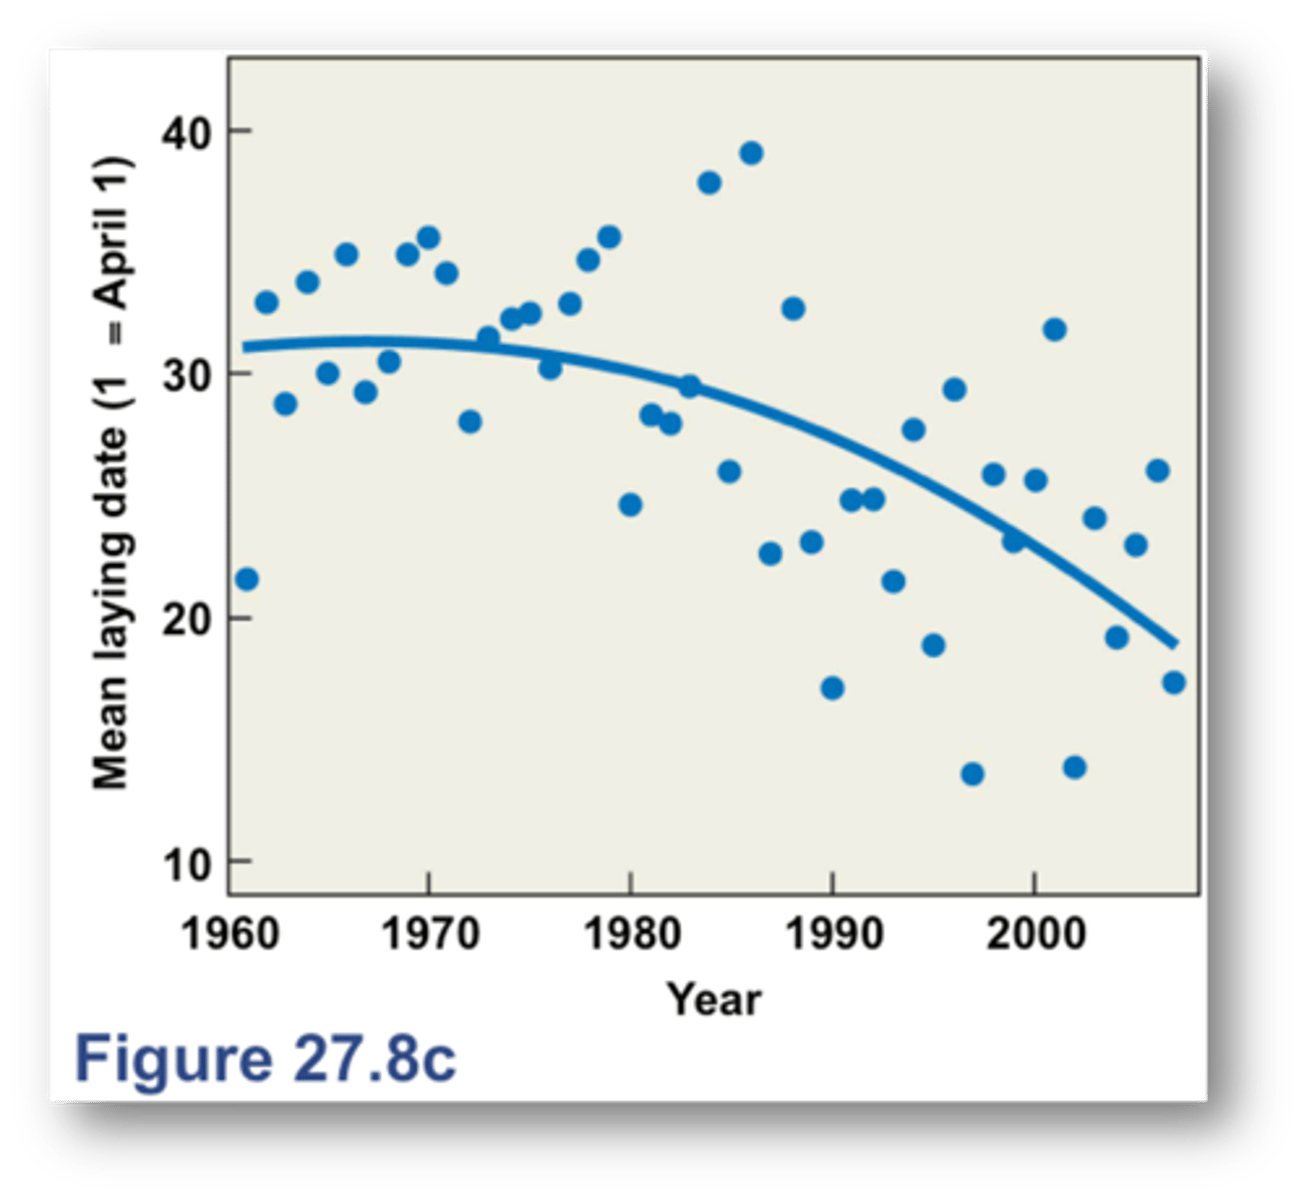
Great tilt (perching bird) (STUDY)
the onset of reproduction is a function of temperatures in the period proceeding egg-laying
-----------------
GRAPH
- there's a significant correlation between mean laying data and an index of spring "warmth" measured as the sum of daily max temperatures between 3/1 - 4/25
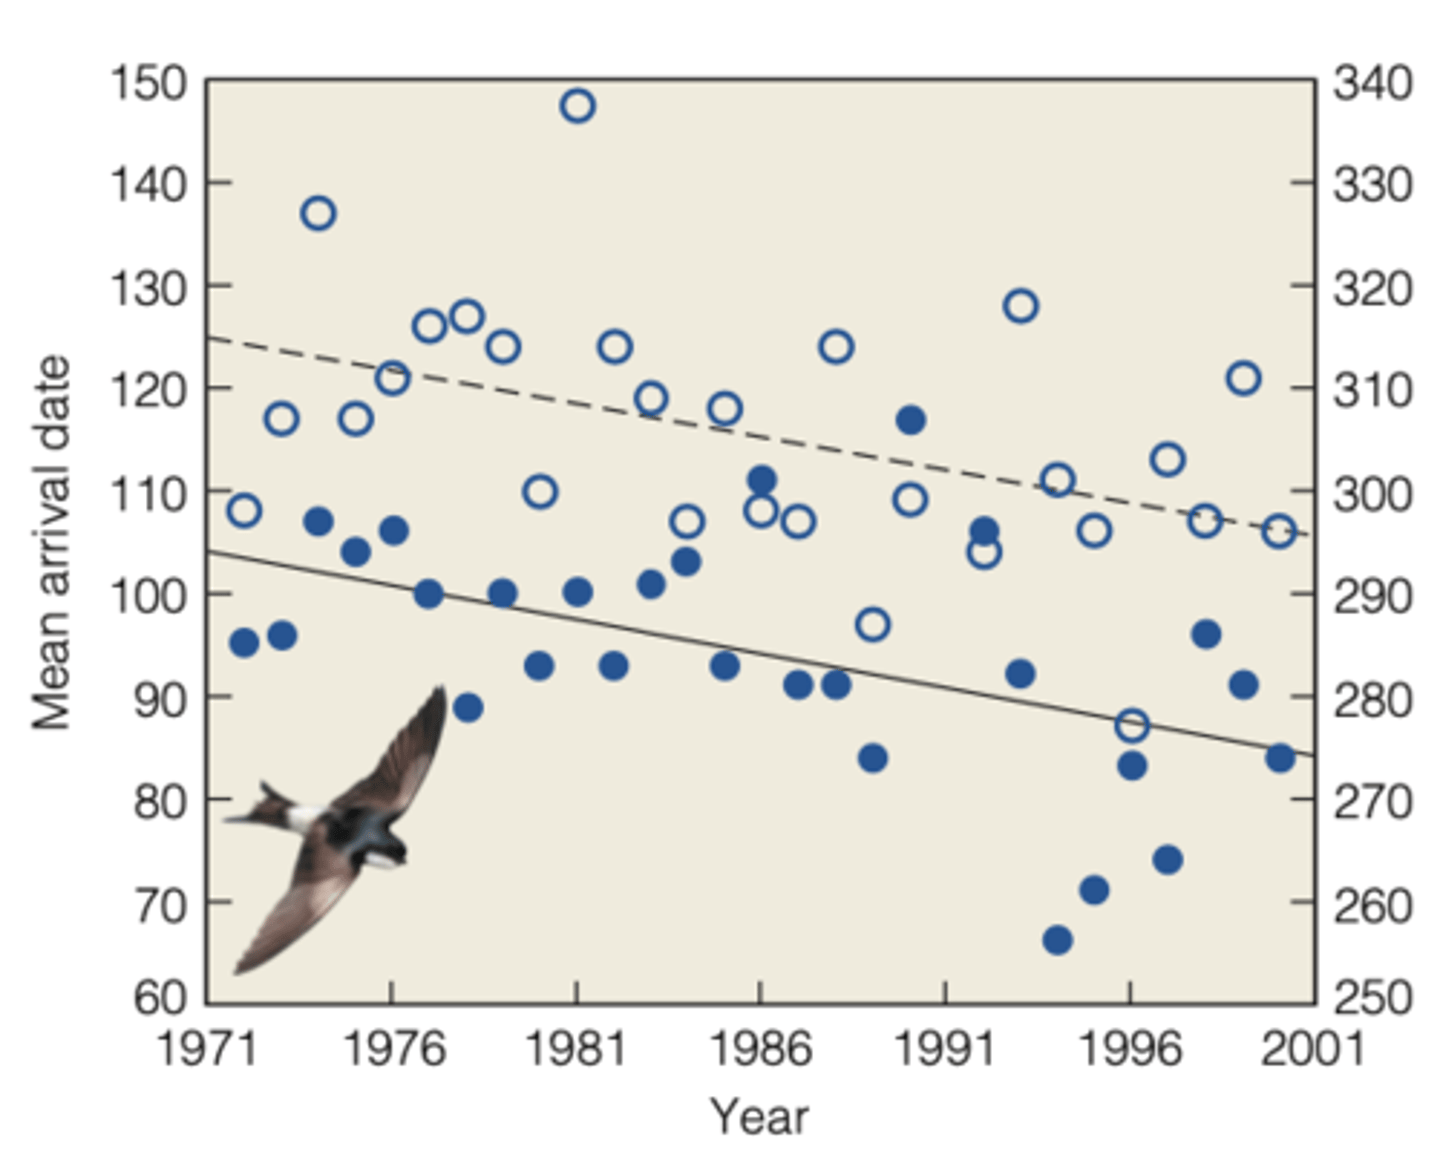
Migratory birds
the timing of arrival on breeding territories and over-wintering grounds is a key determinant of survival and reproductive success
Plymouth 20 migratory bird (STUDY)
MAIN GOAL:
- study 20 migratory bird species that breed
-----------------
RESULTS:
- 17/20 arrival date in England has been earlier in response to increase temperature in Africa
-----------------
OVERALL CONCLUSION
- the duration of stay of migrant birds in Oxfordshire has remained unchanged
- the period of residency has shifted to an earlier date by an average of 8 days over the last 30 years.
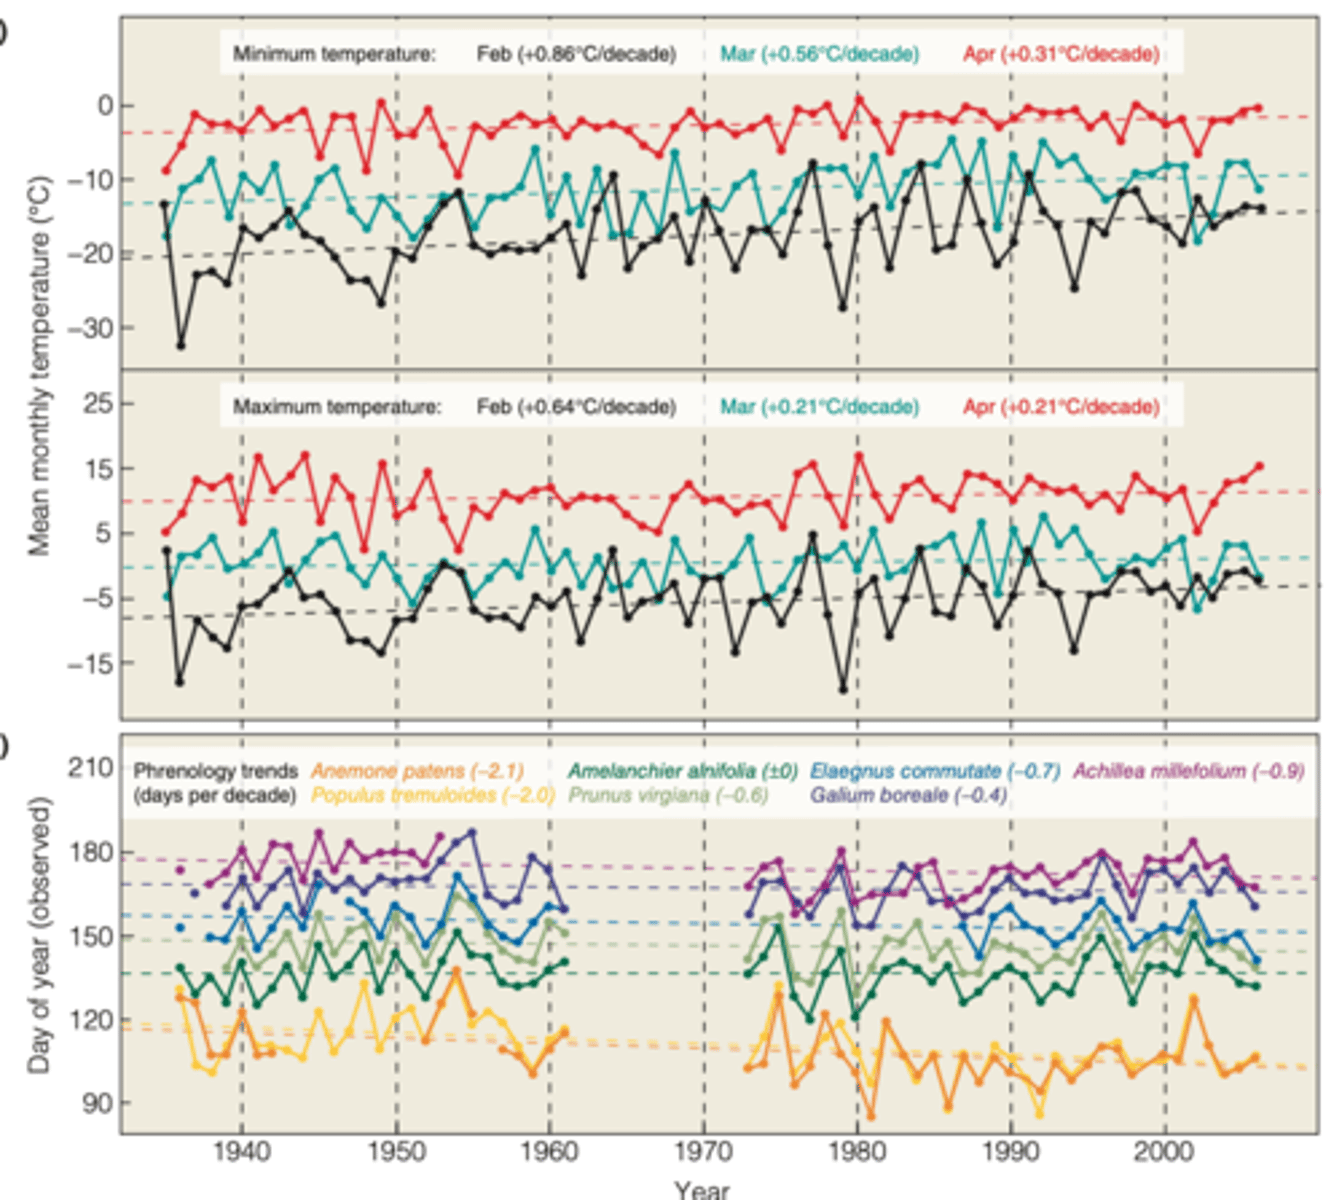
Phenology in response to climate change come from plant populations in
Northern latitudes
-----------------
EXAMPLE STUDY:
- E. Beaubien evaluated climate trends and the corresponding changes in flowering times for seven plant species in central parklands in Canada (from 1936 - to 2006)
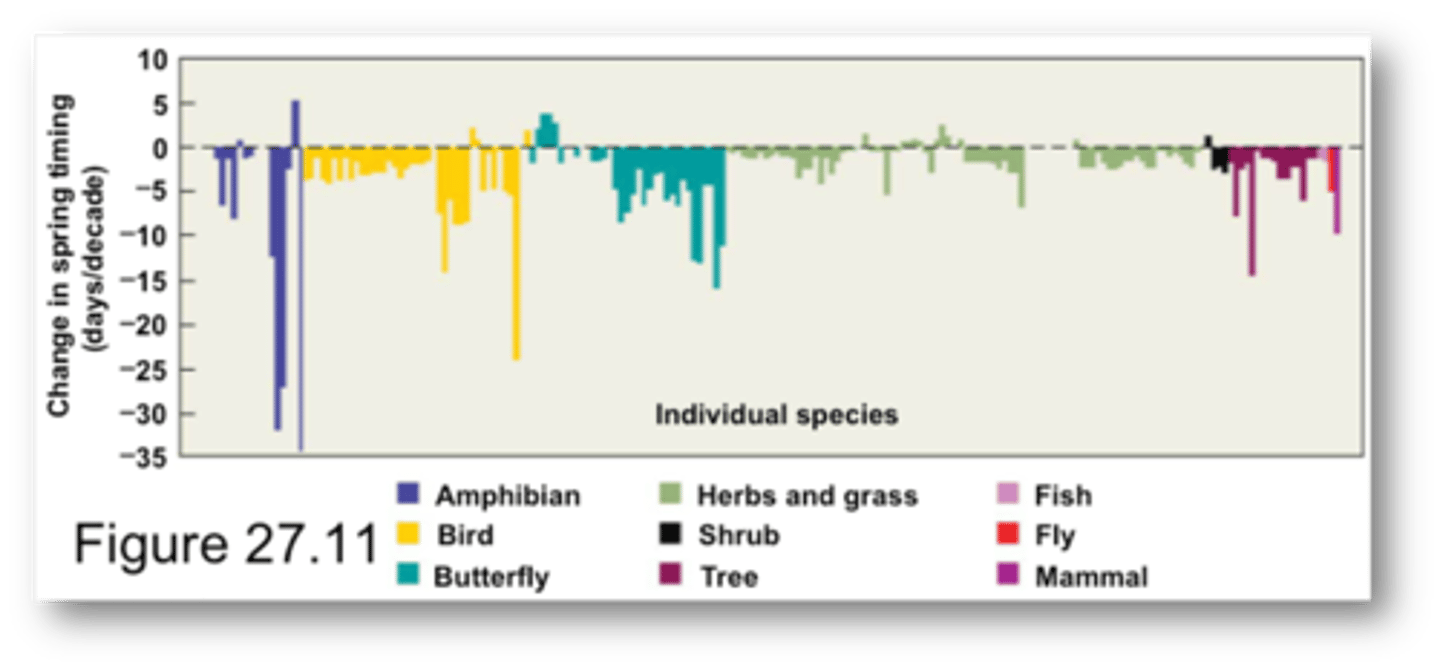
Impacts of recent climate change on plant and animal species (STUDY)
RESULTS:
- 203 plant and animal species inhabiting the northern hemisphere
- overall shifts are larger at higher latitudes
-----------------
WHAT DOES THE GRAPH SHOW?
- shows the idea of phenology in at the different seasonal change
-----------------
WHICH TAXONOMIC GROUPS HAVE BEEN IMPACTED AND WHAT PROBLEMS MAY ARISE?
- amphibians (function of plant dispersal and seed dispersal
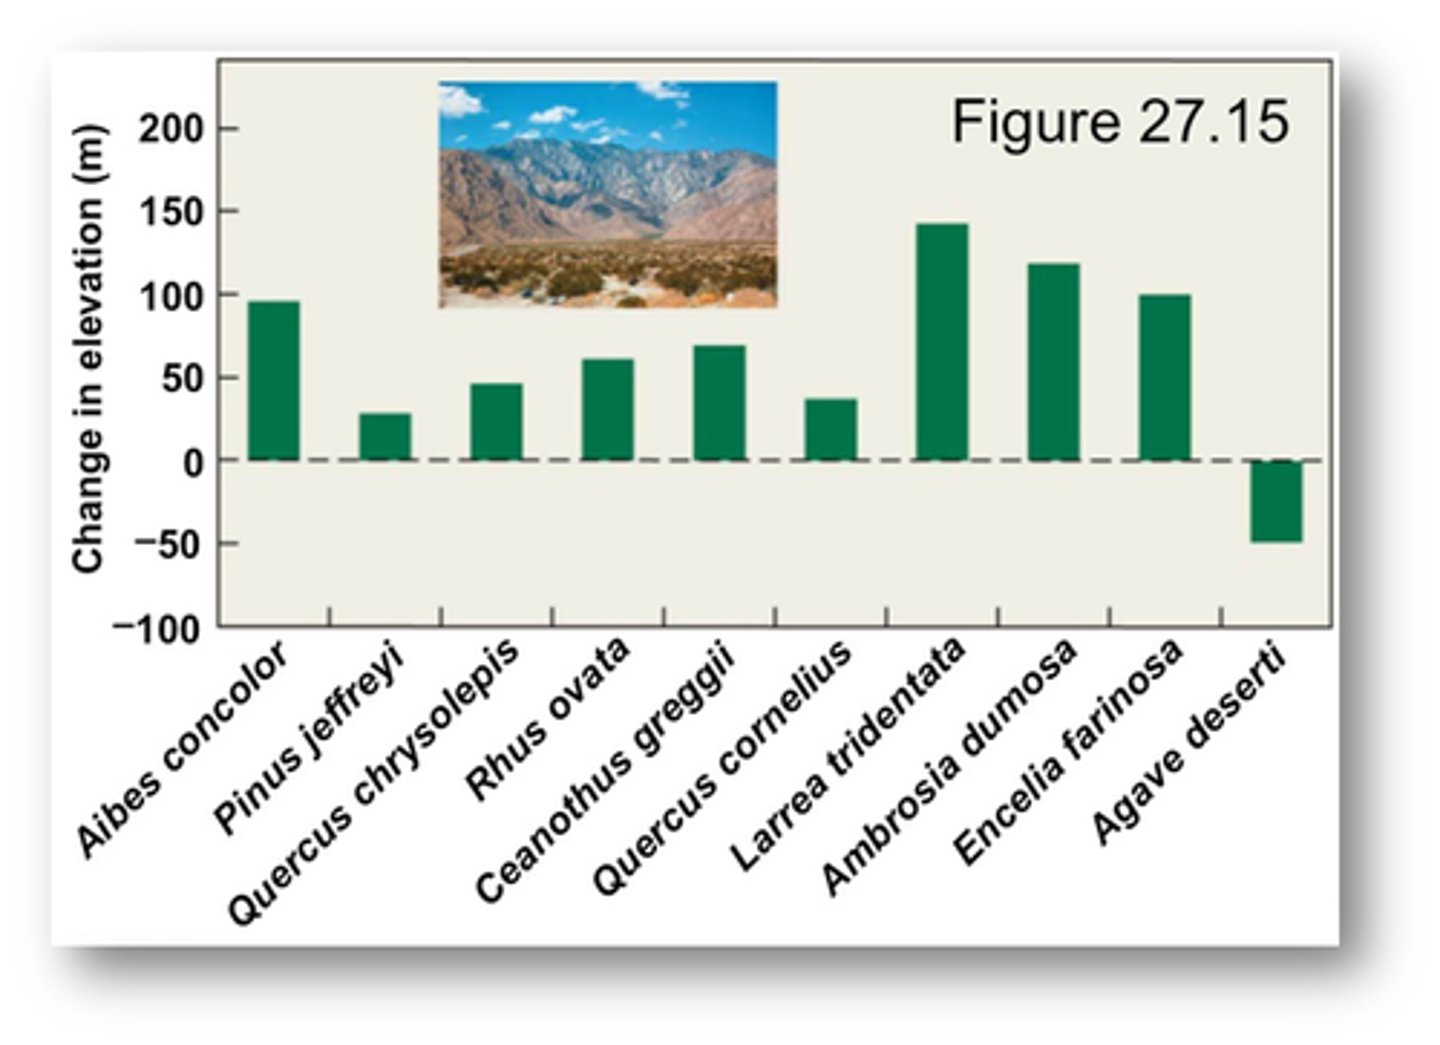
Climate has a direct influence
on species' distributions often because of species-specific physiological tolerances to temperature
- the higher latitude (or upper elevation) distribution boundary reflects constraints imposed by minimum temperatures
-----------------
To the extent that dispersal and other environmental factors allow, species are expected to track the shifting climate and likewise shift their distributions poleward in latitude and upward in elevation.
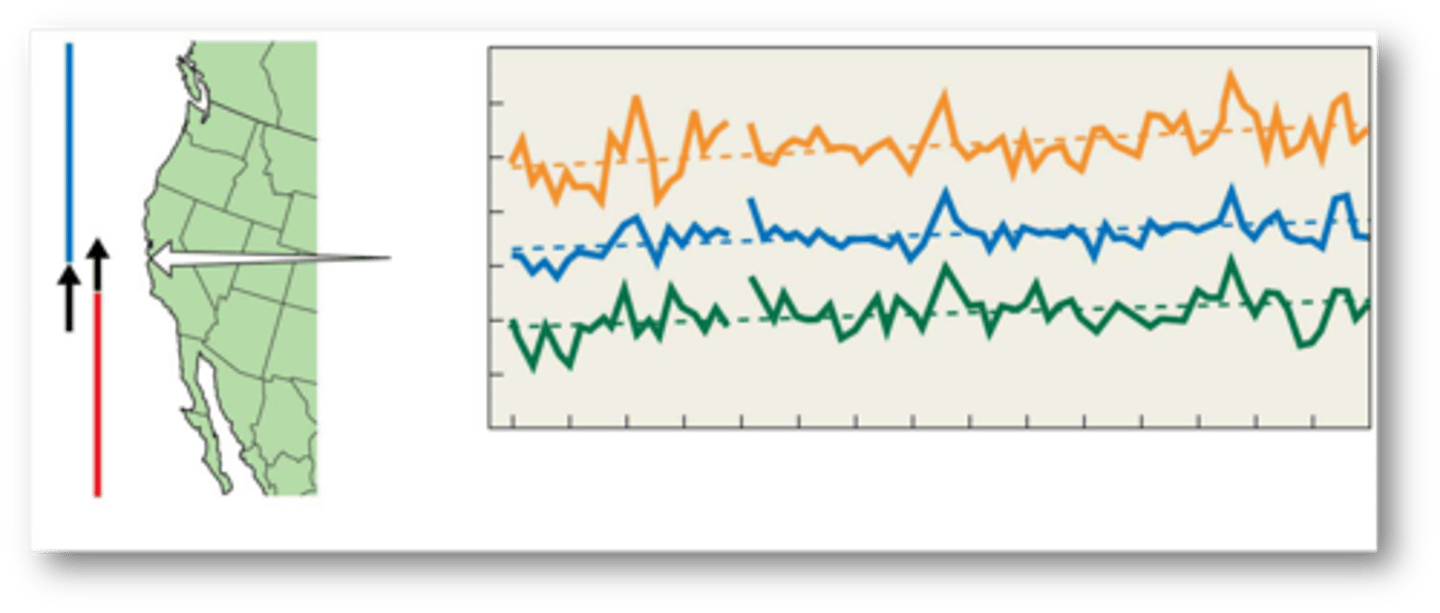
Limpets (lottia) species (STUDY)
MAIN GOAL:
- study of latitudinal distribution ranges of two closely related limpet species inhabiting intertidal environments
-----------------
RESULTS:
shift in the latitudinal range of the two limpet species is consistent with increases in shoreline ocean temperatures recorded for the region over this period
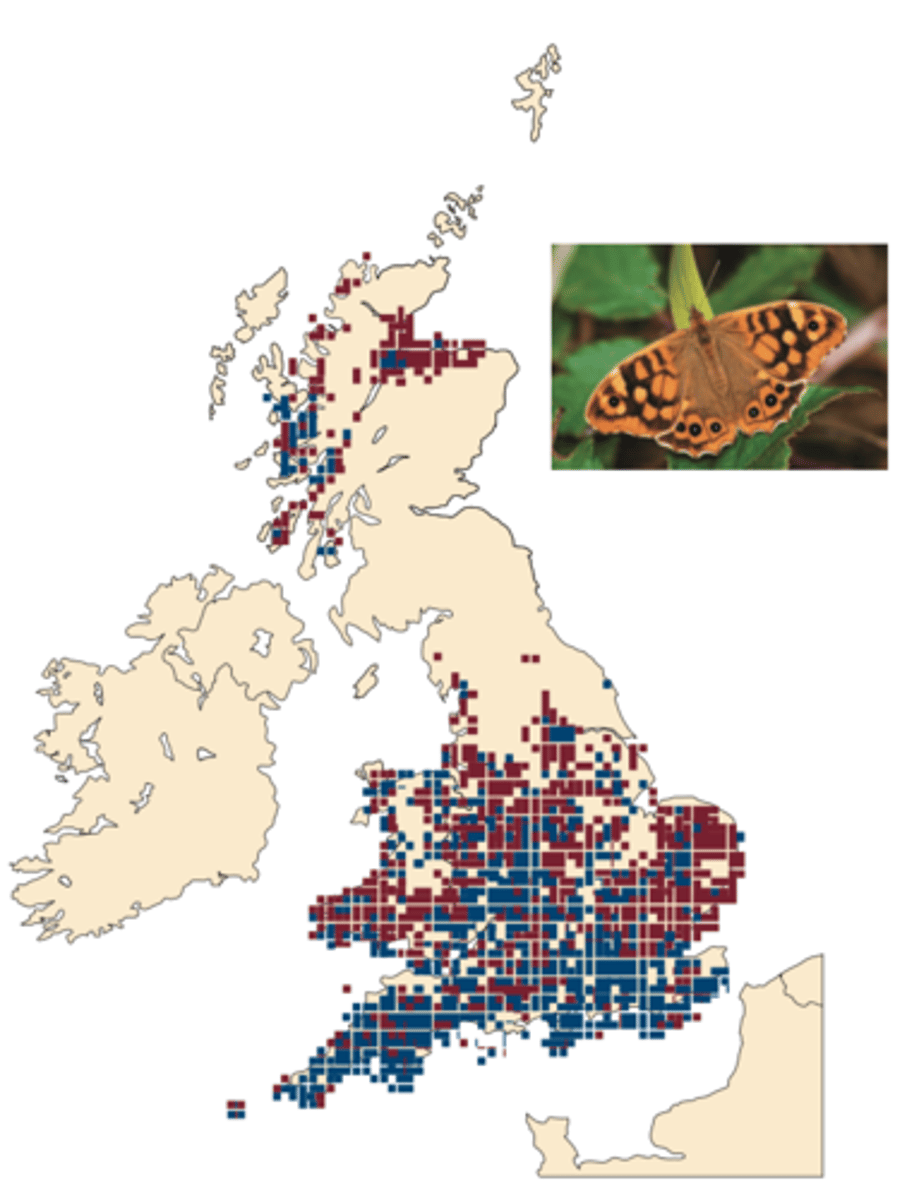
Nonmigratory Butterflies species (STUDY)
MAIN GOAL:
- analyze distribution over the past century for nonmigratory species of butterflies
-----------------
RESULTS:
- 65% of the species studied, moved north in the past 30 to 100 years
- the southern boundaries have remained stable or retracted northward
Nonmigratory Bird species (STUDY)
Numerous studies of the geographic distribution of nonmigratory bird species in North America and Europe have shown a consistent pattern of northward range expansion since the 1960s

Shifts in plant species' distributions in response to climate change is
more limited and is often conflicting
- large scale forest (STUDY)
-----------------
MAIN GOAL:
- examined the distributional changes for seedlings and trees in the Eastern U.S
-----------------
RESULTS:
- 54/92 species showed a pattern consistent with range contraction rather than expansion at both the Northern and southern boundaries
recent climate change is apparently
influencing interactions among species within existing ecological communities through its differential effects on the component species
Nature or species interactions
are altered as a result of the species exhibiting different phonological responses to changes in key variables
-----------------
IN SEASONAL ENVIRONMENTS:
- the production of offspring is time to coincide with the annual peak of resource availability
(for herbivores, this is the plant growing season)
Caribu (Study)
MAIN GOAL:
- monitor caribou calving season and plant phenology (timing and progression of emergence)
-----------------
RESULTS:
- successful caribu reproduction depends on synchrony of calving with resource abundance
- in the far north, plant nutrient content and digestibility peak soon after emergence and then decline rapidly

How has each tropic level responded to climate change?
both emerged earlier but plants had > 10 fold greater response
-----------------
WHAT EFFECT DID THIS TROPIC MISMATCH HAVE?
- > 3 fold increase in calf mortality

There is a difference in the environmental cues that trigger each event
EXAMPLE:
- Caribou are largely cued by changes in day-depth (same from year to year)
-The growing season of the plants is correlated with the mean spring temperature (increased by 4.6°C during the study)
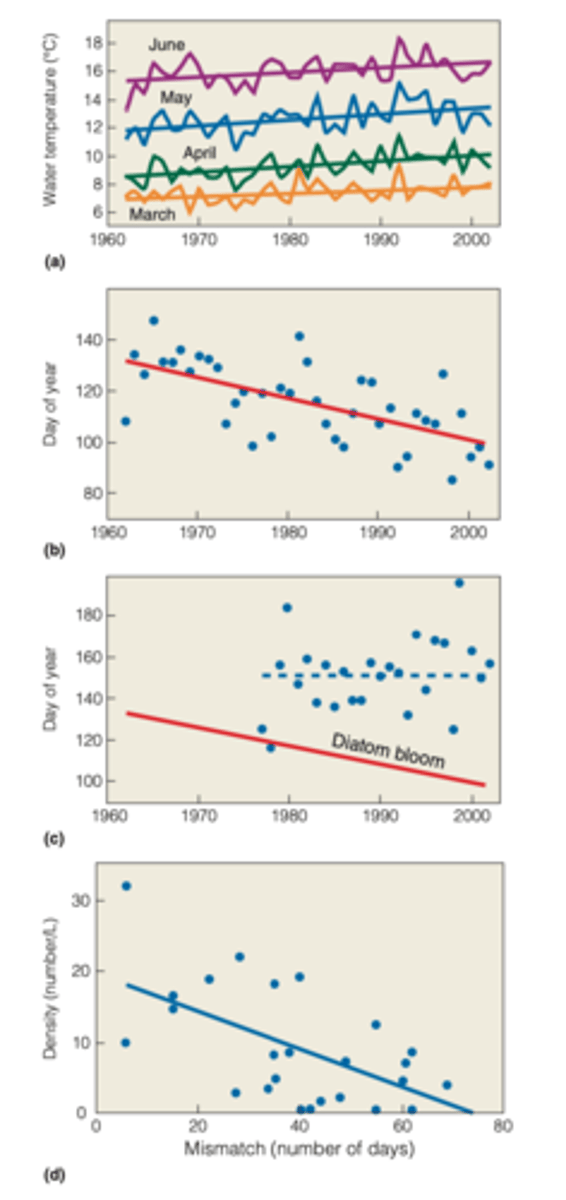
similar mismatch between
the phenology of herbivores and their food resources has been observed in lake ecosystems
Phenology of phytoplankton (STUDY)
MAIN GOAL:
- examined changes in the phenology of phytoplankton and zooplankton populations
-----------------
RESULTS:
- spring water temperatures exhibit significant warming trends and values in the upper layer from March to June, increasing on average 1.4°C
Changes in climate change can increase
the fitness of one species at the expense of another
-----------------
MOUNTAIN PINE BEETLE (STUDY)
- native species that attacks most trees of the genus Pinus
- periodically erupts in epidemics.
- epidemics of mountain pine beetle have been on an order of magnitude larger than previously recorded as a direct result of recent climate change.
what role has climate change played?
increased temperatures and increased drought
-----------------
- has decreased tree health and increased tree susceptibility to beetles
- regional warming has led to the range expansion of beetles especially at high elevations
- warming has also affected the beetles life history
How has warming affected the beetles life history
- the beetle flight season (flying to attack new trees) starts one month earlier and lasts twice as long
- some beetles have two (rather than one) generation per year
Net primary productivity and decomposition
are key ecosystem processes
-----------------
FEATURES:
- these control energy and nutrients in the ecosystem
- climate has a direct influence on both processes
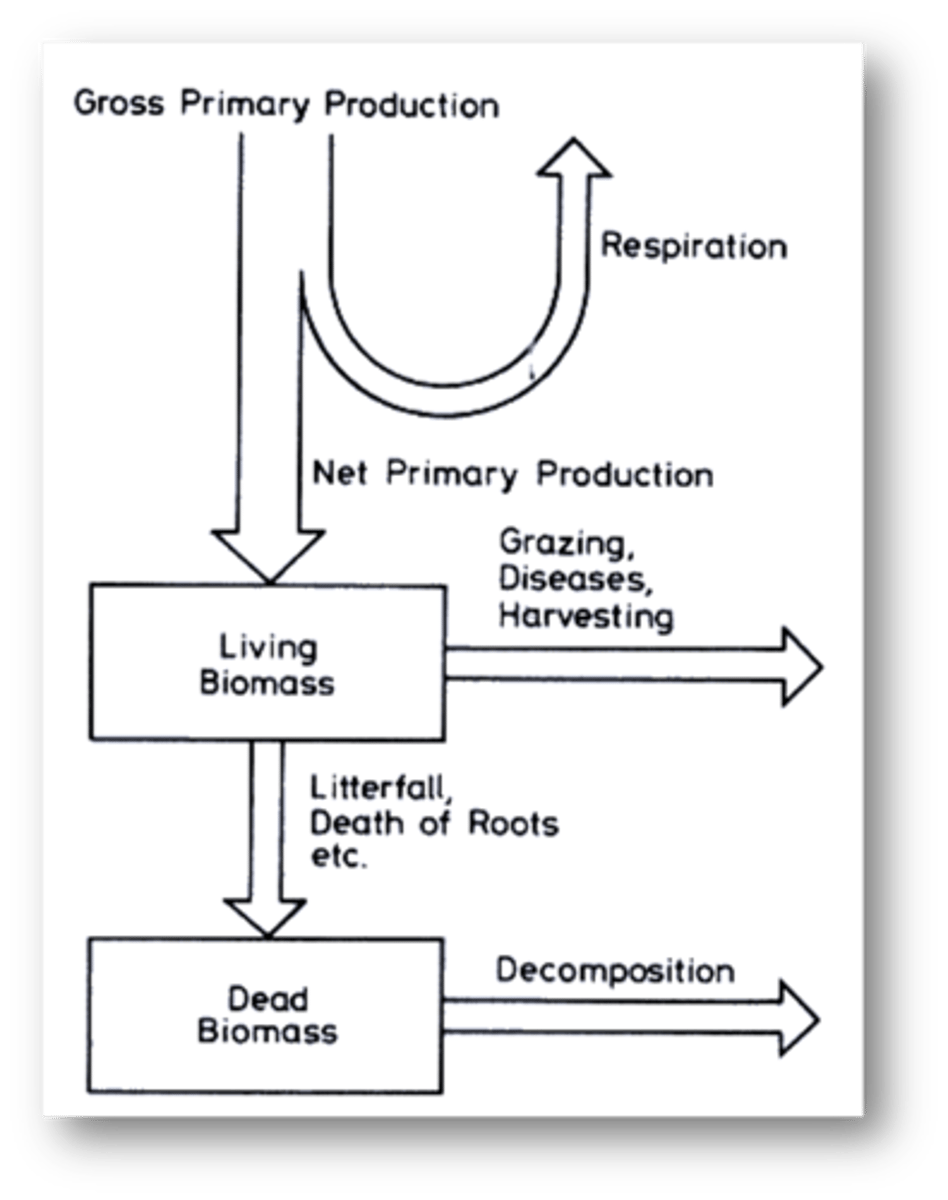
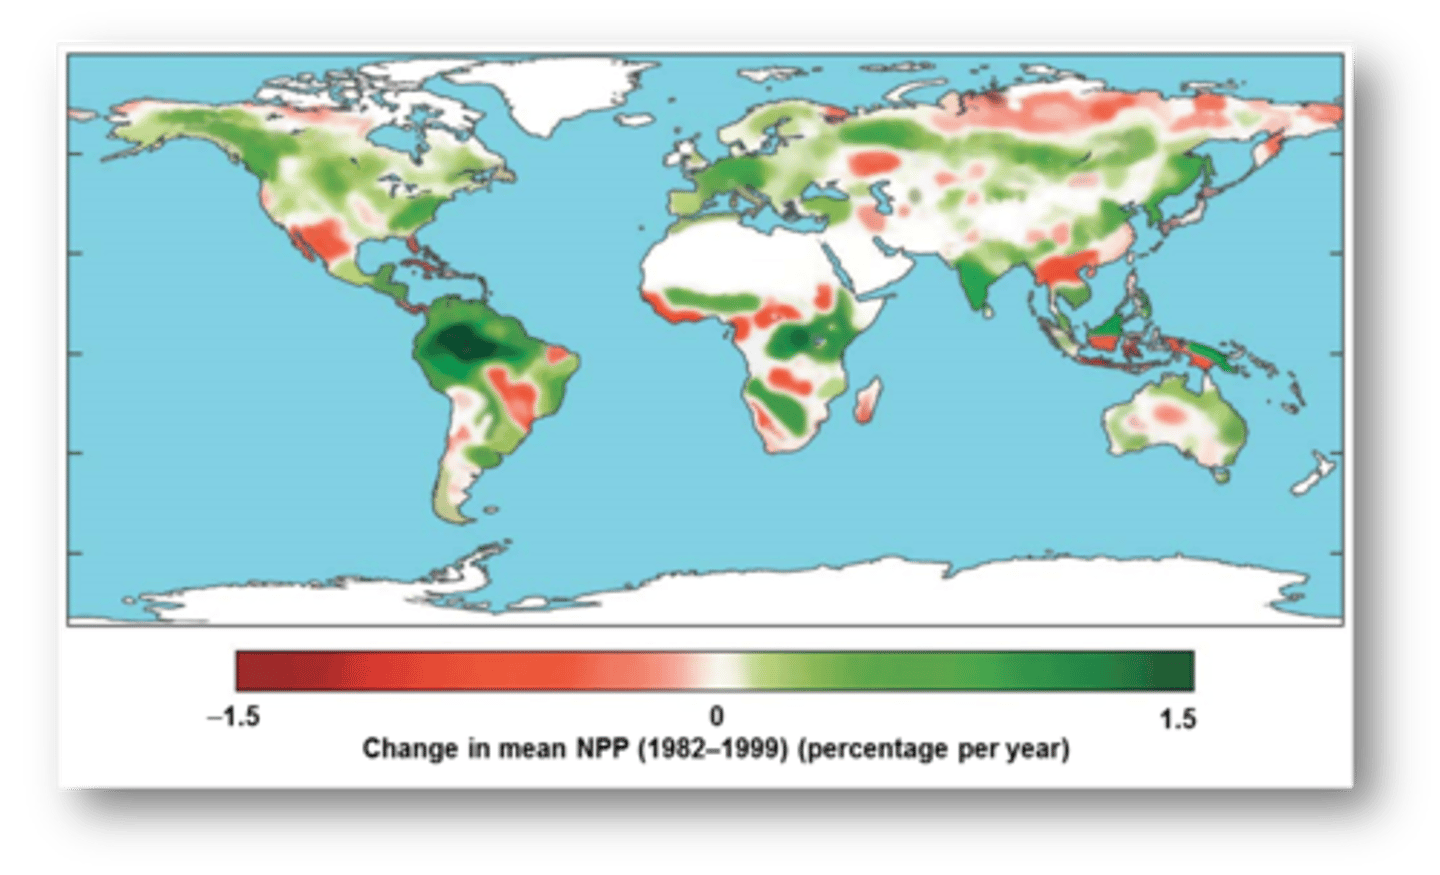
Climate has a direct influence on
the key ecosystem processes of net primary productivity (NPP)
-----------------
TERRESTRIAL NPP
- can be estimated from satellite-based measures of absorbed photosynthetically active radiation (APAR) over large land areas (can examine temporal and spatial changes)
NPP (STUDY)
MAIN GOAL:
- study the net primary productivity within 2000-2009
-----------------
RESULTS:
- a reduction in NPP of 0.55 petagrams (1 petagram = 1 billion tons) of carbon as a result of regional drying that would constrain plant growth
- spatial patterns of NPP over the past decade have not been globally consistent
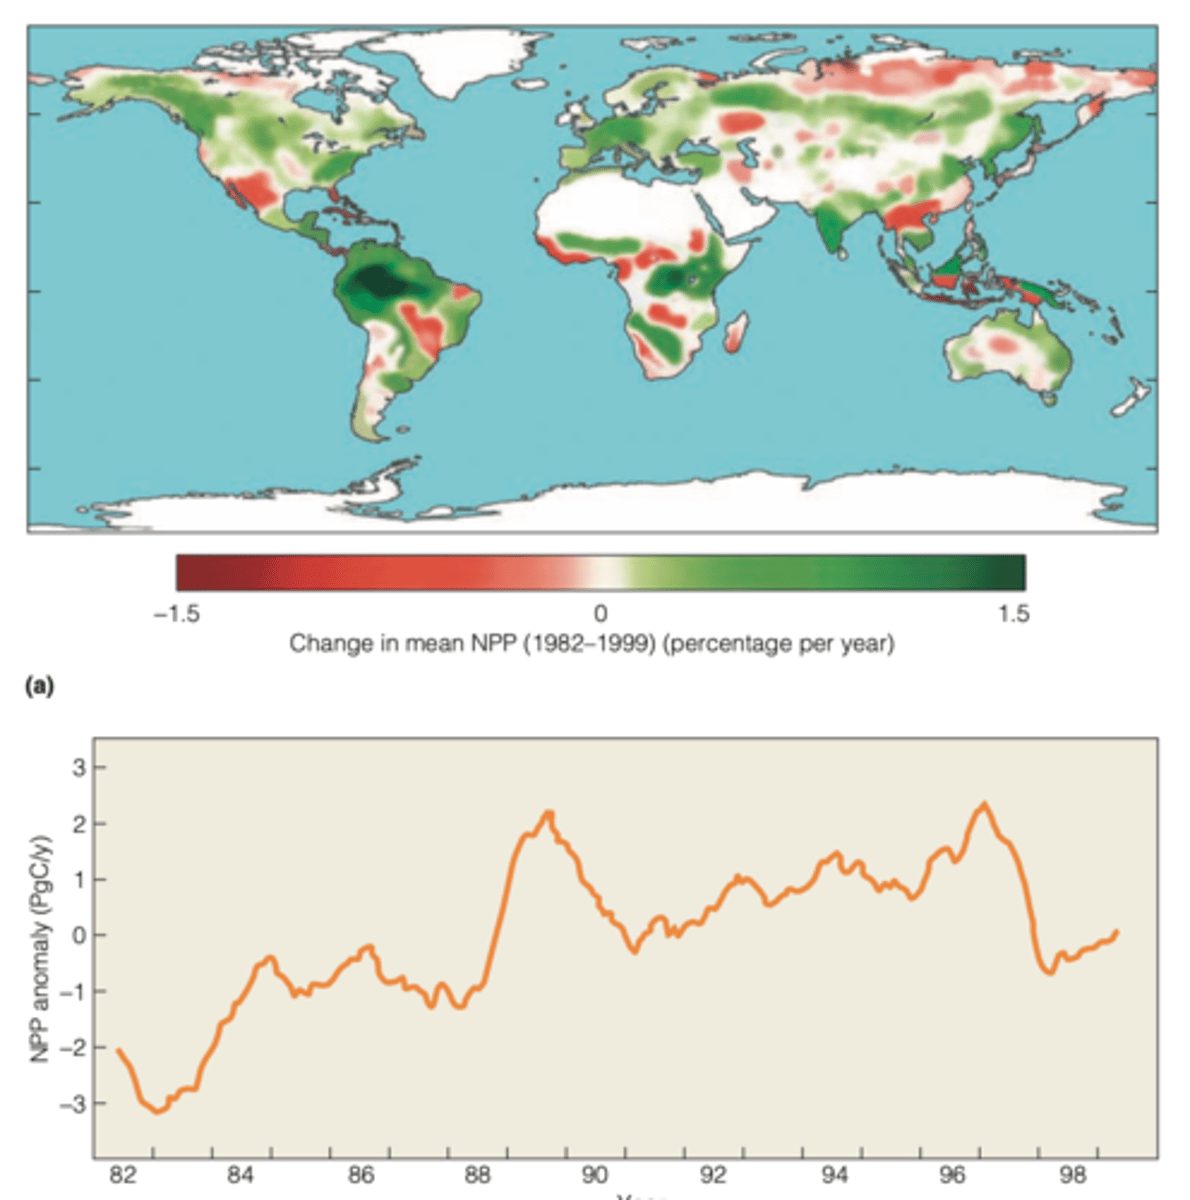
spatial patterns of NPP over the past decade
have not been globally consistent
-----------------
NPP INCREASED:
- the Northern Hemisphere (65% of the vegetated land area had an increase)
-----------------
NPP DECREASED:
- in the Southern Hemisphere (70% of vegetated land area had a decrease)
- higher temperatures lead to increased evaporation and reduced water availability
Two major sources of uncertainty in predicting the response of ecological systems to future
- the uncertainty associated with the specific predictions of how the climate in a given region will change in response to increasing greenhouse gases
- the limitations in our understanding of processes that control the current distribution and abundance of species
Given the sources of uncertainty what type of studies would be more informative?
TWO CATEGORIES:
- examining the response of ecological systems to experimental warming and the associated environmental factors
- using models of ecological systems to evaluate the response to future climate scenarios
Numerous experimental studies
in a wide variety of environments (from polar to tropical) have shown that communities and ecosystems respond strongly to warming
-----------------
MOST STUDIES:
- have been limited to a single location and are of short duration
- comparisons among studies are difficult because of the variety of techniques used to achieve warming experimentally
International tundra Experiment (ITEX)
network of arctic and alpine research sites throughout the world where experimental and observational studies have been established by using standardized protocols to measure responses of tundra plants and plant communities to increased temperature.
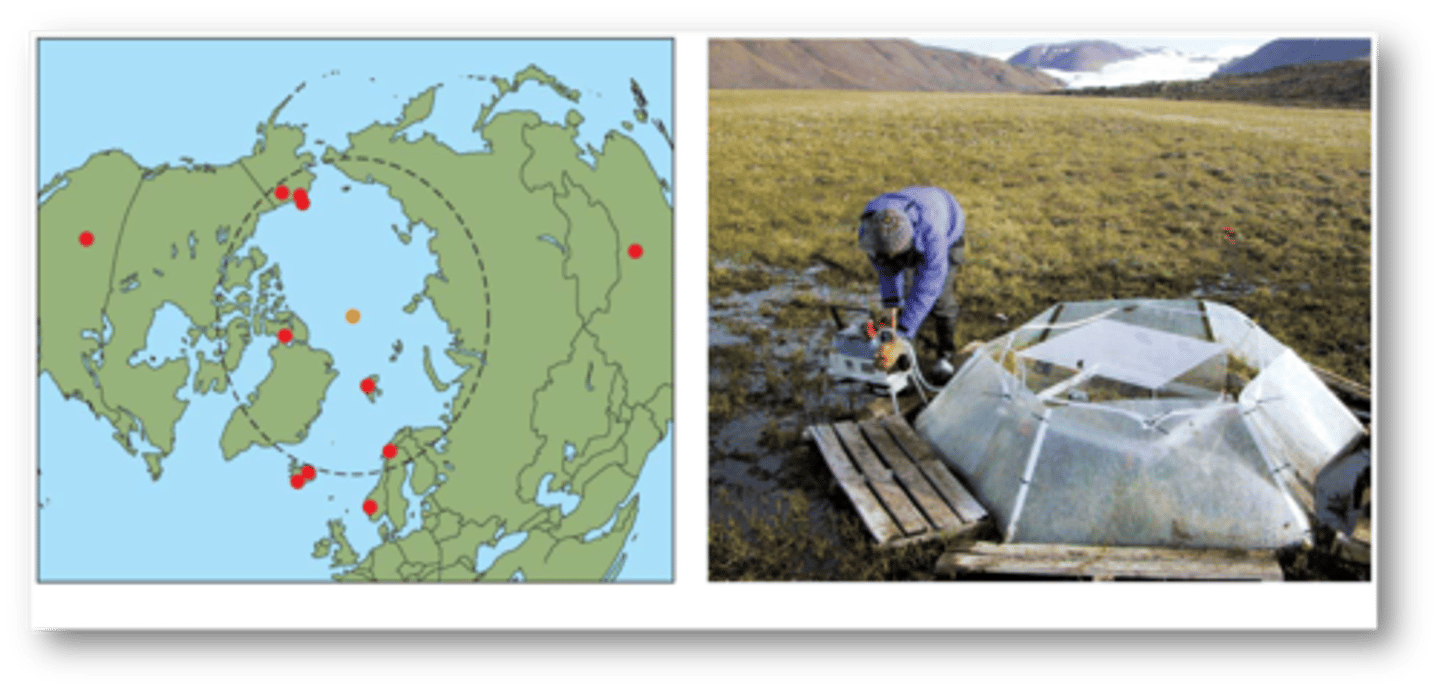
ITEX experiments
use passive warming treatments to increase plant level air temperature by 1-3°C

Responses were rapid and detected in
whole plant communities after only two growing seasons
-----------------
RESULTS:
- increased height and cover of deciduous shrubs and grasses
- decreased cover of mosses and lichens
- decreased species richness and evenness
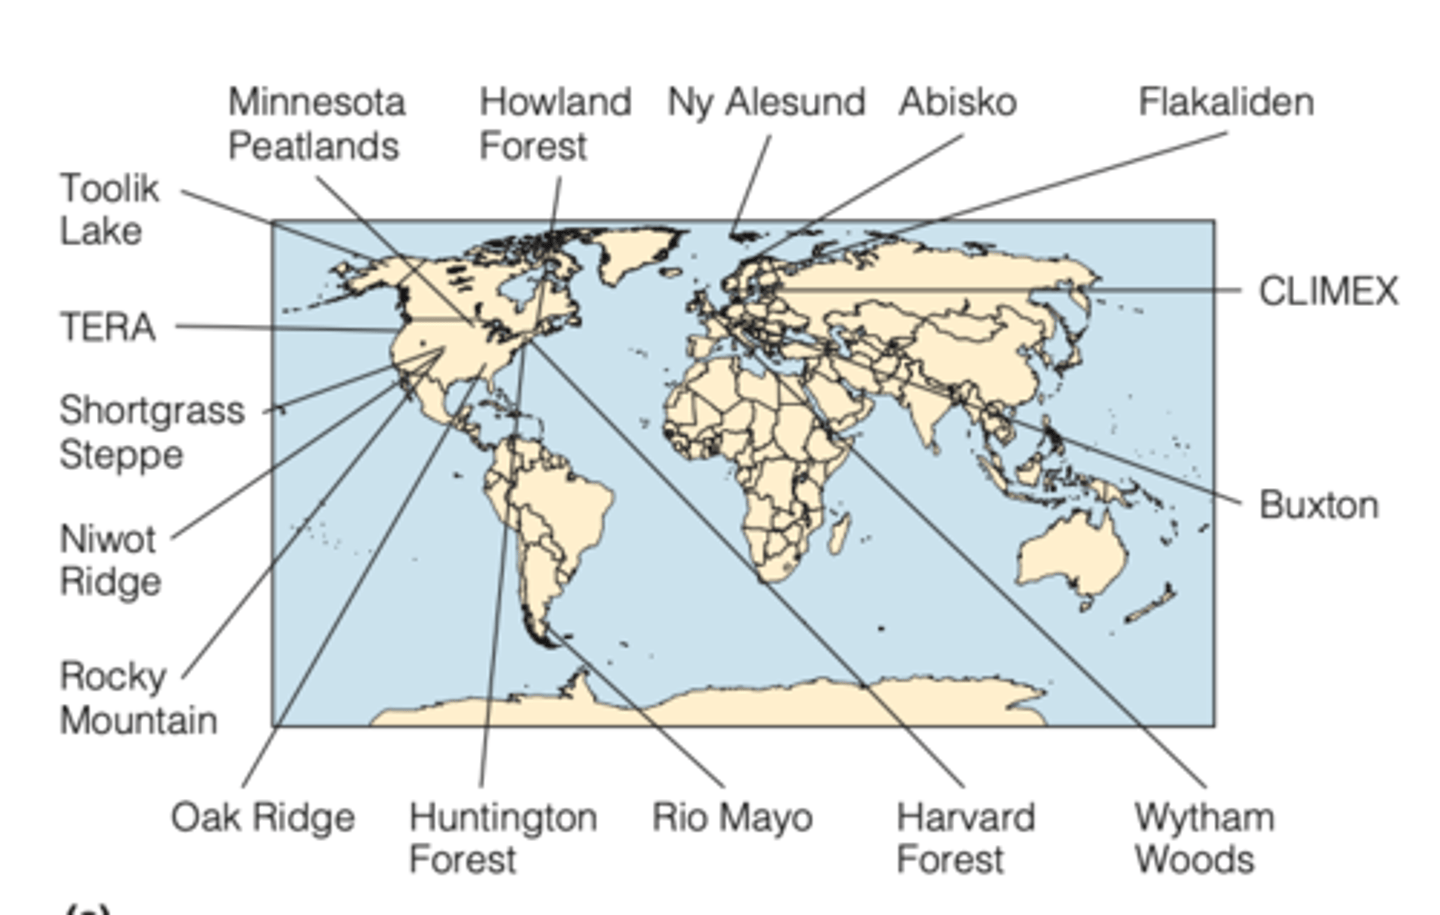
Network of ecosystem warming studies
is another coordinated international effort to study the response of ecosystems to climate warming
-----------------
FOCUS ON:
- response of soil respiration
- net nitrogen mineralization
- above-ground NPP
-----------------
32 research sites in four broadly defined biomes (high (latitude or altitude) tundra, low tundra, grassland, forest)
Results of Network of ecosystem warming (STUDY)
RESULTS:
- across all sites experimental warming (0.3-6.0°C) for a period ranging from 2 to 9 years in duration increased soil respiration rates by 20 percent, net nitrogen mineralization rates by 46 percent, and NPP by 19 percent
Limitations of the Network of ecosystem warming study
- limited in geographic scope
- limited range of climate change scenarios that can be evaluated
- most research is focusing on developing mathematical models (statistical and computer simulations) that can provide information on future climate change impacts
Bioclimate envelope model (ecological niche or species distribution model)
based on relating features of climate to geographic patterns of species occurrence
-----------------
FEATURES:
- is one of the most widely applied modeling approaches to investigate the response of an individual species to climate change
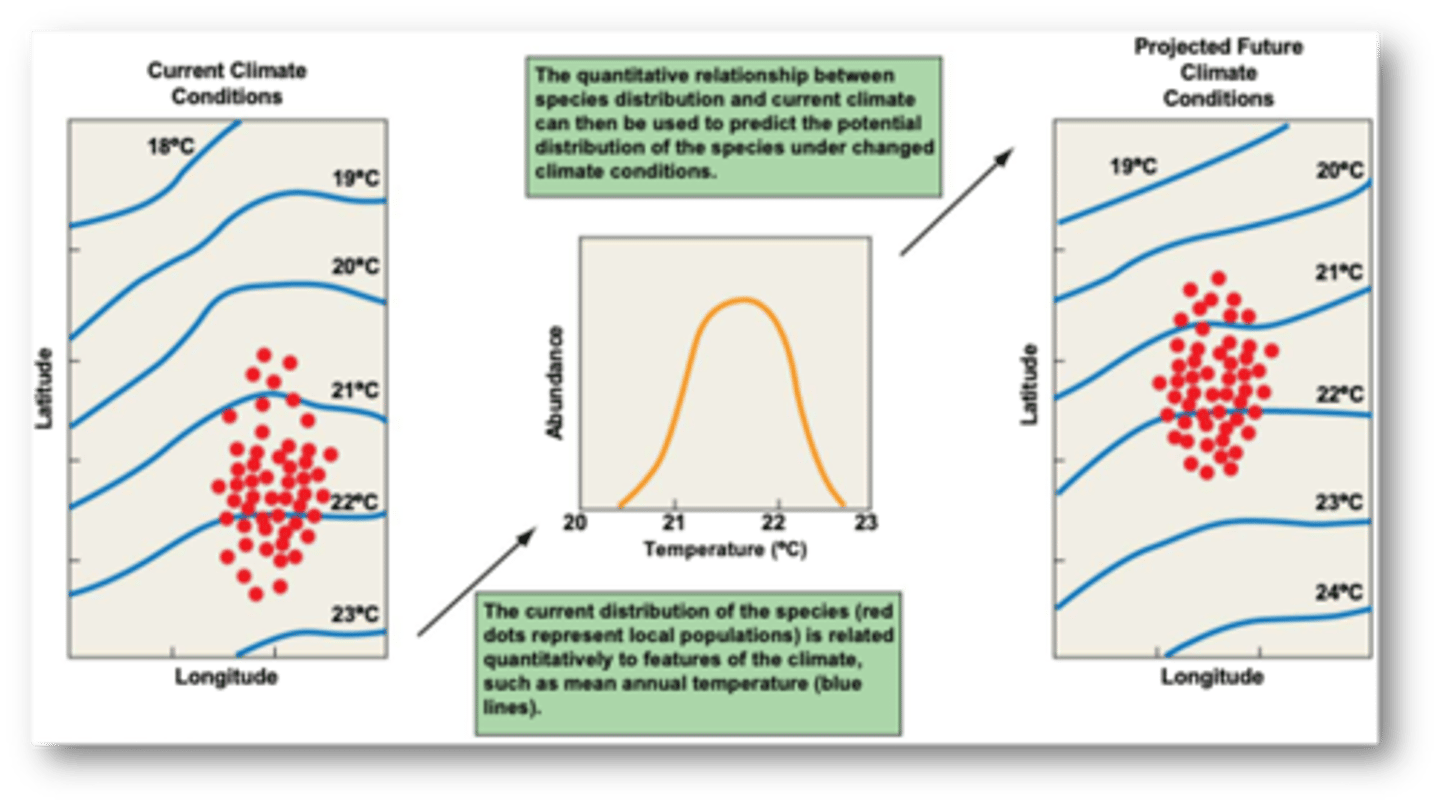
Establishes a quantitative relationship between
climate and the current geographic distribution
- this relationship can be used to map the possible geographic range of the species under different climate change scenarios
-----------------
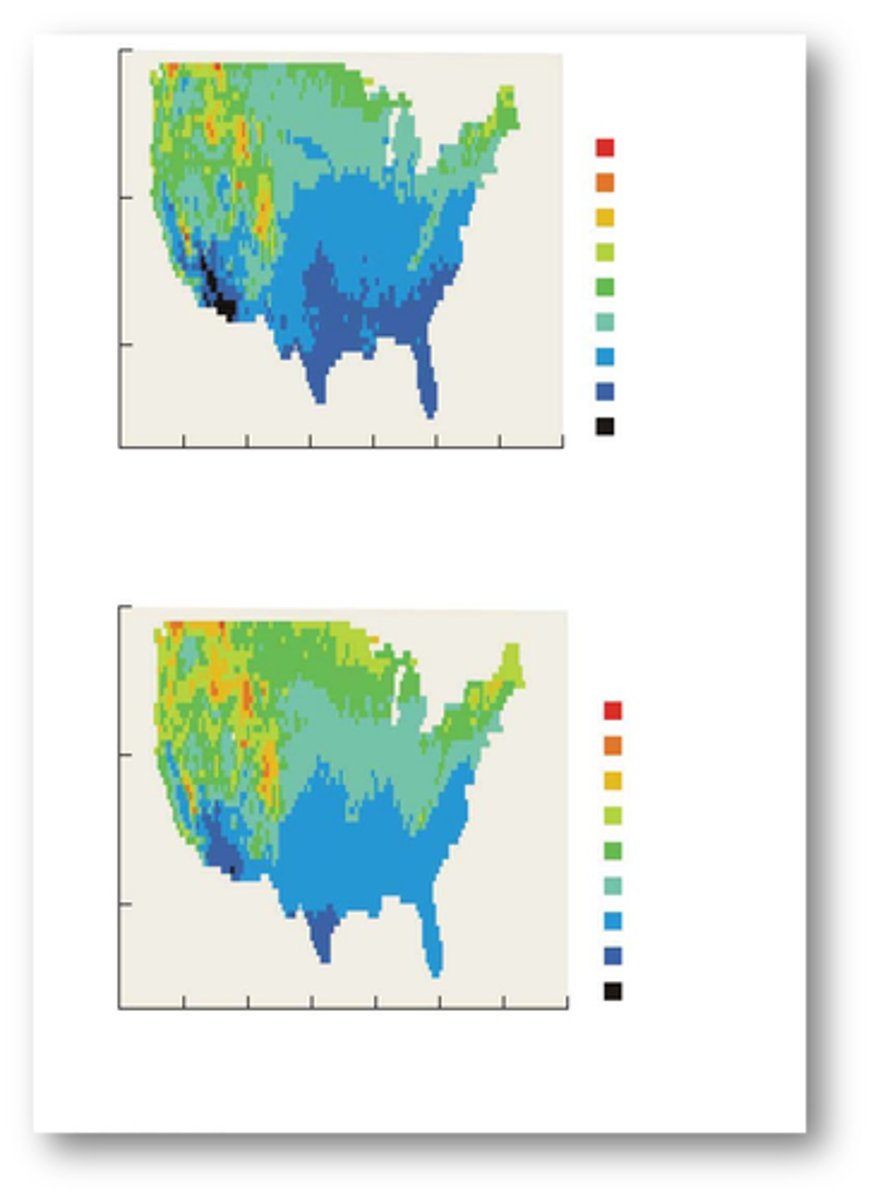
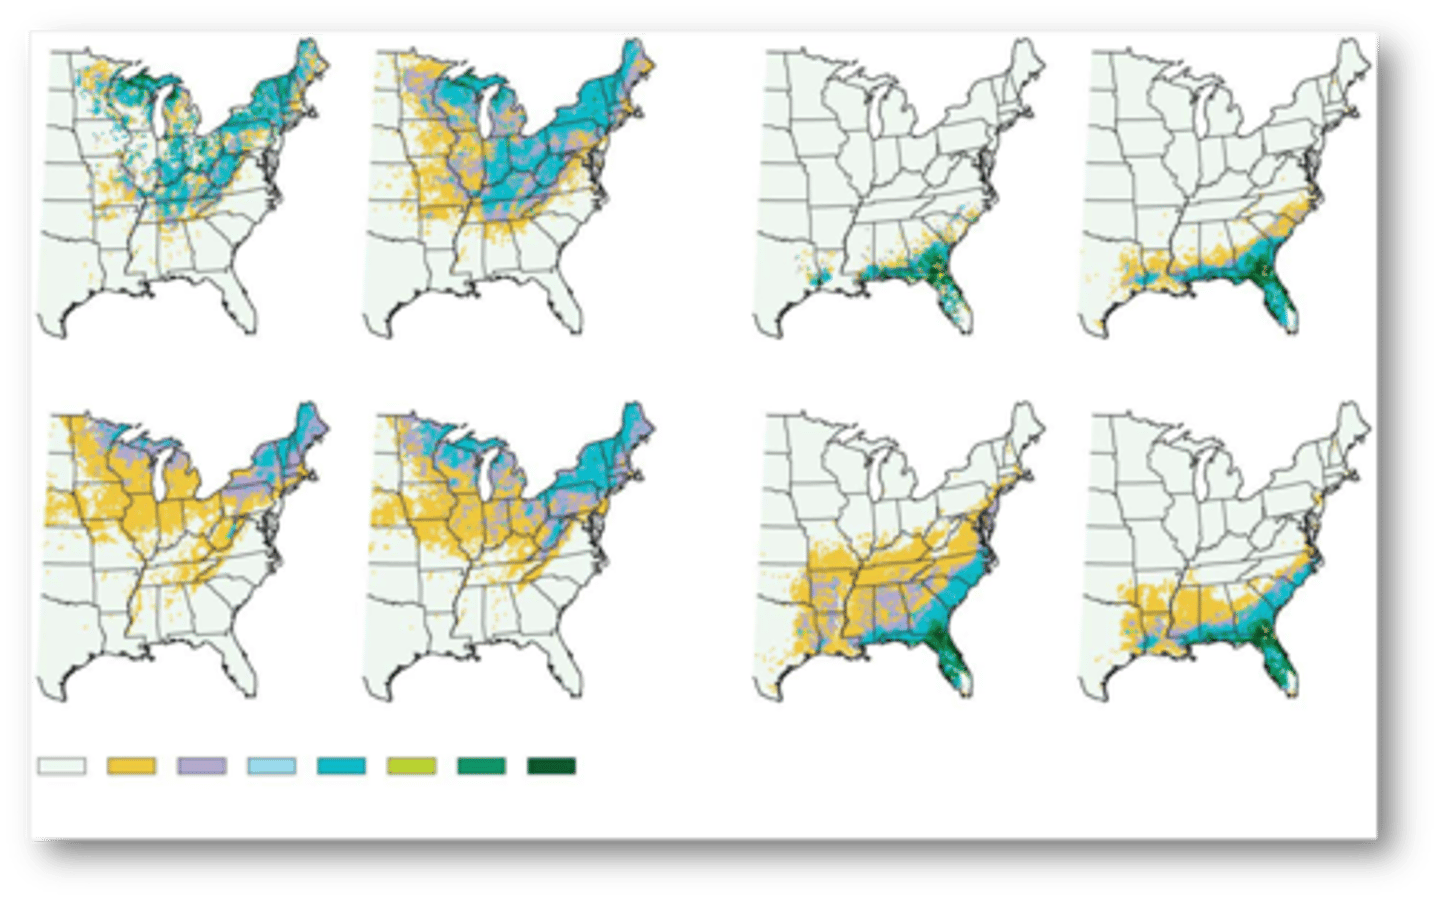
Researchers correlated the distribution of 134 tree species with a total of 36 environmental variables relating to climate, elevation, soils, and land use.
estimates of current and future distributions for
two tree species using high and low future emission estimates
combining individual species into groups based on
forest types, potential changes in the geographic distribution of forest communities could be examined.
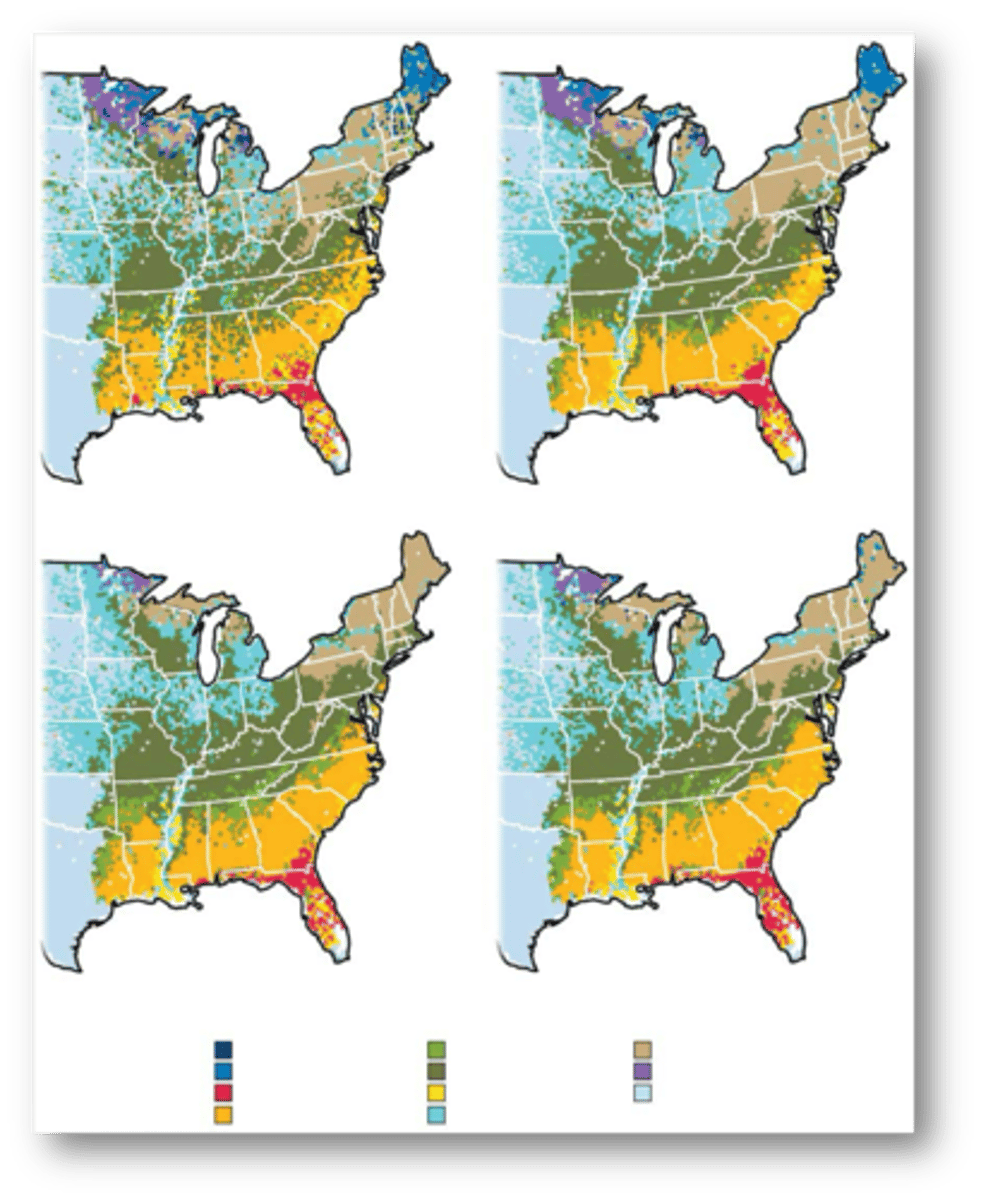
Canadian forest services analysis of the
entire North American continent for 130 tree species

bio climate models have been used to
used to evaluate possible impacts of climate change on animal taxa (birds, mammals, reptiles, amphibians).
Statistical models of the distributions of
147 bird species in the eastern U.S> using data from North American Breeding Bird Survey (BBS)
-----------------
- Used climate, elevation, tree species distribution to predict current bird distributions.
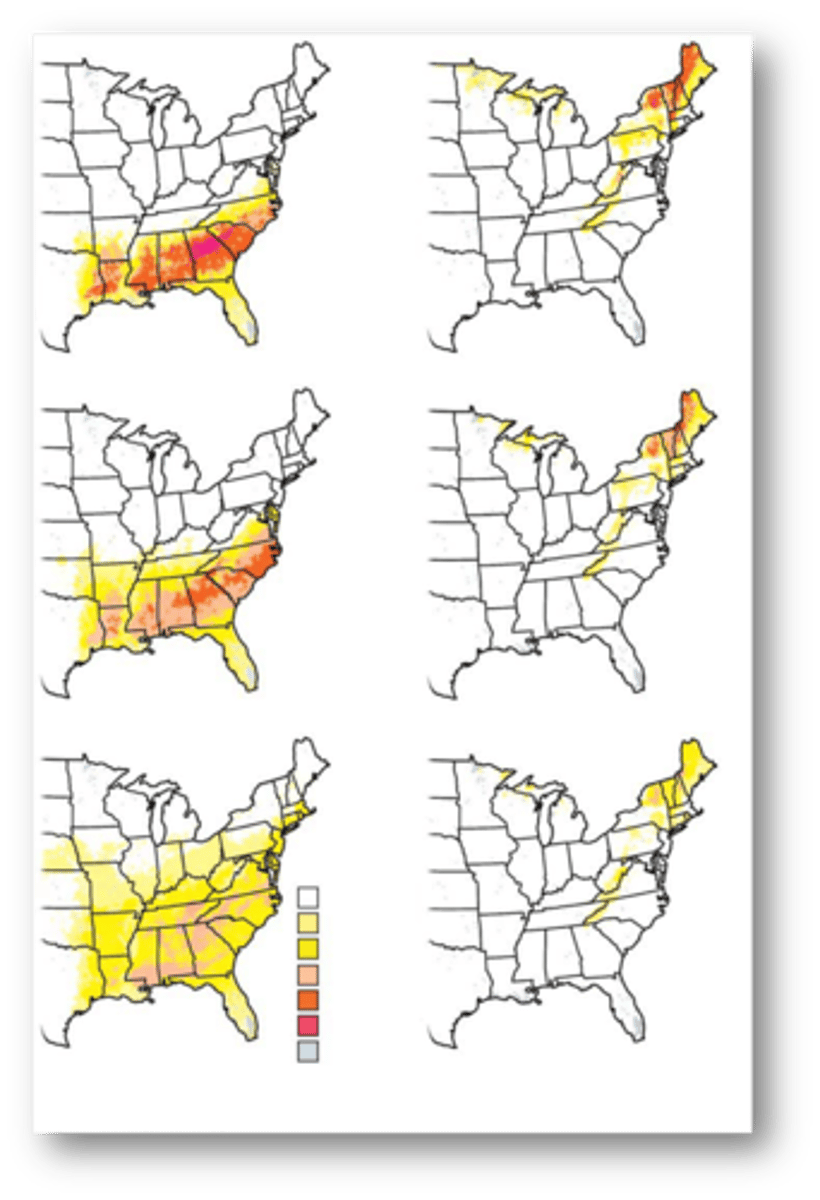
these statistical models were then used
to predict future distributions of these bird species under climate change