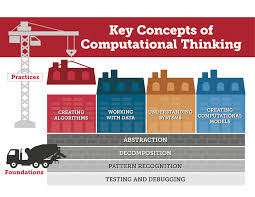
Computational Thinking
1/66
There's no tags or description
Looks like no tags are added yet.
Name | Mastery | Learn | Test | Matching | Spaced | Call with Kai |
|---|
No analytics yet
Send a link to your students to track their progress
67 Terms
Abstraction
Focusing on essential details while ignoring unnecessary information and complexities.

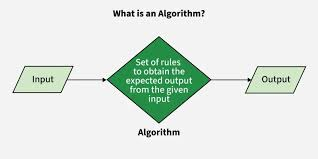
Algorithm
A set of rules used to generate calculations or perform problem-solving operations.

Algorithmic thinking
The process of approaching problems methodically by breaking them down into smaller parts.
Automation
Using technology to perform tasks or processes with minimal human intervention.

Bias
An imbalance in data that can cause data to be skewed toward a demographic group, which can harm an AI machine learning model.

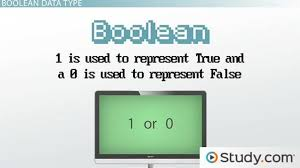
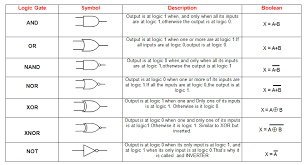
Boolean
A type of data with only one of two values possible.
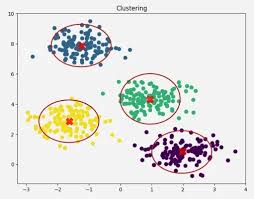
Clustering analysis
Groups similar data points into clusters or segments based on their characteristics or attributes.
Computational artifact
Any product created through computational processes or technologies.
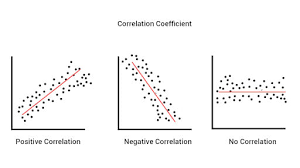
Correlation
A measure of connection between two points of data.
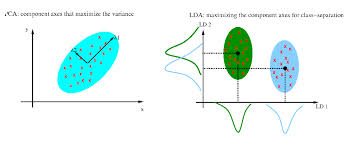
Covariance analysis
Analyzes how multiple variables help identify patterns of association or dependency between themselves and potentially other variables.
Chart
Visually represents data with graphical elements such as bars, lines, or pie slices.

Data
Information, facts, or figures that can be collected, stored, and analyzed.
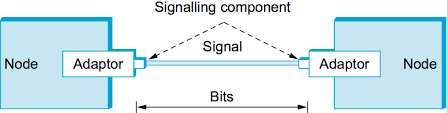
Data encoding
A method of representing data in a format that computers can process.
Data reliability
The extent to which data can be trusted to represent the true characteristics of the phenomenon or concept being measured.

Data Type
A characteristic of data, such as numeric, string, or date.

Data validity
The accuracy, reliability, and credibility of data in reflecting the true characteristics of the phenomenon or concept being measured.

Database
An organized collection of structured data or information stored in a manageable, retrievable, manipulatable format.
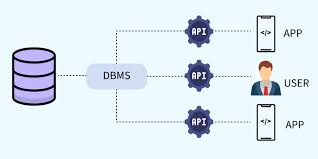
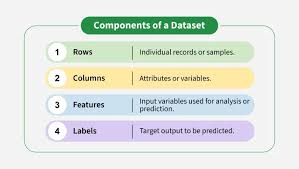
Dataset
A group of related data, often organized in a specific structure.
Decomposition
Breaking down a complex problem or task into smaller, more manageable subproblems.
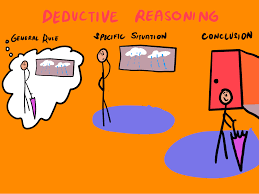
Deductive reasoning
A type of reasoning drawing conclusions from established premises or principles.
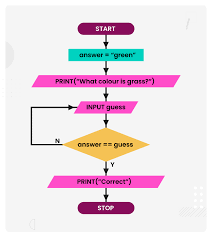
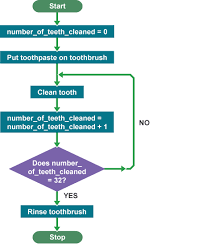
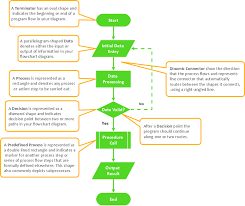
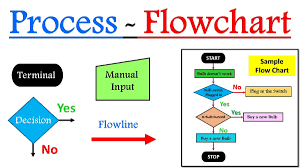
Flow charts
Graphical representations of processes, workflows, or algorithms.
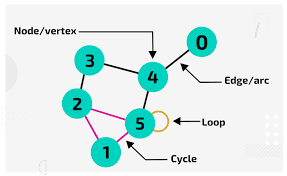
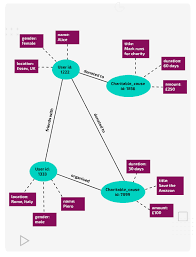
Graph
Visual representation of data using nodes and edges to depict relationships or networks.
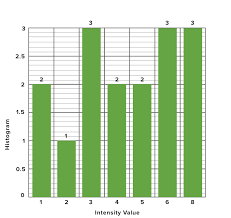
Histogram
A visualization of the distribution of numeric data.
Hypothesis
A proposed explanation or educated guess that can be tested.

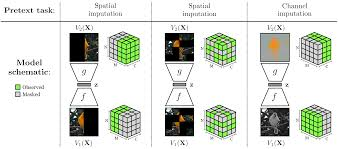
Imputation
Replacing missing data values with estimated values.
Incremental design
A design process breaking down the problem into smaller, more manageable components or features.
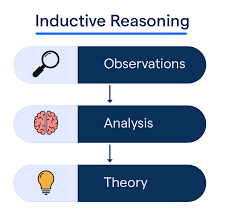
Inductive reasoning
A type of reasoning drawing conclusions from observations or patterns.
Infographic
A form of visualization that combines visual elements, text, and data to communicate complex information in a concise and visually appealing manner.

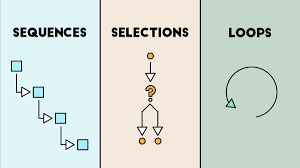
Iteration
The process of repeating a sequence of steps or operations multiple times until a certain condition is met.
Iterative design
A design process using several successive iterations of testing and improvement.

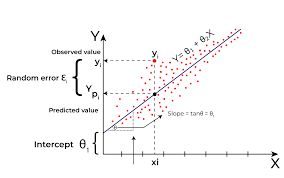
Linear Regression
A form of regression in which an outcome is a continuous variable, often a number.
List
An organized, ordered collection of items or elements.
Logical operator
A type of operator used to perform logical operations in algorithms. Often used alongside Boolean values.
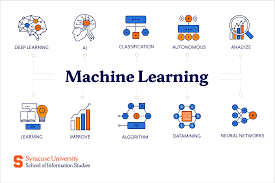
Machine learning
The development of algorithms and statistical models that can learn and improve without being explicitly programmed.
Max
The maximum value in a set of numeric data.
Mean
The average of a set of numeric data.
Median
The value closest to the midpoint of a set of numeric data.
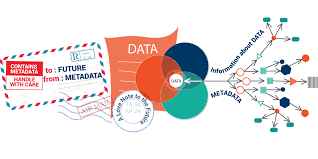
Metadata
Data containing details and context about other data.
Min
The minimum value in a set of numeric data.

Mode
The value appearing most often in a set of numeric data.

Model
A simplified representation of a real-world problem.
Natural Language Processing
A form of AI that reads data from text and images and can include speech recognition and object detection.
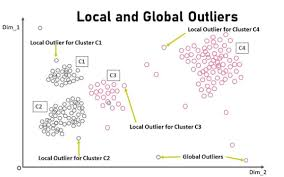
Outlier
A data point significantly outside the range of most of the rest of the dataset.
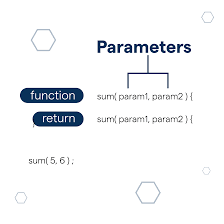
Parameter
An input value used to help train an algorithm.
Pattern
A reoccurring relationship or behavioral tendency in a dataset.
Prerequisites
Conditions, constraints, or dependencies that must be met before implementing a solution.
Problem statement
A statement defining the scope and objectives of the problem-solving process.
Process flow diagram
A type of diagram often used to visualize step-by-step processes.
Prototype
A preliminary version of a product or system used to test and evaluate its functionality, usability, and performance.
Pseudocode
High-level, language-independent descriptions of algorithms.
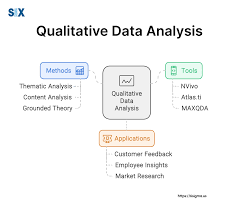
Qualitative
Data or information expressed non-numerically.
Quantitative
Numerically expressed data or information.
Range
The spread of a set of numeric data.

Regression
A model type that looks at the relationship between a dependent variable and one or more independent variables.
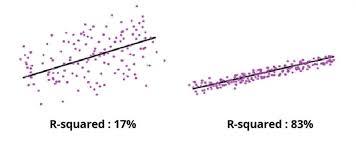
R-Squared
A value that measures the proportion of variance of a dependent variable that is predictable from independent variables.
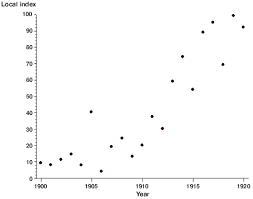
Scatter plots
A visualization plotting data points on a chart to analyze their relationships.
Schema
A structural representation of the organization, arrangement, and relationships of a dataset.
Selection statements
Programming constructs that enable a program to choose between different courses of action based on the evaluation of one or more conditions.
Spreadsheets
Software applications for organizing, manipulating, and analyzing data in a tabular format.
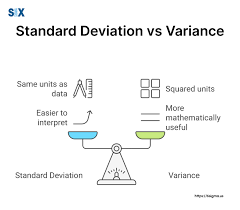
Standard deviation
A statistical measure of the amount of variation in a set of numeric values.
Sum
The combined values of a set of numeric data.

Surveys
Research instruments used to collect data and feedback from individuals or groups through questions.

Table
A method of storing data in a system containing columns and rows.
Trend
A general direction in which a variable or phenomenon is moving.

Validation
Checking the accuracy and completeness of data.
Variable
A placeholder for storing and manipulating data within algorithms.
Visualization
Analyzing and representing data and findings visually.