Chapter 3:3.2 Least Squares Regression Line
1/17
There's no tags or description
Looks like no tags are added yet.
Name | Mastery | Learn | Test | Matching | Spaced |
|---|
No study sessions yet.
18 Terms
Regression line
1) linear relationships between 2 quantitative variables
2) one of the variables helps explain or predict the other
ex: predict the value of y for a given value of x
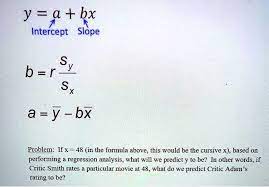
Equation of a regression line
ŷ= a + bx
ŷ meaning in ŷ= a + bx
y hat, the predicted value of the response variable
a meaning in ŷ= a + bx
y intercept, the predicted value of y when x = 0
b meaning in ŷ= a + bx
slope, amount by which y is predicted to change when x increases by 1 unit
Extrapolation
don’t make predictions using values of x that are much larger or smaller than those present in data
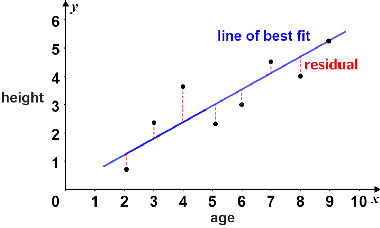
Residual
difference between an observed value of the response variable and the value predicted by the regression line
Residual formula
y - ŷ or observed y - predicted y
What does it mean if the residual is positive?
y value is c more that expected value
What does it mean if the residual is neg?
y value is c less than expected value
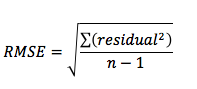
Standard deviation of the Residuals
measures typical distance between the actual y values and the predicted y values
Standard deviation of the residuals formula
see picture
Least squares regression line
regression line that minimizes the sum of the squared residuals
Residual plots
scatterplot of the residuals against the explanatory variable
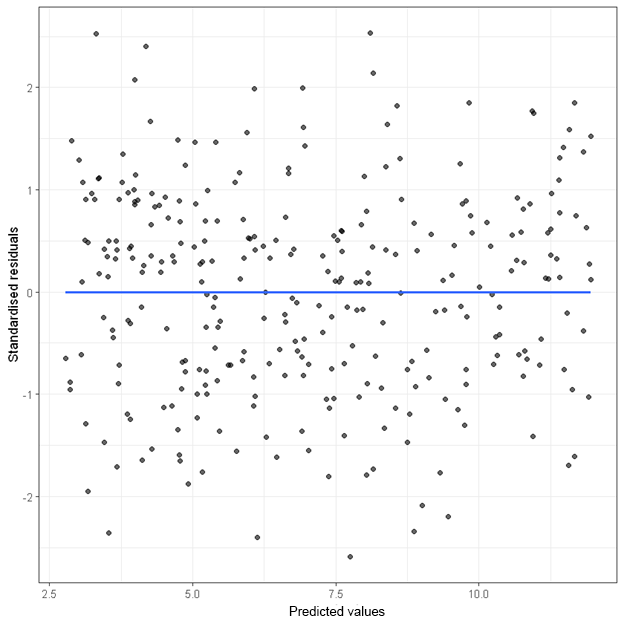
Residual plots should have…..
no obvious pattern left over
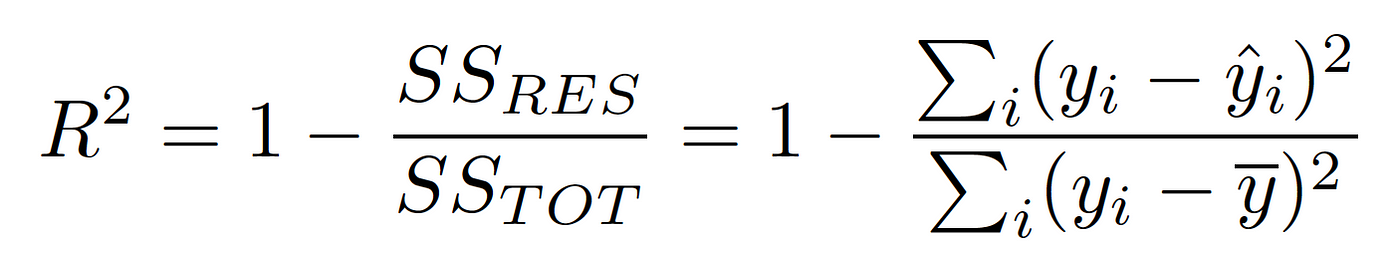
Coefficient of Determination r2
measures the % of the variability in the response variable that is accounted for by the least squares regression line
r2 equation
see picture
How to find regression line from mean
1) b = r(sy/sx)
2) a = ȳ - bx̄