Chapter 2: Exploring Data with Graphs and Numerical Summaries
1/34
There's no tags or description
Looks like no tags are added yet.
Name | Mastery | Learn | Test | Matching | Spaced | Call with Kai |
|---|
No analytics yet
Send a link to your students to track their progress
35 Terms
variable
any characteristic of an individual
categorical variable (w/ examples)
a variable that places an individual into one of several groups or categories (fav color, yes/no questions, phone #s, zip codes, ID #s)
quantitative variable (w/ examples)
a variable that takes numerical values for which arithmatic operations such as adding and averaging make sense (length, time, age, wage)
distribution
the overall pattern of variation of a variable, showing how often each value occurs
What are the key features to describe a quantitative variable (3)?
shape, center, variability/spread
modal category
a key feature of a categorical variable, notes which category has the largest frequency
nominal
a type of categorical variable that does not have an inherent ordering
ordinal
a type of categorical variable that can be ordered
discrete variable
a quantitative variable that can assume only a finite/countable number of variables (often whole numbers)
continuous variable
a quantitative variable that can assume an infinite number of values in one or more intervals
frequency table
a listing of the possible values for a variable, together with the number of observations for each value
What is the difference between using pie charts/bar graphs and histograms?
Use pie charts/bar graphs for categorical data. Use a histogram for quantitative data. The bars/sections are different categories, and therefore don’t touch (in a bar graph). The bars touch because the different bars are intervals.
outlier
an individual observation that falls outside the overall pattern of the graph
How can you describe a distribution?
unimodal, bimmodal, skewed right, skewed left, normal
unimodal distribution
a distribution with one major peak
bimodal
a distribution with two major peaks
skewed to the right
the right side of the graph extends much further than the left (the majority of the data is on the left, with outliers on the right)
skewed to the left
the left side of the graph extends much further than the right (the majority of the data is on the right, with outliers on the left)
mode
value/property that occurs most frequently in the data set
What are the different graphs presented in this unit?
pie charts, bar graphs, histograms, stem-and-leaf plots, dot plots, time plots, box plots
mean (and how it is measured)
balance point of the distribution (sum of measurements/#of measurements
median (and how to calculate it)
the middle number of an ordered data set ((n+1)/2)
resistant measure of center
less sensitive to extremely small/large measurements
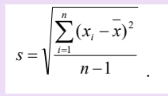
standard deviation
a statistical measure of data spread, indicating how much individual data points deviate from the mean
range
difference between the highest and lowest values in the data set
sample variance equation

standard variation equation
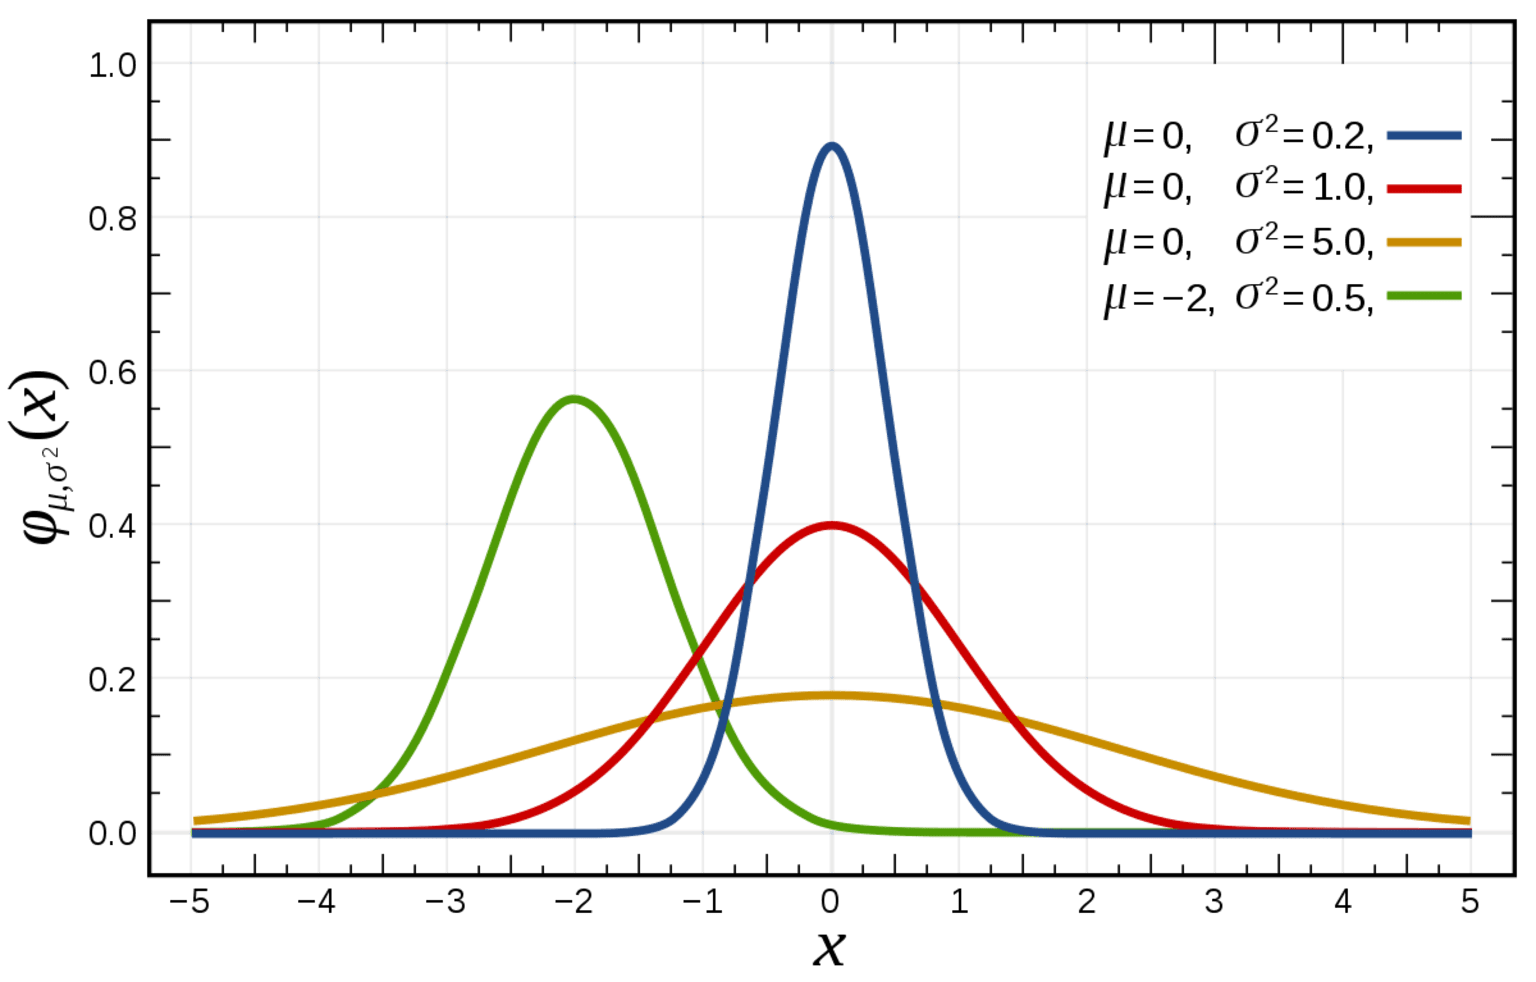
Empirical Rule
app. 68% of the data fall w/in 1 standard deviation of the mean
app. 95% of the data fall w/in 2 standard deviations of the mean
app 99.7% of the data fall w/in 3 standard deviations of the mean
What does Q1 mean?
25th percentile, lower quartile, median of the lower half of the data
What does Q2 mean?
50th percentile, median
What does Q3 mean?
75th percentile, upper quartile, median of the upper half of the data
interquartile range (and equation)
describes the spread of the middle half of the data (IQR=Q3-Q1)
When is an observation a potential outlier?
if it falls more than 1.5xIQR below the first quartile or above the third quartile
What is included in the five-number summary?
min, Q1, median, Q3, max
z-score (and equation)
distance between a given measurement x and the mean, expressed in standard deviations (z=(observation-mean)/standard deviation)