NDFS 475 Research Methods and Practices Study Guide
1/86
There's no tags or description
Looks like no tags are added yet.
Name | Mastery | Learn | Test | Matching | Spaced | Call with Kai |
|---|
No analytics yet
Send a link to your students to track their progress
87 Terms
· What is the definition of "research" from a scientific standpoint?
Systematic investigation to establish facts or principles.
Research Process
1.identify the research question
2. begin reviewing the literature
3. formulate a hypothesis
4. continue to review the literature and refine the question
5. develop a research approach
6. justify and fund the study
7. obtain approval (IRB), ethical considerations
8. execute the study
9. analyze and interpret the findings
10. formulate conclusions
11. communicate findings through peer review
12. incorporate significant and relevant findings into practice
look at people at a certain point in time
following same people over a certain period of time (can be longitudinal or correlational)
does intervening and implementing a new practice/supplement have an effect
cross sectional
cohort study
Intervention study
Practice-Based Research Cycle
Current practice → generate question → review literature → design and implement study → interpret data → determine relevance to practice → disseminate findings → apply new knowledge (cycles back through)
· What activities are important for professional development?
· How can quality journals/publications be evaluated?
· Be able to distinguish between and recognize research questions, hypotheses and purposes/objectives
Typical components of a hypothesis
Measurable
Specifies the population being studied
Specifies the type of relationship being examine
Defines the variableIdentifies a time frame
States the level of significance
Research questions are more broad than _________
specific research objectives
PICO/PICOT/PICOMT (in the research question)
Patient, population, or problem
Intervention
Comparison
Outcome
Type of question or methodology
Type of study (or time)
Hypothesis vs theory
H = A logical supposition/reasonable guess; an educated conjuncture to explain a relationship between two or more variables
Theory = An organized body of concepts, principles, and facts intended to explain a particular phenomenon. (much more developed than a hypothesis; you take a theory and test hypothesis against that theory)
· What is a null hypothesis vs an alternative hypothesis?
null = There is no difference between the variables. The most commonly used hypothesis for statistical analysis.H0; μ1 = μ2
Alternate = Opposite of a null hypothesisHa; μ1 ≠ μ2
· What are ordinal, nominal, interval, and ratio data?
Continuous scores that have a common unit of measure between each score and a true zero point (weight, length, speed, distance, calories)
Categorical scores that cannot be hierarchically ordered (gender, marital status, geographic area, ethnicity...)
Continuous scores that have a common unit of measurement between each score, but do not have a true zero point (temperature, time on a clock with hands, IQ or SAT scores)
Categorical scores that do not have a common unit of measurement between each score, but are ordered high to low (number of sit ups and then ranked; pain severity; likert)
Ordinal: Categorical scores that do not have a common unit of measurement between each score, but are ordered high to low (number of sit ups and then ranked; pain severity; likert)
Nominal Data = Categorical scores that cannot be hierarchically ordered (gender, marital status, geographic area, ethnicity...)
Interval data = Continuous scores that have a common unit of measurement between each score, but do not have a true zero point (temperature, time on a clock with hands, IQ or SAT scores)
Ratio data = Continuous scores that have a common unit of measure between each score and a true zero point (weight, length, speed, distance, calories) For example, zero weight means no weight at all.a
· What are dependent and independent variables?
Dependent = Outcome variables, the effect
Independent = held constant, controlled, known, cause, intervention
· Why is a literature review important?
Brings the researcher current on the topic
Forces reviewer to see what has been done
Helps refine the question
Brings to light appropriate methods for data collection and study design
Justifies the project
Helps you find out who the experts are in the field
Justifies national guidelines or evidence based practice statements
·Know the components and proper sequence of a traditional research report
Introduction (statement of the problem; purpose/objectives/aims; research questions; hypothesis)
Review of the literature
Methods
Results
Discussion/conclusion
References/appendices
· Understand and define the different categories of research
Introduction (statement of the problem; purpose/objectives/aims; research questions; hypothesis)
Review of the literature
Methods
Results
Discussion/conclusion
References/appendices
·Understand the different types of study designs (descriptive and experimental), and identify the basic strengths and weaknesses of each one
Descriptive Study Design
-Describe a population of interest
-Most common starting point and less money
Experimental
-To investigate cause-and-effect relationships by manipulating one or more variables.
Types of descriptive research
-Cross sectional
-surveillance
-case report
Repeated measurements of the instrument result in the same value within the same subject. There is good reproducibility/repeatability
Consistent answers every time. A method with high precision.
The instrument gives substantially the same value as the true value (the method is precise and has no bias). Usually reported as a percentage of the true error. [you may get the same lab value every time, but it may not be the correct value]
the instrument or test accurately measures what it is supposed to measure. It is reliable and has no bias (you measure what you thought you measured)
Accuracy
Precision
validity
Reliability
Precision
Reliability
Accuracy
validity
Measurement error. Inaccuracy due to random non systematic error (measurement error) or a systematic error (bias)
bias
the percentage of persons with a disease or condition who have a positive test result
'
the percentage of people without the disease or condition who have a negative test result
sensitivity
Specificity
sensitivity
Specificity
If false positives are unacceptable such as diagnosing celiac's or confirming a surgery-needing cancer, then ______ is more important
Specificity
The percentage of people with a positive test result who actually have the disease
Positive Predictive Value
Probability that subjects with a negative test truly do not have the condition.
Negative Predictive Value
Probability of a positive test result for a person with the disease divided by the probability of a positive test for a person without the disease
Likelihood Ratio (LR)
Receiver Operator Curves (ROC)
Probability of a positive test result for a person with the disease divided by the probability of a positive test for a person without the disease
I think its just like the likihood ratio
Voluntary consent created. Created 10 ethic statements.****
ethical code of conduct for research that uses human subjects
o Nuremberg Code
o Declaration of Helsinki
o National Research Act
o The Belmont Report
Nuremberg Code
created IRB
o Nuremberg Code
o Declaration of Helsinki
o National Research Act
o The Belmont Report
Declaration of Helsinkiz
creates national commission for protection of human subjects
Result of the Tuskegee Syphilis Study*
o Nuremberg Code
o Declaration of Helsinki
o National Research Act
o The Belmont Report
National Research Act
THREE BASIC PRINCIPLES
1. Respect for persons (autonomy);
2.Beneficence (maximize benefits and minimize harm);
3. Justice (burdens and benefits of research should be justly distributed
o Nuremberg Code
o Declaration of Helsinki
o National Research Act
o The Belmont Report
Belmont Report
· What is an Institutional Review Board (IRB) and what is its purpose?
Institutional Review Board protects the rights and welfare of human subjects involved in research activities; ensure 10 ethical directives are being followed
· What are the components of informed consent and when is it required?
6-8th grade reading level
Describes nature of study and what's involved (activities and duration)
Can withdraw at any time
Research contact info
Offer to provide results of study
List of potential risks or discomforts
Guarantee of confidentiality and anonymity
A signature line
· What are Type I and Type II errors in hypothesis testing?
Type I Error (False Positive): You reject the null hypothesis when it is actually true.
Type II Error (False Negative): You fail to reject the null hypothesis when it is actually false.
Type I Error: You think there's a wolf (reject the null), but there is no wolf (null was true).→ False alarm.
Type II Error: You don’t see a wolf (fail to reject the null), but a wolf is really there (null was false).→ Missed danger.
Collect data to follow trends on a population or subpopulation. Not the same cohort. Generally longitudinal. Data collected periodically. Can determine descriptive statistics (prevalence, incidence)
Population/surveillance studies
Strengths:
Identifies potential risk factors
Identifies the scope of a problem
Data is available to the public for future research
Weaknesses:Does not show causation
Snapshot of a group at one point in time. Can determine relationships, associations, correlations, provides descriptive statistics for a subpopulation
Cross-sectional studies
Strength: inexpensive and shows relationships
Weaknesses: Does not show causation
a type of retrospective study. Subjects who have condition or common characteristic are compared to a control group w/o the condition. Can determine relative risk, odds ratios; associations
Case control studies
Strengths:
Identifies risk factors
Outcomes of disease
Morbidity and mortality
Weaknesses:Does not show causation
Follow a group with a common interest, it is prospective and longitudinal but there is no intervention. Strongest type of observational study. Can test a causal relationship so has an analytical approach with a defined endpoint. Can determine incidence, association, relative risk, descriptive statistics, x^2, logistic regression [Framingham, Nurse's Health Study]
Cohort studies
Strengths:Longitudinal
Weaknesses:
-no controls
expensive
descriptive research to describe characteristics, attitudes, behavior, opinions, knowledge etc. in a certain population. Can determine relationships, correlations, descriptions
surveys
Strengths: Informative
Weaknesses:
Does not show causation
Self reported data
single or multiple observations but no formal study design or method to gather data
Case report
Strengths: generates a question or hypothesis
Weakness: doesn't prove anything
intervention is given to a single group, there is no control group. Suggests cause and effect.
Uncontrolled trials (quasi experiment)
Strengths: Less expensive than RCT's
Weaknesses: No control group, can't show causation
Intervention but not randomized, prospective. Suggests cause and effect; efficacy, magnitude of effect. Statistics include t-test, ANOVA, x^2, logistic regression, relative risk
Nonrandomized trials (quasi experiment)
Strengths: Less expensive than RCTs
Weaknesses:Not randomized so not able to extrapolate beyond study group
Control group, treatment group, intervention. Random assignment into groups, researchers manage the exposure to the treatment, prospective study, should be double blinded when possible. Can determine cause and effect, efficacy, or magnitude of an effect. Statistics include: t-test, ANOVA, x^2, logistic regression, relative risk
RCT
Strengths:provides clearest evidence of a causal effect
Weaknesses:ExpensiveComplex
Reject null hypothesis but it's true. Aka the - error (false positive)
Fail to reject the H0 (there is a difference but we didn't see it) so you accept the null hypothesis when there is a difference (false negative)
Typer 1 Error
.Aka the alpha error
- Reject H0 but it's true. Aka the alpha error
Typer II
-Fail to reject the H0 (there is a difference but we didn't see it)
S
predicting the number of subjects needed to detect an effect if there is one. Requires estimated acceptable variance (SD), desired alpha and beta level
power analysis
How do we reduce the risk of committing Type I and II errors?
Type I (alpha error) = decrease the alpha so .05 to .01
Type II (beta error) = increase the sample size
· How do we statistically evaluate measures of variance in data?
Range
Standard Deviation
Standard Error
Confidence intervals
Sampling Error
Probability that a population parameter will fall between two set values
error from having a sample rather than the whole population
average deviation of scores around the mean
range of scores from low to high
measurement of sampling error. the SD of sampling distribution. The larger the N, the smaller the SE. A larger SE means the less confidence one can be in the estimate representing the population.
Range = range of scores from low to high
Standard Deviation = average deviation of scores around the mean
sampling Error = error from having a sample rather than the whole population
Confidence intervals = Probability that a population parameter will fall between two set values
Standard Error = measurement of sampling error. the SD of sampling distribution. The larger the N, the smaller the SE. A larger SE means the less confidence one can be in the estimate representing the population.
· What is the difference between descriptive and inferential statistics?
Descriptive Statistics = Describes your population and describes findings of your subjects
Inferential Statistics = Make inferences from YOUR sample about the broader population (parametric versus nonparametric statistics)
· When do we use parametric statistics and what are the major types of parametric statistics? When and how are they used?
Your data is numeric
Your data is normally distributed
The variances are equal
You want more statistical power than non-parametric tests offer
· When do we use non-parametric statistics and what are the major types of parametric statistics? When and how are they used?
Parametric stats
-normally distributed (bell shape graph)
-quanitative data
- Use probability sampling (randomized sampling)
- Interval or ratio scale
Nonparametric stats
- non-normal distributed
-Cateforical data
-less powerful
-requires larger sample size
types of parametric statistics
t-test; paired t-test; Chi squared; ANOVA; correlation; regression
looking at the difference between 2 groups
t-test for categorical data x^2
same as t-test but with more than two groups
ANOVA when there are covariant/covariables involved
within the same person at two times
Paired t-test
T test
Chi sqaured test
ANOVA
ANOCOVA
T-test = looking at the difference between 2 groups
paired t-test = within the same person at two times
Chi squared= t-test for categorical data x^2
ANOVA= same as t-test but with more than two groups
ANCOVA = ANOVA when there are covariant/covariables involved
When to use non-parametric statistics
if we have skewed data or categorical (nominal or ordinal) data. it's less powerful and requires a larger sample size.
Types of non-parametric statistics
sign test; mann-whitney U; Kruskal-Wallis; Wilcoxon matched-pair signed rank test; chi-square goodness of fit test; odds ratio; fisher's exact test
What types of study designs are epidemiological
Disease frequency: cross sectional or surveillance
Risk factors: cohort, case control, or ecological studies
Qualitative Research Methods
Interviews – One-on-one conversations to explore experiences and opinions
Focus Groups – Group discussions to gather diverse perspectives
Observations – Watching behavior in natural settings (e.g., ethnography)
Document Analysis – Analyzing texts, media, or artifacts for themes
non-numerical data
Qualitative research Thematic, Narrative, Phenomenology, Grounded Theory, Case studies
find pattern from narrative/life stories from people
understand a broad process* about a large topic
help researchers explain what happens when people experience something common
flexible so unstructure, find themes, and make large data condensed
to understand real life stuff
Thematic analysis = flexible so unstructure, find themes, and make large data condensed
Narrative Research = find pattern from narrative/life stories from people
Phenomenology = help researchers explain what happens when people experience something common
Grounded theory = understand a broad process* about a large topic
Case studies = to understand real life stuff
· What is descriptive research and when it is used?
Research providing a detailed account of characteristics.
· What are some cautions about descriptive (observational) research? What are their strengths
· What are incidence, prevalence and mortality rate?
total number of deaths/ total number of people at risk per unit of time
reports the proportion of a population that is affected by a certain disease or condition at a given point of time (as a %).
describes disease frequency in a population (number of cases per 100,000 per ye
Incidence Rate= describes disease frequency in a population (number of cases per 100,000 per year
Prevalence Rate = The total number of cases (both new and existing) of a disease in a population at a given point or period in time so
- Prevalence= All cases (new + existing)/Total population
Mortality Rate = total number of deaths/ total number of people at risk per unit of time (or population)
rate of disease with factor present/ Rate of disease with factor absent
The amount of risk that can be attributed to the exposure.
the actual risk of an occurrence;
The difference in absolute risk between the control and treatment groups.
an event in the exposed group to the odds in the unexposed group.
o Relative risk/odds ratios
o Absolute risk
o Absolute risk reduction
o Attributable risk
.
Absolute risk = the actual probability of an event occurring (baby basics)
Relative risk = rate of disease with factor present/ Rate of disease with factor absent
(comparing risk in 2 groups)
Odds ratio = the ratio of the group expose / unexposed (case control study so lookin backward)
Absolute Risk Reduction = The difference in absolute risk between the control and treatment groups. (how much did the treatment actually work)
Attributable risk = The amount of risk that can be attributed to the exposure.
Risk in Exposed−Risk in Unexposed then divide by total
rate of disease with factor present/rate of disease with factor absent.
If RR is greater than 1, means a positive association.
RR = 1 →
RR > 1 →
RR < 1 →
Relative risk (cohort studies)
RR = 1 → No difference
RR > 1 → Increased risk in exposed
RR < 1 → Decreased risk in exposed
an event in the exposed group to the odds in the unexposed group.
RR = 1 →
RR > 1 →
RR < 1 →
Odds ratio or relative odds
an estimate of relative risk that is calculated when the disease is rare. used with case control studie
RR = 1 → No difference
RR > 1 → Increased risk in exposed
RR < 1 → Decreased risk in exposed
The actual probability of an event occurring in a group.
the chance a specific outcome will occur so 12% of actually getting covid
Absolute risk
Difference in risk between two groups.
Absolute Risk Reduction
ARR=Risk in Control−Risk in Treatment
amount of risk that can be assigned to a particular factor
Tells how much of a disease is due to a specific exposure
How much more risk do expose people have compared to unexposed people
Risk in Exposed = Proportion of people in the exposed group who got the disease.
Risk in Unexposed = Proportion of people in the unexposed group who got the disease.
Attributable Risk
Risk in Exposed−Risk in Unexposed then divide by total
Cohort
How do you interpret a confidence intervals
1
>1
<1
1 If it includes 1 there is no association
>1 postive association so outcome is more likely in the exposed cohort
<1 outcome is less likely in the cohort
look at multiple studies and put them together, but not statisticall
combine the results of several studies and do one big statistical analysis
systematic review
Meta analysis
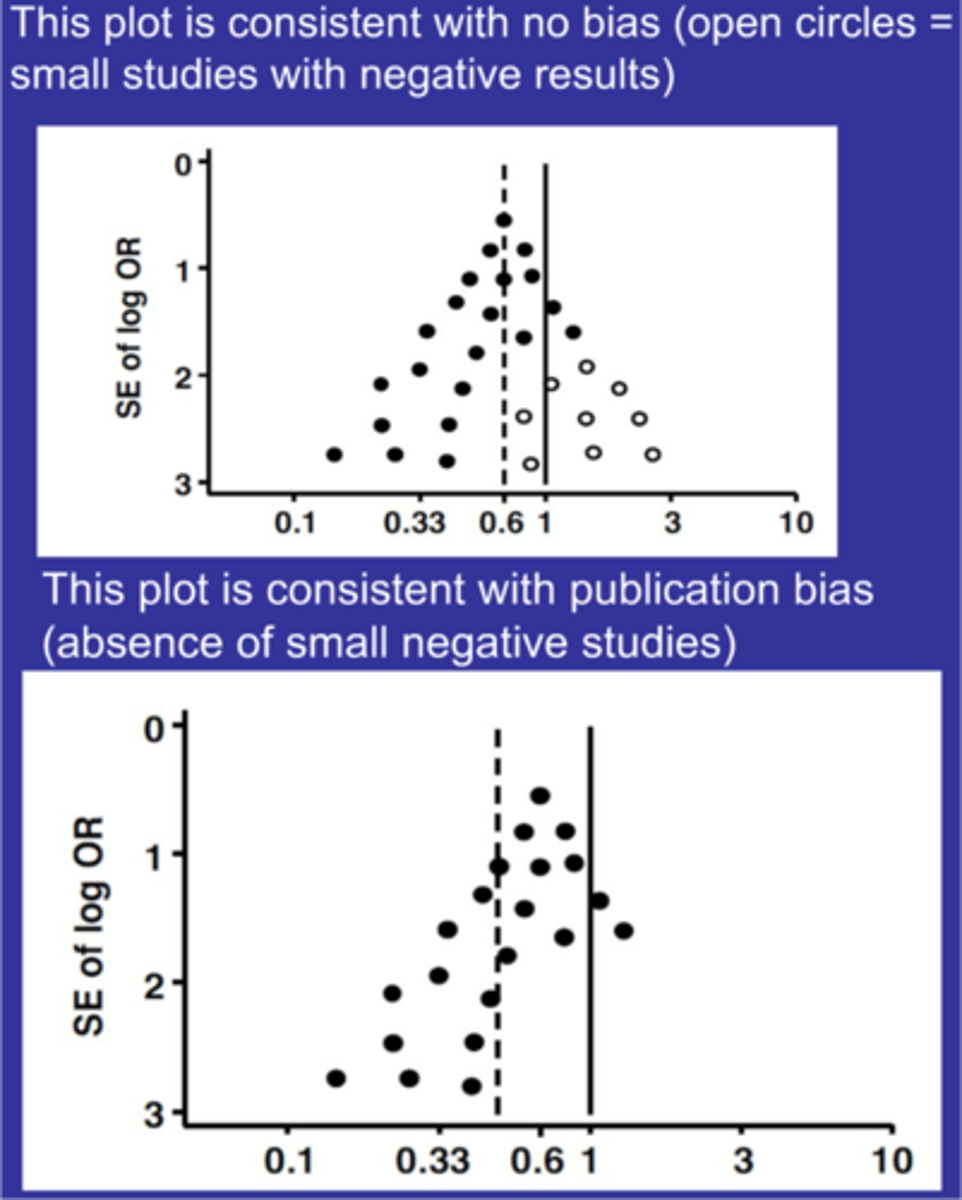
What does the picture represent with publication bias
publication bias
Top = no publication bias
Bottom = publication bias
open circles = non significant studies
sampling methods
every member has an equal shot of being selected
a population is divided by strata and each person in the strata has an equal chance of being selected
= an equal percentage of each strata is selected
clusters within a population are randomly selected then people are randomly selected within cluster
selecting the sample in a predetermined systemic way (every 10th person)
using only the people that responded to survey or first 20 people you see
Selection of the sample that should replicate the population and once it's met you stop sampling
pick cases that are judged to be typical of a population in which one is interested
convenience =
- Stratified random =
- Simple random =
- Quota =
- Proportional stratified random
- cluster random =
- Systematic random =
- Purposive =
Randomization
- Simple random = every member has an equal shot of being selected
- Stratified random = a population is divided by strata and each person in the strata has an equal chance of being selected
- Proportional stratified random = an equal percentage of each strata is selected
- cluster random = clusters within a population are randomly selected then people are randomly selected within cluster
- Systematic random = selecting the sample in a predetermined systemic way (every 10th person)
Not random
convenience = using only the people that responded to survey or first 20 people you see
- Quota = Selection of the sample that should replicate the population and once it's met you stop sampling
- Purposive = pick cases that are judged to be typical of a population in which one is interested
· Understand the components of each step in the survey process
1. use research question and literature
2. determine who will be sampled
3. create and test questionnaire
4. contact respondents and collect data
· What are the different types of survey questions?
categorical (yes/no)
Ordinal (drop down/ ranking)
interval (body wt, temp)
open ended
partially closed end
· What are some of the pitfalls in survey questions? Leading questions, double barreled, overlap, loaded question
what is your favorite candy
Should smart parents allow candy in the house
10-20
20-30
what do you dislike about fast food and mcdonalds
Leading Questions: These push people toward a particular answer
(Should smart parents allow candy in the house )
Loaded question: forces a response that doesn't reflect what the respondent would do (what is your favorite candy)
Overlap:
Double barreled questions: Asking two things in one question.
· What are some of the tools and methods to review a survey before sending it out?
cognitive interview
reliability testing
· What is the difference between a randomized control trial (RCT), non-randomized trial, and uncontrolled trial? What are the different types of study designs?
RCT = randomization
Non random = no random
Uncontrolled trial = no comparison (everyone gets the same experiment
observational vs experimental studies
In observational
- cohort
-cross sectional
- case control
In experimental studies
- RCT
-Non randomized
-uncontrolled trial
· What is intent to treat (ITT) and why is it important?
How is it different from per protocol
data from all the subjects who began the study should be analyzed regardless of whether they dropped out.
Important = addresses the efficacy and adherence of a treatment
per protocol = only analyze data on subjects who completed the study
· What is the importance of the number needed to treat (NNT)?
number of patients who need to be treated in order to prevent one bad or induce one beneficial outcome. Helps define the line of benefit vs. cost
The number of people who need to receive a treatment in order to prevent one additional bad outcome (like a heart attack, stroke, or death)
Heterogenity
If P=.20 ? & If I^2 is greater than 50% ? in heterogenity
measures how different the studies are from each other
If P=.20 = not significant so good there is no heterogenity
If I^2 is greater than 50% then there is heterginnity so then the P would be less than .005
If overall P is less than .005 then there is a significant difference
· What does a Kaplan-Meir curve show? Know how to read one.
Time to event or the probability of survival
attrition
When a participant drops out, or fails to complete, all parts of a study.
· What are conclusion statements and grading evidence?
??
A conclusion statement is a clear summary of what the evidence shows about a particular topic, question, or intervention.
Grading evidence is the process of evaluating the quality, consistency, and strength of scientific evidence that supports a conclusion.
· In judging existing evidence on the benefits or harms of an intervention, what is the hierarchy of study designs for evidence-based guidelines?
Systematic Reviews and Meta-Analyses
Randomized Controlled Trials (RCTs)
Cohort Studies
Case-Control Studies
Case Series
clincal experience
· Many organizations have their own grading criteria to evaluate studies in developing a guideline; however, there is a major common thread in all of them, please review each guideline to get an idea of common threads
· Why is it sometimes difficult to have strong evidence-based nutrition guidelines?
· What are the different avenues to publish data?
Technical reports,
theses/dissertations,
manuscript for publication in peer reviewed journals,
published abstracts,
posters,
oral presentations
· Review some of the examples of grammar, punctuation, units of measure and style we discussed in class.