PINNACLE - Management Accounting
1/167
Earn XP
Description and Tags
Combined set
Name | Mastery | Learn | Test | Matching | Spaced |
|---|
No study sessions yet.
168 Terms
Direct Materials
Raw materials that can be physically and directly associated with the finished product during the manufacturing process.
Indirect Materials
Do not physically become part of the finished product.
Cannot be traced because their physical association with the finished product is too small in terms of cost.
Companies account for indirect materials as part of manufacturing overhead.
Direct Labor
The work of factory employees that can be physically and directly associated with converting raw materials into finished goods.
Indirect Labor
Labor with no physical association with the finished product, or it is impractical to trace the costs to the goods produced. It is classiffied as manufacturing overhead.
Manufacturing Overhead
Costs that are indirectly associated with the manufacture of the finished product, including indirect materials, indirect labor, depreciation on factory buildings and machines, insurance, taxes, and maintenance on factory facilities.
Finished Goods
Shows the cost of completed goods on hand.
Work in Process
Shows the cost applicable to units that have been started into production but are only partially completed.
Raw Materials
Shows the cost of raw materials on hand.
Cost
The monetary amount of the resources given up or sacrificed to attain some objective such as acquiring goods and services.
Cost Behavior
Describes how a cost behaves or changes as the amount of cost driver changes.
Cost Pool
An account in which variety similar costs are accumulated prior to allocation to cost objects. It is a group of costs associated with an activity.
Example: overhead control account
Cost Object
The intermediate and final disposition of cost pools (e.g., product, job, process).
Cost Driver
A factor that causes a change in the cost pool for a particular activity. It is used as a basis for cost allocation; any factor or activity that has a direct cause-effect relationship.
Activity
Any event, action, transaction, or work sequence that incurs costs when producing a product or providing a service.
Cost Behavior Analysis
The study of how specific costs respond to changes in the level of business activity.
Activity Index
Identifies the activity that causes changes in the behavior of costs. With this, companies can classify into three categories: variable, fixed, or mixed.
Variable Costs
Costs that vary in total directly and proportionately with changes in the activity level but remain the same per unit at every level of activity.
Fixed Costs
Costs that remain the same in total regardless of changes in the activity level, but vary per unit inversely with activity.
Example: property taxes, insurance, rent, supervisory salaries, and depreciation on buildings and equipment
Mixed Costs
Costs that contain both a variable and a fixed element; change in total but not proportionately with changes in the activity level.
Relevant Range
The range of activity over which a company expects to operate during the year, where cost behavior is assumed to be linear (straight-line)
High-Low Method
A method where the fixed and variable elements of mixed costs are computed from two data points: the high and low periods as to activity level or cost driver.
Scattergraph Method
A method where various costs (the dependent variable) are plotted on a vertical line (y-axis) and measurement figures (cost drivers or activity levels) are plotted on a horizontal line (x-axis). A straight line is drawn through the points and, using this line, the rate of variability and the fixed cost are computed.
Least Squares (Regression Analysis) Method
A statistical technique that investigates the association between dependent and independent variables. This method determines the line of best fit for a set of observations by minimizing the sum of the squared deviations between cost line and the data points.
Correlation Analysis
Used to measure the strength of linear relationship between two or more variables.
Coefficient of Correlation (r)
Measures the relative strength of linear relationship between two variables, ranging from -1.0 to +1.0.
Coefficient of Determination (r2)
The proportion of the total variation in Y that is accounted for by the regression equation, regardless of whether the relationship between x and y is direct or inverse. It is a measure of ‘goodness of fit’ in the regression. The higher the r2, the more confidence one can have in the estimated cost formula.
Classfication of Manufacturing costs
Direct materials
Direct labor
Manufacturing overhead
Manufacturing costs in financing statements
The principal differences in a manufacturer’s financial statements occur in the cost of goods sold section in the income statement and the current assets section in the balance sheet.
Manufacturer’s compute cost of goods sold by adding the beginning finished goods inventory to the cost of goods manufactured and substracting the ending finished goods inventory.
To determine the cost of goods manufactured, companies add the cost of the beginning work in process to the total manufacturing costs for the current year to find the total cost of work in process for the year. Companies then substract the ending work in process from the total cost of work in process to find the cost of goods manufactured.
The balance sheet for a manufacturing company may have three inventory accounts: Finished goods, Work in process, and Raw materials
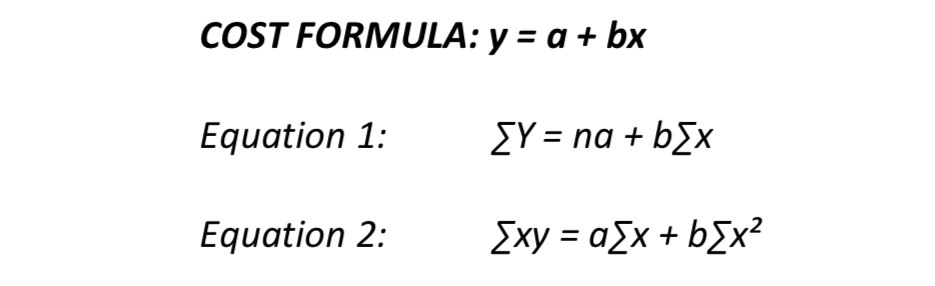
Formula for Least Squares (Regression Analysis) Method
y = a + bx
Where:
“y” denotes total costs. It is called the dependent variable because it is dependent on the value of another variable, the activity level x.
“a” is an estimate of the fixed cost.
“b” is an estimate of the variable cost per unit of activity.
The correlation between two variables can be seen by drawing a scatter diagram
If the points seem to form a straight line, there is a high correlation.
If the points form a random pattern, there is a low correlation or no correlation at all.
If r = -1.0 in Coefficient of Correlation
There is perfect inverse linear relationship between x and y.
If r = 0 in Coefficient of Correlation
There is no linear relationship
If r = +1.0 in Coefficient of Correlation
There is perfect direct relationship between x and y
Cost-Volume-Profit (CVP) Analysis
The study of the effects of changes in costs and volume on a company's profits. It is important in profit planning. It is useful in settling selling prices, determining product mix, and maximizing use of production facilities.
CVP analysis considers the interrelationships among the following component
Volume or level of activity
Unit selling prices
Variable cost per unit
Total fixed costs
Sales mix.
The following assumptions underline each CVP analysis
The behavior of both costs and revenues is linear throughout the relevant range of the activity index
Costs can be classified accurately as either variable or fixed
Changes in activity are the only factors that affect costs
All units produced are sold
When more than one type of product is sold, the sales mix will remain constant. (The percentage that each product represents of total sales will stay the same).
Contribution Margin
The amount of revenue remaining after deducting variable costs. It can be expressed as a per unit amount or as a ratio
Contribution Margin per Unit formula
Unit Selling Price – Unit Variable Costs.
Contribution Margin Ratio formula
Contribution Margin per Unit ÷ Unit Selling Price
Contribution margin ÷ Sales
Break-even Point
The company will realize no income but will suffer no loss. Useful to management when it decides whether to introduce new product lines, change sales price on established products, or enter new market areas.
Break-even Point in Units formula
Fixed Costs ÷ Contribution Margin per Unit
Fixed Costs / (Unit selling price - Unit variable cost)
Break-even Point in Peso formula
Fixed Costs ÷ Contribution Margin Ratio
Total Variable Cost + Total Fixed Cost
Required Sales in peso formula
(Fixed Costs + Target Net Income) ÷ Contribution Margin Ratio
Required Sales formula
Variable Costs + Fixed Costs + Target Net Income.
Margin of Safety
The difference between actual sales and break-even sales; indicates the maximum amount by which sales could decline without incurring a loss.
Sales Mix
The relative proportion in which each product is sold when a company sells more than one product. It is important to managers because different products often have substantially different contribution margins and break-even points.
BEP Units (multiple products) formula
Fixed Costs / Weighted Average CM per unit
BEP Peso Sales (multiple products) formula
Fixed Costs / Weighted Average CM Ratio
Degree of Operating Leverage (DOL) formula
Contribution Margin ÷ Profit before tax
Sensitivity Analysis
A 'what if' technique that examines the impact of changes on any variables. For example, changes in prices, variable costs, and fixed costs on expected profits.
Target income
The income objective set by management.
CVP income statement
Classifies costs and expenses as variable or fixed. It also reports contribution magin in the body of the statement.
Break-even sales in units
Can be computed for a mix of two or more products by determining the weighted-average unit contribution margin of all the products. Computed by dividing fixed costs by the weighted-average unit contribution margin.
Weighted-average unit contribution margin
Computed by adding the products of Product A’s unit contribution margin x its percentage of sales and Product B’s unit contribution margin x its percentage of sales.
Break-even point in peso
Computed by dividing fixed costs by the weighted-average contribution margin ratio.
Weighted-average contribution margin ratio
Computed by adding the products of Division A’s contrbution margin ratio x its percentage of sales and Division B’s contribution margin ratio x its percentage of sales
Degree of operating leverage (DOL)
Provides a measure of a company’s earnings volatility and can be used to compare companies. Computed by dividing total contribution margin by net income
Unit sales with target profit formula
(Fixed costs + Profit) ÷ Contribution margin per unit
Peso sales with Target return on sales formula
Fixed Costs ÷ (CM ratio - Return on Sales)
Profit must be expressed before tax formula
Profit after tax ÷ (100% - tax rate)
Margin of safety formula
Sales - Break-even sales
Margin of safety ratio formula
Margin of safety ÷ Sales
Change in % profit before tax is equal to
Change in % sales x Degree of operating leverage
Product Costs
Costs that are a necessary and integral part of producing the finished product; they do not become expenses until the company sells the finished goods inventory.
Period Costs
Costs that are matched with the revenue of a specific time period rather than included as part of the cost of a salable product; includes selling and administrative expenses and companies deduct them from revenues in the period in which they are incurred
Absorption Costing
A costing method that includes all manufacturing costs (direct materials, direct labor, and both variable and fixed manufacturing overhead) in the cost of a unit of product; also called Full Costing and Conventional Costing. Treats fixed manufacturing overhead as a product cost.
When units produced exceed units sold, net income under this costing method will show a higher net income than variable costing. Companies must report financial information using GAAP, which requires this for the costing of inventory for external reporting purposes.
Variable Costing
A costing method that includes only variable manufacturing costs (direct materials, direct labor, and variable manufacturing overhead) in the cost of a unit of product; also called Direct Costing. Treats fixed manufacturing overhead as a period cost.
Net income computed under this costing method is unaffected by changes in production levels; is consistent with cost-volume-profit analysis and incremental analysis. Net income computed under variable costing is closely tied to changes in sales and provides a more realistic assessment of the company’s success or failure. The presentation of fixed and variabe cost components on the variable costing income statement makes it easier to identify these costs and understand their effect on the company’s results.
Selling and Administrative Expenses
Under both absorption and variable costing, these are period costs.
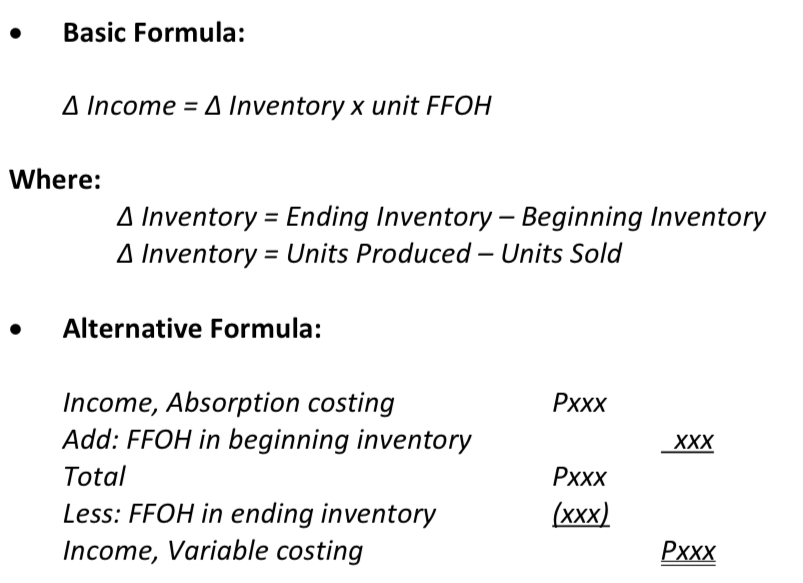
∆ Inventory
Ending Inventory - Beginning Inventory or Units Produced - Units Sold
∆ Income
∆ Inventory x unit FFOH or Income, Absorption costing + FFOH Beginning inventory - FFOH ending inventory
Budget
A formal written statement of management’s plans for a specified time period, expressed in financial terms.
Role of Accounting during the Budgeting process
Provide historical data on revenues, costs, and expenses
Express management’s plans in financial terms
Prepare periodic budget reports.
Benefits of Budgeting
It requires all levels of management to plan ahead
It provides definite objectives for evaluating performance
It creates an early warning system for potential problems
It facilitates the coordination of activities within the business
It results in greater management awareness of the entity’s overall operations
It motivates personnel throughout the organization.
In order to be effective management tools, budgets must be based upon
A sound organizational structure in which authority and responsibility are clearly defined.
Research and analysis to determine the feasibility of new products, services, and operating techniques
Management acceptance which is enhanced when all levels of management participate in the preparation of the budget, and the budget has the support of top management.
Continuous Twelve-Month Budget
Results from dropping the month just ended and adding a future month.
Zero-Based Budgeting
A budget and planning process in which each manager must justify a department’s entire budget from a base of zero every period.
Life-Cycle Budget
Estimates a product’s revenues and expenses over its entire life cycle beginning with research and development, proceeding through the introduction and growth stages, into the maturity stage, and finally, into the harvest or decline stage.
Kaizen Budgeting
Assumes the continuous improvement of products and processes, usually by way of many small innovations rather than major changes
Budget Committee
Coordinates the preparation of the budget and usually includes the president, treasurer, chief accountant (controller), and management personnel from each major area of the company.
Long-Range Planning
Involves the selection of strategies to achieve long-term goals and the development of policies and plans to implement the strategies. Contain considerably less detail than budgets.
Master Budget
A set of interrelated budgets that constitutes a plan of action for a specified time period.
Sales Budget
The starting point in preparing the master budget.
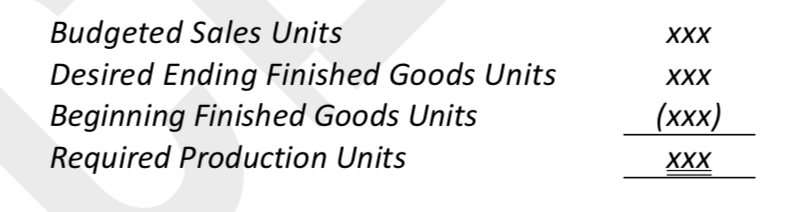
Production Budget
Shows the units that must be produced to meet anticipated sales. Provides the basis for the budgeted costs for each manufacturing cost element.
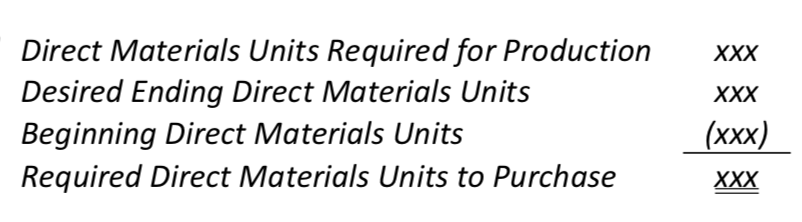
Direct Materials Budget
Shows both the quantity and cost of direct materials to be purchased.
Direct Labor Budget
Contains the quantity (hours) and cost of direct labor necessary to meet production requirements. Critical in maintaining a labor force that can meet the expected levels of production.
Manufacturing Overhead Budget
Shows the expected variable and fixed manufacturing overhead costs for the budget period.
Selling and Administrative Expense Budget
Projects anticipated selling and administrative expenses for the budget period, classifying expenses as either variable or fixed. This budget is also used in preparing the budgeted income statement and the cash budget.
Budgeted Income Statement
Indicates the expected profitability of operations for the budget period. Provides the basis for evaluating company performance.
Cash Budget
Shows anticipated cash flows and contains sections for cash receipts, cash disbursements, and financing. This budget is ofeten considered to be the most important financial budget.
Flexible Budget
Projects budget data for various levels of activity. A series of static budgets at different levels of activity.
Management by Exception
Top management’s review of a budget report focused either entirely or primarily on differences between actual results and planned objectives.
Production requirements are determined from the following formula
Budgeted sales units + Desired ending finished goods unit - Beginning finished goods units
The quantities of direct materials are derived from the following formula
Direct materials units required for production + Desired ending direct materials units - Beginning direct materials units
Desired ending inventory
A key component in the budgeting process; inadequate inventories could result in temporary shutdowns of production.
Flexible budget reports
Are appropriate for evaluating performance since both actual and budgeted costs are based on the actual activity level achieved.
For management by exception to be effective, the usual criteria are
Materiality and Controllability of the item
Materiality
Usually expressed as a percentage difference from budget
Controllability of the item
Exception guidelines are more restrictive for controllable items than for items the manager cannot control.
Relevant Costs
Future costs that are expected to be different under each alternative course of action.