Business Analytics - Descriptive Statistics
1/75
Earn XP
Description and Tags
pg - 24 - 68
Name | Mastery | Learn | Test | Matching | Spaced | Call with Kai |
|---|
No analytics yet
Send a link to your students to track their progress
76 Terms
Data
The facts and figures collected, analyzed, and summarized for representation and interpretation.
Variable
A characteristic or a quantity of interest that can take on different values
Observation
Set of values corresponding to a set of variables
Variation
Dfference in a variable measured over observations
Descriptive analytics
Collect and analyze data to gain a better understanding of variation and its impact on the business setting
Decision variables
The values of some variables are under direct control of the decision maker
Random/Uncertain Variable
Quantity whose values are not known with certainty is called
Population
The set of all elements of interest in a particular study
Sample
Subset of the population
Random sampling
Collecting a sample that ensures that (1) each element selected comes from the same population and (2) each element is selected independently.
Quantitative Data
Data is numeric and arithmetic operations, such as addition, substraction and division can be performed on them.
Categorical Data
If it cannot Arthimetic cannot be applied to them.
Categorical Data
This data is treated through counting the number of observations or computing the proportions of observations in each category
Cross-sectional data
Type of data that is collected from several entities at the same, or approximately the same, point in time.
Time series data
Collected over several periods of time.
Experimental study
Identify the Variable of interest → Using 2 or more Variables to impact the Variable of interest
Non-Experimental/Observational study
Make no attempt to control the variables of interest
Survey
Most common type of observational study.
Distributions
Help summarize many characteristics of a data set by describing how often certain values for a variable appear in that data set.
Distributions
created for both categorical and quantitative data, and they assist the analyst in gauging variation.
Classes
Bins for categorical data
Frequency distribution
Summary of the number that data shows up in observations.
Bin
The nonoverlapping groupings of data
Relative Frequency Distribution
Tabular summary of data showing the relative frequency for each bin.
Percent frequency distribution
Tabular summary of data showing the percent frequency for each bin.
Percent frequency distribution
can be used to provide estimates of the relative likelihoods of different values for a random variable. So
Bin Width
Largest Data Value - Smallest Data Value / No. Of bins
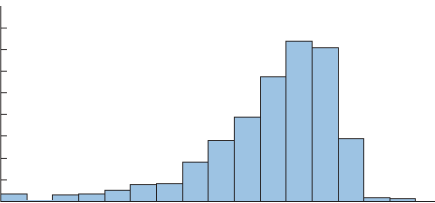
Histogram
Graphical presentation of a frequency distribution, relative frequency distribution, or percent frequency distribution of quantitative data.
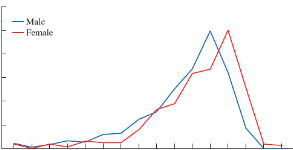
Frequency polygon
A chart used to display a distribution by using lines to connect the frequency values of each bin.
Frequency polygon
Comparing distributions, particularly for quantitative variables.
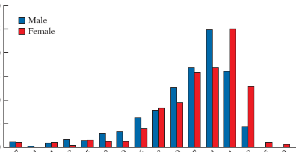
Histogram with Clustered Columns

Frequency Polygon

Histogram

Cumulative frequency distribution
Shows the number of data items with values less than or equal to the upper limit of each bin
Arithmetic Mean
The most commonly used measure of location
measure of central location for the data.
Mean
Median
Median
Value in the middle when the data are arranged in ascending order
Mode
Value that occurs most frequently in a data set
Multimodal
At least two modes
Geometric mean
Measure of location that is calculated by finding the nth root of the product of n values.
Geometric mean

Range
Simplest measure of veriability
Range
Can be found by subtracting the smallest value from the largest value in a data set.
Variance
Measure of variability that utilizes all the data
Variance
Deviation about the mean squared
Deviation
Observation about the mean is written Xi - x̄
Population Variance
can be computed directly rather than using sample variance For a population of N observations
Population Variance

Population Variance

Sample Variance

𝜇
denoting the population mean
Standard Deviation
positive square root of the variance
s
Standard Deviation
𝜎
to denote the population standard deviation.
Coefficient of Variation
Standard deviation/mean * 100%
Percentiles
Value of a variable at which a specified (approximate) percentage of observations are below that value.
Percentile

Percentile
Find that spot in the set
Compute
Steps of Percentile
Q1
First quartile, 25th
Q2
Second quartile, 50th
Q2
Third quartile, 75th
Quartile
It is often desirable to divide data into four parts, with each part containing approximately one-fourth, or 25 percent, of the observations.
Z-score
allows us to measure the relative location of a value in the data set.
Z-score
How far a particular value is from the mean relative to the data set’s standard deviation.
Z-score
standardized value.
Empirical rule
determine the percentage of data values that are within a specified number of standard deviations of the mean.
Approximately 68% of the data
values will be within 1 standard deviation of the mean.
Approximately 95% of the data
values will be within 2 standard deviations of the mean.
Almost all
data values will be within 3 standard deviations of the mean.
Outliers
An unusually large or unusually small data value. - extreme values
Outliers
Above or Below 3
Boxplots
Box-and-whisker plots.a graphical summary of the distribution of data
Outliers
in a boxplot these are extreme values that should be investigated to ensure data accuracy.
Interquartile range
Q3-Q1
Box plot
Upper limit Q3+1.5(IQR)
Box plot
Lower limit Q1-1.5(IQR)