MMW L5
 Call Kai
 Learn
Learn Practice Test
 Spaced Repetition
 Match
Match Flashcards
 Knowt Play
1/20

There's no tags or description
Looks like no tags are added yet.
Name | Mastery | Learn | Test | Matching | Spaced | Call with Kai | Chat |
|---|
No analytics yet
Send a link to your students to track their progress
21 Terms
Data Collection
The process of gathering and measuring information about variables on study established systematic procedure, which then enable to answer relevant questions at hand and evaluate outcomes.
Population
Refers to a set of people, objects, measurements, or events that belong to a defined group.
Sample
Is a subset of a population.
Quantitative Data
Can be counted, measured, and expressed using numbers.
Qualitative Data
Is descriptive and conceptual.
Discrete Variables
Obtained through counting. It can only assume a countable or finite number of values. It cannot take the form of decimals.
Continuous Variables
Are the result of measurement. It can assume infinitely many and continuous values.
Nominal
It is sometimes referred to as classificatory scale. This scale is used for classifying and labeling variables without quantitative value.
Ordinal
It possesses the characteristics of the nominal scale, where it classifies data, however, the classification has ranks. Data is shown in order of magnitude.
Interval
This scale possesses the characteristics of the nominal and ordinal scale where data are classified and ranked. Interval scale is a classification that describes the nature of information within the values assigned to variables. One problem with interval scale, it doesn’t have a “true zero”.
Ratio Scale
This scale possesses the characteristics of nominal, ordinal, and interval scale. However, if in interval scale there is no zero value, in ratio scale, zero is absolute. This is the point where the quality being measured does not exist.
Frequency Distribution Table
A grouping of the data into categories showing the number of observations in each of the nonoverlapping classes.
Frequency Table
Lists categories of scores along with their corresponding frequencies. The frequency for a category or class is the number of original scores that fall into that class.
Extended Frequency Table
Consists of columns that can generate various graphs or charts. It is a prerequisite for creating graphs and charts used in statistics.
Categorical Frequency Distribution
Used to organize nominallevel or ordinal
Grouped Frequency Distribution
Used when the range of the data set is large; the data must be group into classes whether it is categorical data or interval data. For interval data the class is more than one unit in width.
graphing statistical data
after organizing data into a frequency distributions, graphs are used to make the data easier to understand.
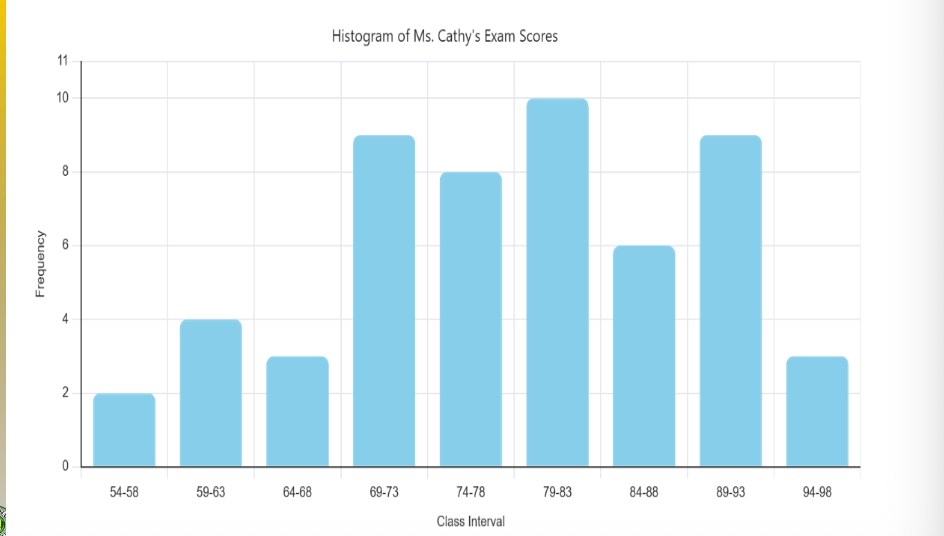
Histogram
A graph in which the classes are marked on the horizontal axis and the class frequencies on the vertical axis. The height of the bars represents the class frequencies, and the bars are drawn adjacent to each other.
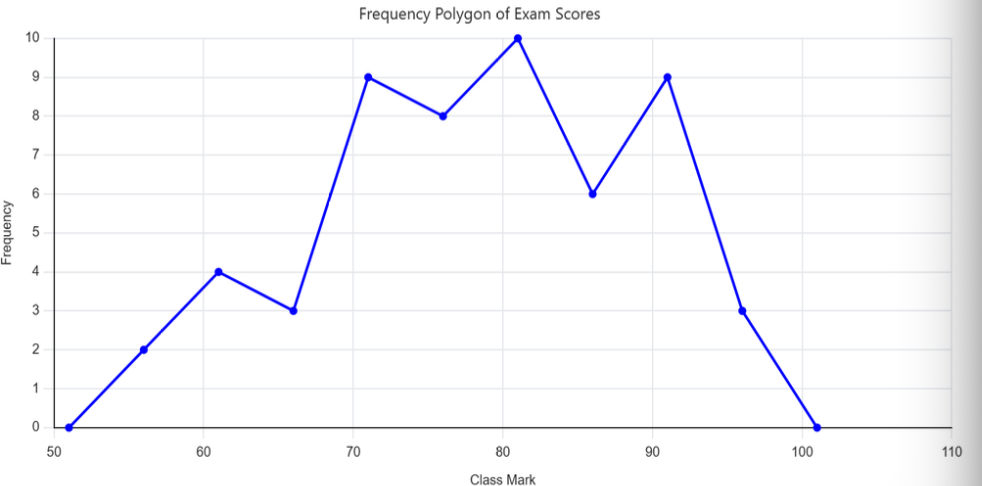
Frequency Polygon
A graph that displays the data using points which are connected by lines the frequencies are represented by the heights of the points at the midpoints of the classes. The vertical axis represents the frequency of the distribution while the horizontal represents the midpoints of the frequency distribution.
Cumulative Frequency Polygon (Ogive)
A graph that displays the cumulative frequencies for the classes in a frequency distribution. The vertical axis represents the cumulative frequency of the distribution while the horizontal axis represents the class mark of the frequency distribution.

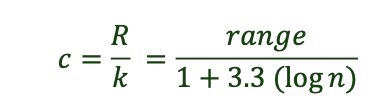
sturge’s rule