Psychological Assessment : Statistics Refresher
1/77
There's no tags or description
Looks like no tags are added yet.
Name | Mastery | Learn | Test | Matching | Spaced |
|---|
No study sessions yet.
78 Terms
measurement
as the act of assigning numbers or symbols to characteristics of things (people, events, whatever) according to rules
scale
a set of numbers (or other symbols) whose properties model empirical properties of the objects to which the numbers are assigned
sample space
refers to the values that a variable can take on.
discrete scale
has a sample space that can be counted
numbers between the sample space members are not allowed (no decimals)
continuous scale
values can be any real number in the scale’s sample space
can have fractions or numbers with as many decimals as needed
round off
What to do to scales so that the numbers do not convey unwarranted precision?
error
refers to the collective influence of all of the factors on a test score or measurement beyond those specifically measured by the test or measurement
Nominal scales
are the simplest form of measurement
involve classification or categorization based on one or more distinguishing characteristics, where all things measured must be placed into mutually exclusive and exhaustive categories
Ordinal Scales
assign people to categories
have categories with a clear and uncontroversial order
Measurements in which people are ranked
Interval scales
have meaningful distances between numbers.
Each unit on the scale is exactly equal to any other unit on the scale.
Because distance has a consistent meaning, it is possible to add and subtract scores, which allows for calculating means and standard deviations.
contain no absolute zero point
absolute zero
indicates the absence of a quantity.
Ratio scale
has a true zero point, which indicates the absence of the thing being measured.
distribution
may be defined as a set of test scores arrayed for recording or study.
raw score
a straightforward, unmodified accounting of performance that is usually numerical.
frequency distribution
all scores are listed alongside the number of times each score occurred
simple frequency distribution
indicate that individual scores have been used and the data have not been grouped
grouped frequency distribution
test-score intervals, also called class intervals, replace the actual test scores.
histogram
a graph with vertical lines drawn at the true limits of each test score (or class interval), forming a series of contiguous rectangles.
bar graph
numbers indicative of frequency also appear on the Y-axis, and reference to some categorization (e.g., yes/no/maybe, male/female) appears on the X-axis
frequency polygon
expressed by a continuous line connecting the points where test scores or class intervals (as indicated on the X-axis) meet frequencies (as indicated on the Y-axis).
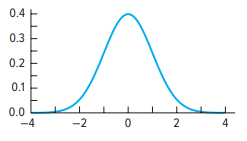
Normal
What type of skewness is this?
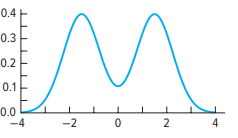
Bimodal
What type of skewness is this?
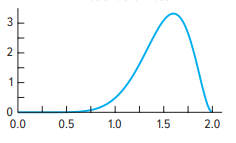
Negative
What type of skewness is this?
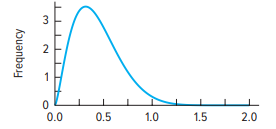
Positive
What type of skewness is this?
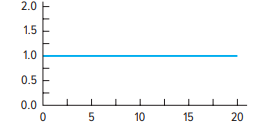
Uniform
What type of skewness is this?
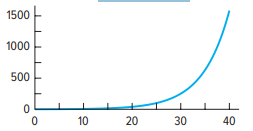
Exponential growth
What type of skewness is this?
measure of central tendency
a statistic that indicates the average or midmost score between the extreme scores in a distribution
arithmetic mean (or, more simply, mean)
referred to in everyday language as the “average.”
takes into account the actual numerical value of every score
Σ
summation meaning “the sum of”
Σ X
add all the test scores
mode
value that appears most frequently in a dataset
median
the middle value of a dataset when it's arranged in numerical order

formula for the arithmetic mean
bimodal distribution
there are two modes, which are the two peaks in the data
variability
an indication of how scores in a distribution are scattered or dispersed.
measures of variability
Statistics that describe the amount of variation in a distribution
range
a distribution is equal to the difference between the highest and the lowest scores.
quartiles
dividing points between the four quarters in the distribution
refers to a specific point whereas quarter refers to an interval.
interquartile range
measure of variability equal to the difference between Q3 and Q1.
ordinal statistic
semi-interquartile range
equal to the interquartile range divided by 2.
mean absolute deviation
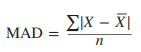

indicate that it is the absolute value of the deviation score (ignoring the positive or negative sign and treating all deviation scores as positive)
standard deviation
a measure of variability equal to the square root of the average squared deviations about the mean.
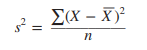
variance
equal to the arithmetic mean of the squares of the differences between the scores in a distribution and their mean.
skewness
the nature and extent to which symmetry is absent.
indication of how the measurements in a distribution are distributed
positive skew
relatively few of the scores fall at the high end of the distribution.
examination results may indicate that the test was too difficult.
More items that were easier would have been desirable in order to better discriminate at the lower end of the distribution of test scores.
negative skew
relatively few of the scores fall at the low end of the distribution.
results may indicate that the test was too easy.
more items of a higher level of difficulty would make it possible to better discriminate between scores at the upper end of the distribution
skewed
associated with abnormal, perhaps the distribution deviates from the symmetrical or so-called normal distribution
kurtosis
refer to the steepness of a distribution in its center
platykurtic
Distributions are generally described as relatively flat
leptokurtic
Distributions are generally described as relatively peaked
mesokurtic
Distributions are generally described as somewhere in the middle
normal curve
a bell-shaped, smooth, mathematically defined curve that is highest at its center.
From the center it tapers on both sides approaching the X-axis asymptotically
asymptotically
it approaches, but never touches, the axis
has two tails
tails
ends of the curve — the extreme values far away from the mean
Right tail
values far above the mean (for example, more than 2 or 3 standard deviations higher).
Left tail
values far below the mean (for example, more than 2 or 3 standard deviations lower).
standard score
raw score that has been converted from one scale to another scale, where the latter scale has some arbitrarily set mean and standard deviation.
are more easily interpretable than raw scores.
the position of a testtaker’s performance relative to other testtakers is readily apparent
z score
results from the conversion of a raw score into a number indicating how many standard deviation units the raw score is below or above the mean of the distribution.
zero plus or minus one scale
T scores
type of standard score that tells us how far a person’s test result is from the average, but it uses a special scale.
The mean (average) of T scores = 50
The standard deviation (SD) = 10
stanine score
It divides scores into nine broad categories (from 1 to 9).
Mean (average) = 5
Standard deviation (SD) ≈ 2
Each covers a half standard deviation range of performance.
linear transformation
one that retains a direct numerical relationship to the original raw score
nonlinear transformation
may be required when the data under consideration are not normally distributed yet comparisons with normal distributions need to be made
normalizing a distribution
involves “stretching” the skewed curve into the shape of a normal curve and creating a corresponding scale of standard scores
normalized standard score scale
refers to a scoring system that has been adjusted so the distribution of test scores follows the shape of a normal curve (bell curve), even if the original scores were skewed.
coefficient of correlation (or correlation coefficient)
a number that provides us with an index of the strength of the relationship between two things
correlation
an expression of the degree and direction of correspondence between two things
coefficient of correlation (r)
expresses a linear relationship between two (and only two) variables, usually continuous in nature
the numerical index that expresses this relationship: It tells us the extent to which X and Y are “co-related.”
Pearson r/Pearson correlation coefficient and the Pearson product-moment coefficient of correlation
r can be the statistical tool of choice when the relationship between the variables is linear and when the two variables being correlated are continuous (or, they can theoretically take any value)
coefficient of determination
an indication of how much variance is shared by the X- and the Y-variables
moment
describes a deviation about a mean of a distribution
deviates
Individual deviations about the mean of a distribution
referred to as the first moments of the distribution
Spearman’s rho
rank-order correlation coefficient, a rank-difference correlation coefficient
scatterplot
a simple graphing of the coordinate points for values of the X-variable (placed along the graph’s horizontal axis) and the Y-variable (placed along the graph’s vertical axis).
are useful because they provide a quick indication of the direction and magnitude of the relationship, if any, between the two variables
curvilinearity
refers to an “eyeball gauge” of how curved a graph is
outlier
an extremely atypical point located at a relatively long distance—an outlying distance—from the rest of the coordinate points in a scatterplot
Meta-analysis
may be defined as a family of techniques used to statistically combine information across studies to produce single estimates of the data under study
effect size
refers to an estimate of the strength of the relationship (or the size of the differences) between groups