Efficient Diversification in Investment Management
1/67
There's no tags or description
Looks like no tags are added yet.
Name | Mastery | Learn | Test | Matching | Spaced |
|---|
No study sessions yet.
68 Terms
Asset Allocation
Distribution of investments among various assets.
Optimal Risky Portfolio
Portfolio maximizing return for a given risk level.
Diversification
Spreading investments to reduce overall portfolio risk.
Portfolio Risk
Risk associated with the combined assets in a portfolio.
General Economic Conditions
Macro factors affecting stock returns, like inflation.
Firm-Specific Factors
Company-specific elements influencing stock performance.
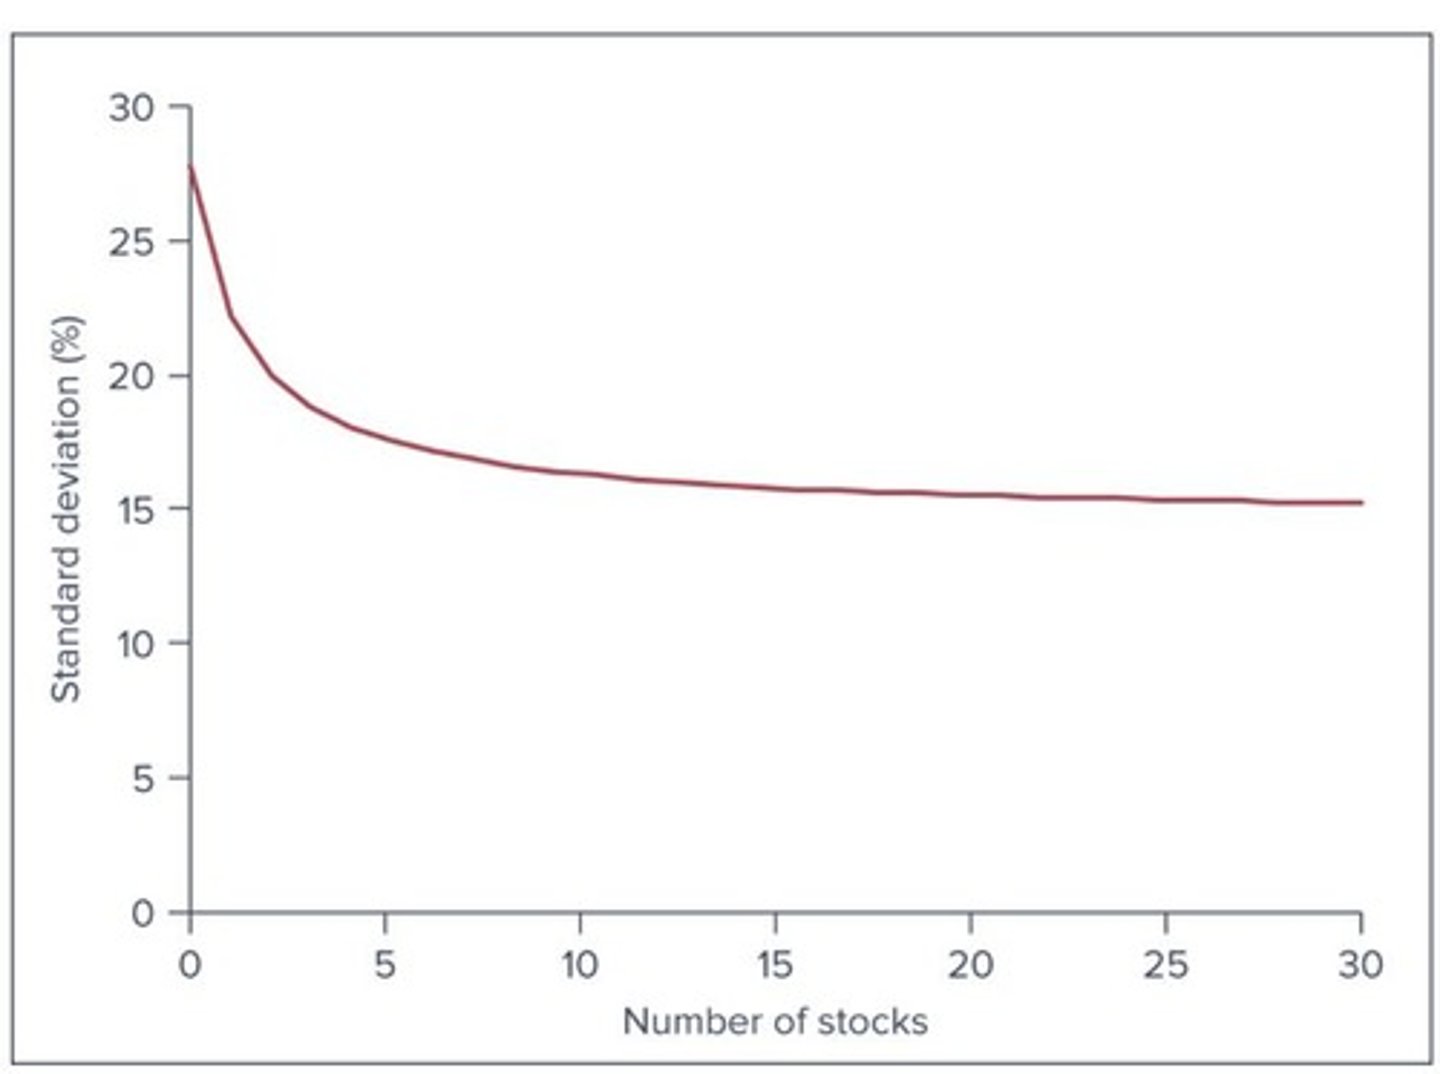
Diversification
Reduces firm-specific risk through varied investments.
Unique Risk
Risk specific to a single asset or firm.
Market Risk
Risk affecting all firms, non-diversifiable.
Efficient Diversification
Constructs portfolios minimizing risk for expected return.
Asset Allocation
Distribution of investments among various asset categories.
Optimal Risky Portfolio
Best combination of risky assets for investors.
Risk Pooling
Combining independent risks to reduce overall risk.
Risk Sharing
Mitigates exposure to individual investment risks.
True Diversification
Spreads fixed investment across multiple uncertainties.
Time Diversification
Investing over time reduces market exposure.
Covariance
Measures how asset returns vary together.
Correlation Coefficient
Scale of covariance from -1 to 1.
Rate of Return on Portfolio
Weighted average of component securities' returns.
Expected Rate of Return
Weighted average of expected returns on assets.
Risk-Return Trade-Off
Balancing risk against expected portfolio returns.
Investment Opportunity Set
Available portfolio risk-return combinations for investors.
Mean-Variance Criterion (MVC)
Investors prefer higher mean, lower variance assets.
Capital Allocation Line (CAL)
Graph showing risk-return trade-off with risk-free asset.
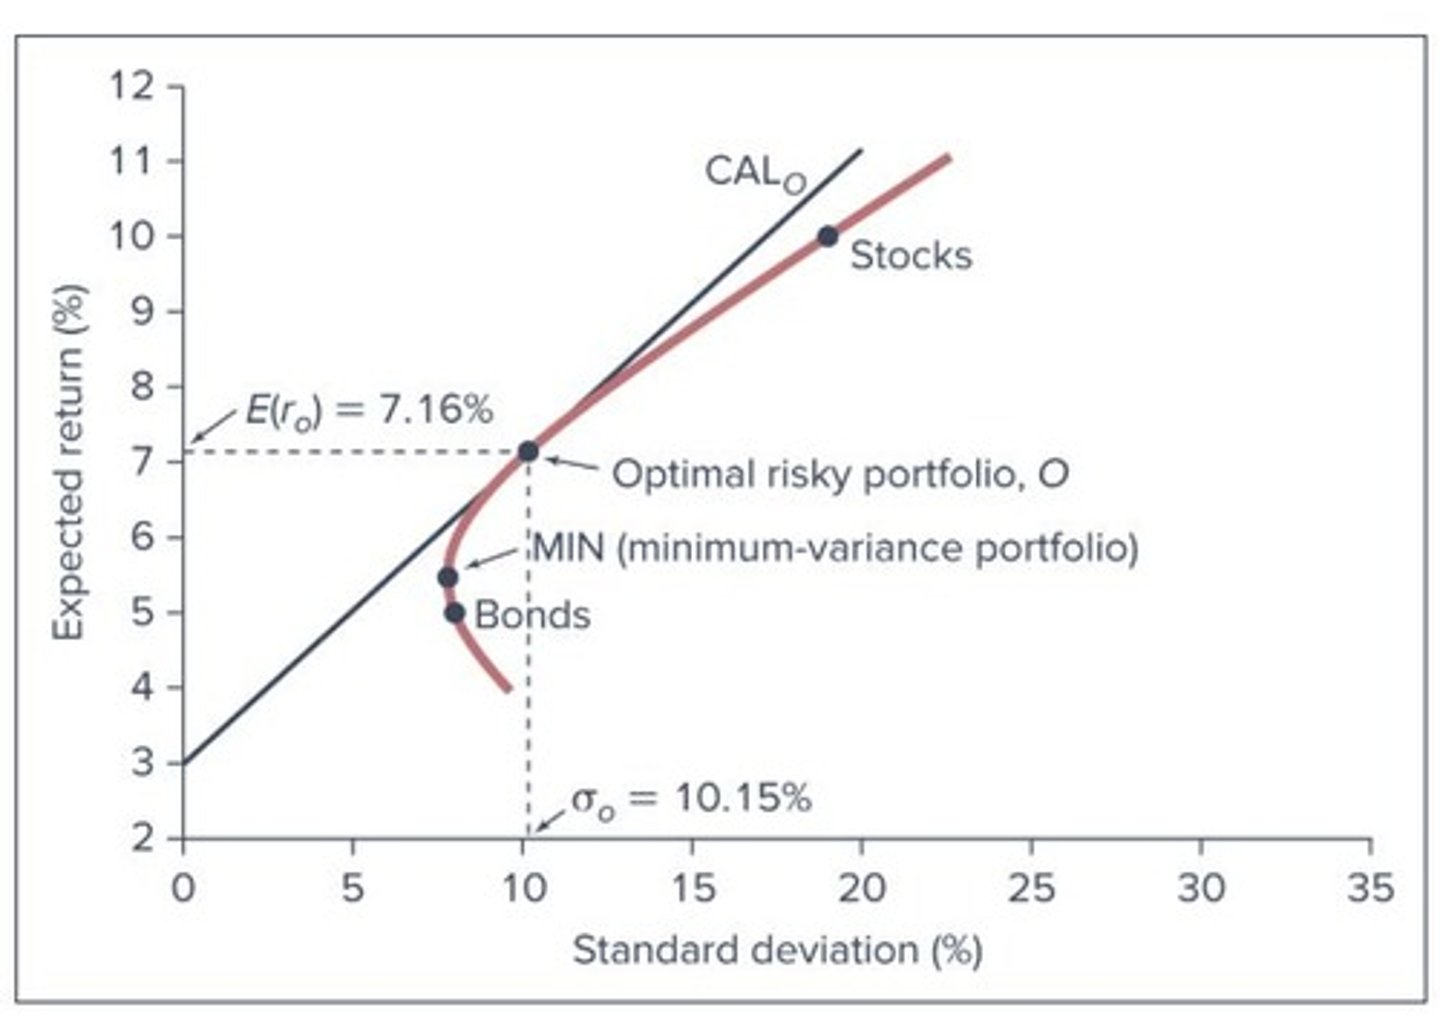
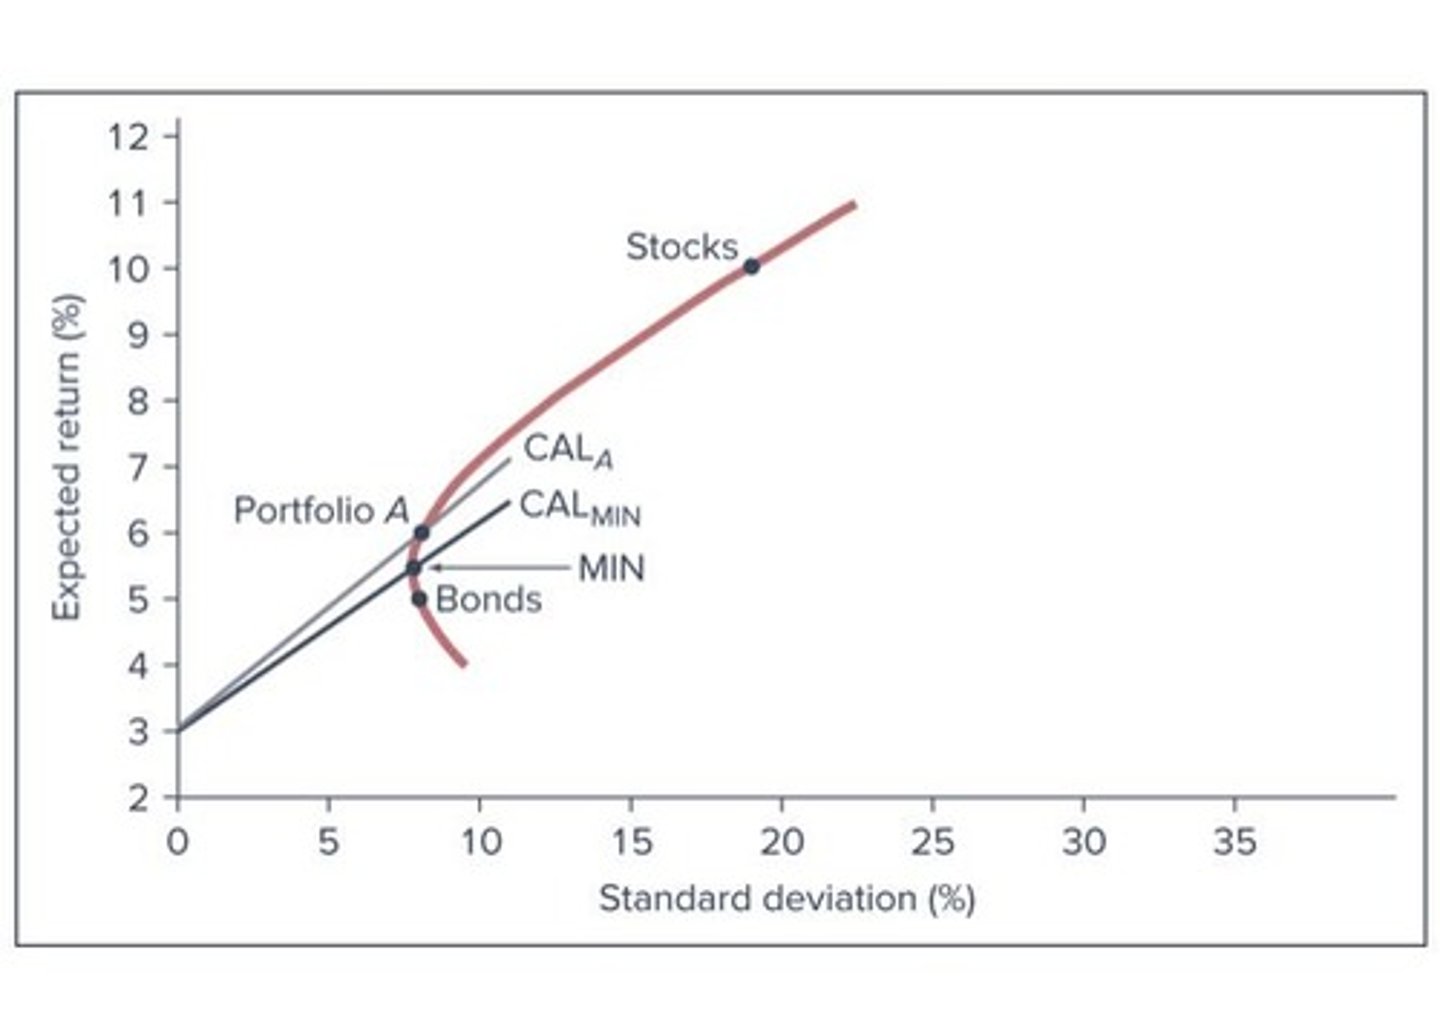
Sharpe Ratio
Measures risk-adjusted return of an investment.
Optimal Portfolio
Best mix of risky and safe assets.
Investor Risk Aversion
Preference for lower risk investments by investors.
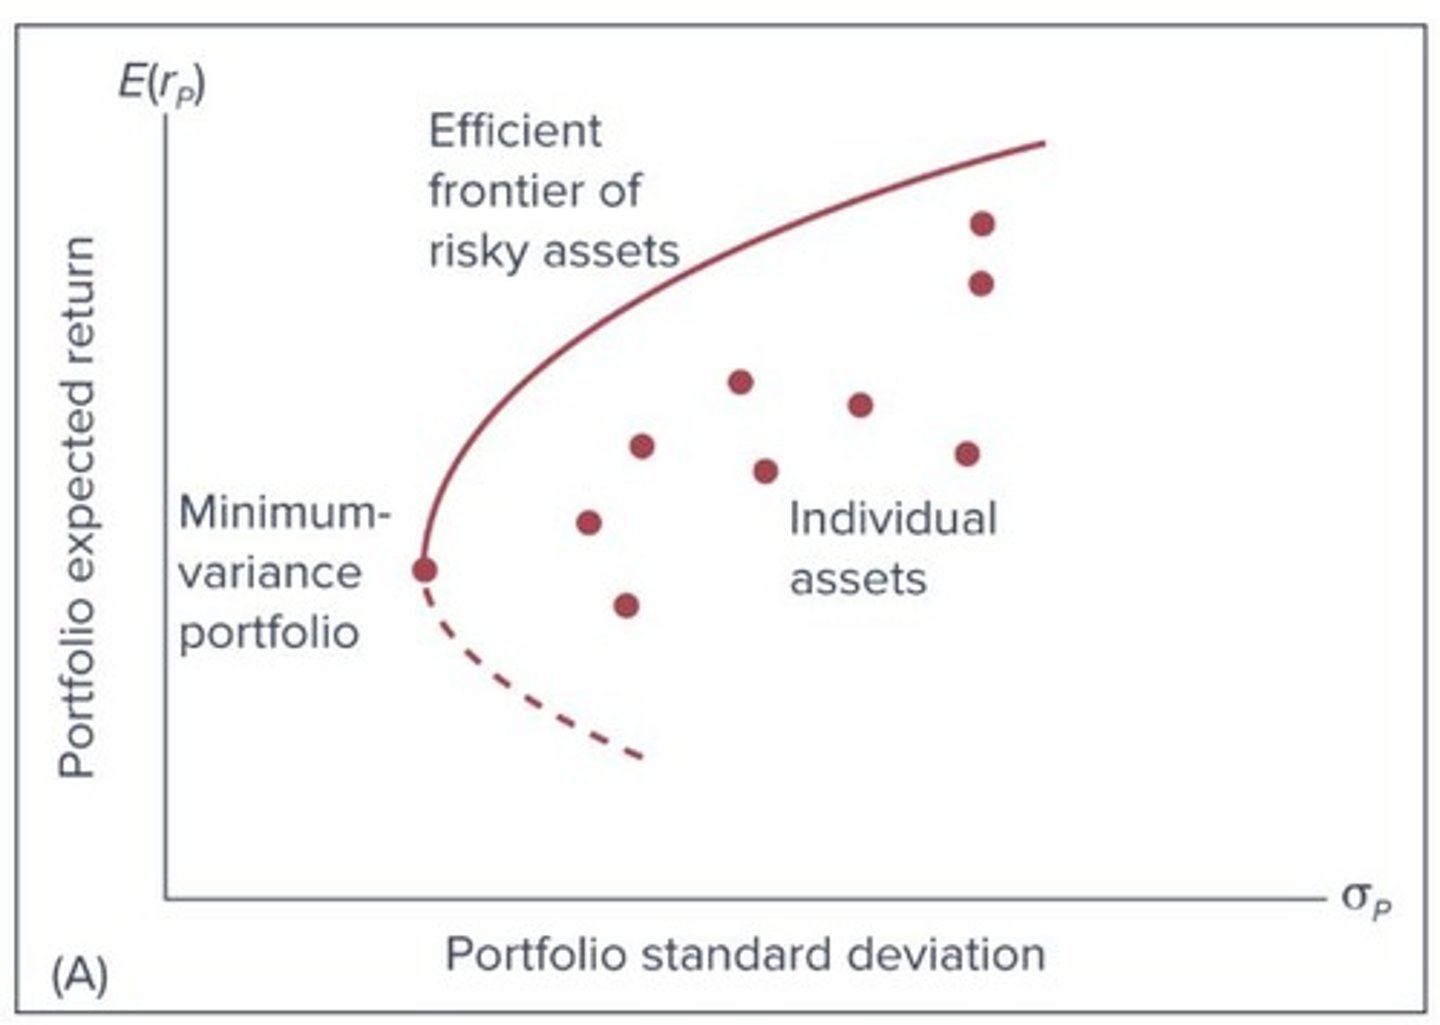
Efficient Frontier
Maximizes expected return for given portfolio volatility.
Markowitz Model
Finds efficient frontier through risk-return optimization.
Short-Sale Restriction
Limitations on selling borrowed securities.
Dividend Yield
Annual dividend payment divided by stock price.
SRI Constraints
Socially Responsible Investing limitations on portfolio.
ESG Constraints
Environmental, Social, Governance criteria for investments.
Optimal Portfolio
Portfolio with highest Sharpe ratio on CAL.
Capital Allocation Line (CAL)
Graph showing risk-return trade-off of portfolios.
Sharpe Ratio
Measure of risk-adjusted return of an investment.
Asset Allocation
Distribution of investments across various asset classes.
Optimal Risky Portfolio
Portfolio maximizing expected return for given risk.
Single-Index Stock Market
Market model using a single index for analysis.
Markowitz Model
Framework for constructing efficient portfolios based on risk.
Efficient Frontier
Graph of optimal portfolios offering highest returns for risk.
Standard Deviation (SD)
Measure of investment return volatility or risk.
Expected Return (E(r))
Projected return of an investment over time.
Short-Sale Restriction
Limitations on selling borrowed securities in trading.
Minimum Dividend Yield
Lowest acceptable dividend return for investments.
Finding Optimal Allocation
Process of determining best asset distribution.
Separation Property
Independence of risky portfolio and risk-free asset choice.
Optimal Risky Portfolio
Best portfolio for all clients, regardless of risk aversion.
Capital Allocation Line (CAL)
Graphical representation of risk-return trade-off.
Index Model
Relates security returns to market index and firm factors.
Systematic Risk
Risk common to the entire economy, measured by beta.
Alpha (α)
Expected excess return when market excess is zero.
Beta (β)
Sensitivity of a security's return to market return.
Residual (ei)
Return variance component independent of market factors.
Security Characteristic Line (SCL)
Plot of predicted excess returns against market return.
Variance of Return
Sum of systematic risk and firm risk components.
R-squared
Measure of systematic variance's importance in total variance.
Cyclical Stock
Higher sensitivity to market conditions (β > 1).
Defensive Stock
Lower sensitivity to market conditions (β < 1).
Mean Reversion
High-β securities tend to lower β over time.
Sharpe Ratio
Measure of return per unit of risk taken.
Treynor-Black Model
Combines active and passive portfolio management.
Weight (wi)
Proportion of total portfolio allocated to security.
Excess Return (Ri)
Difference between security return and risk-free rate.
Market Excess Return (RM)
Return of the market above the risk-free rate.
Scatter Diagram
Visual representation of security versus market relationship.
Slope of Scatter Diagram
Indicates sensitivity to market conditions.
Optimization Difficulty
Challenges in acquiring accurate input data for models.